Hightopo replaced three separate databases with a single Lindorm instance and reduced storage and maintenance costs by 60%, while handling peak workloads of 1 million transactions per second (TPS).
Customer profile
Hightopo was founded in 2013 and is headquartered in Xiamen, with branches in cities including Beijing, Shanghai, Tianjin, Dalian, and Qingdao. The company specializes in visual monitoring and operations and maintenance (O&M) for industrial Internet of Things (IIoT), delivering end-to-end visualization management across consultation, design, implementation, and after-sales services.
Its flagship product, HT for Web, is a proprietary web-based 2D and 3D graphics software application used across telecommunications, electricity, hydropower, transportation, petrochemical, manufacturing, medical, and industrial control industries.
Challenges
Hightopo's monitoring platform ingests four types of data simultaneously: time series metrics from sensors, log data, user experience data, and network traffic data. As connected devices and data volumes grew, its three-database architecture became a bottleneck.
| Database | Data stored | Pain point |
|---|---|---|
| Elasticsearch | Sensor data | High O&M complexity; scaling cost increased with data volume |
| Prometheus | Third-party system data | Limited to time series; no support for heterogeneous data models |
| HBase | End-device data | Complex cross-system queries; difficult to virtualize data across stores |
Running three separate systems meant separate ingestion pipelines, separate scaling decisions, and no unified query path for the visualization layer. As HT for Web needed to render real-time dashboards across all data types, query performance degraded and integration costs climbed.
Why Hightopo chose Lindorm
Hightopo evaluated solutions against four requirements:
Replace three databases with one: eliminate cross-system O&M without losing support for heterogeneous data models
Cut storage costs for low-value-density IoT data: built-in compression needed, not just tiered storage
Handle concurrent writes at scale: peak ingestion from sensors, edge devices, and third-party systems required high-throughput write performance
Migrate without rewriting integrations: HT for Web and existing data pipelines needed to keep working
Lindorm met all four requirements. Its native API compatibility with OpenTSDB, Prometheus, and HBase meant Hightopo could migrate without re-engineering existing integrations. Its multi-model engine — wide table engine, search engine, and time series engine in a single instance — eliminated the need to run separate systems.
Solution
Hightopo consolidated all monitoring data into a single Lindorm instance running a multi-model hyper-converged architecture.
Architecture overview:
Data flows from end devices, edge devices, sensors, and third-party systems into Lindorm's multi-model engine. HT for Web connects to Lindorm via SDK or RESTful API to power real-time monitoring dashboards.
Data transfer integrations supported:
Alibaba Cloud Data Transmission Service (DTS)
Alibaba Cloud Data Management (DMS)
Apache NiFi
Apache Sqoop
Other third-party ETL services
API compatibility:
Lindorm is compatible with the native APIs of OpenTSDB, Prometheus, and HBase, enabling seamless connection to major ecosystem services and tools.
Results
Hightopo deployed the Lindorm-based architecture for two customers: a company in the Ubiquitous Electric Internet of Things (UEIoT) industry and a company in the smart building field.
| Metric | Result |
|---|---|
| Storage and maintenance cost | 60% reduction |
| Peak concurrency | Up to 1 million TPS |
| Time series capacity | Up to 400,000 time series |
| Availability SLA | 99.95% |
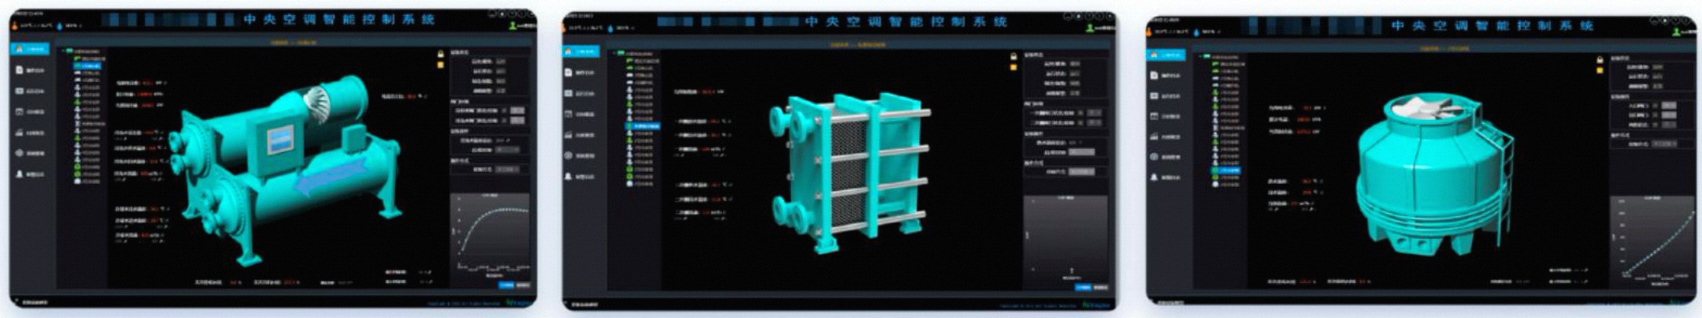
The following screenshots show the monitoring dashboards running on the new architecture.
Figure 1. Data visualization of the monitoring system in the UEIoT
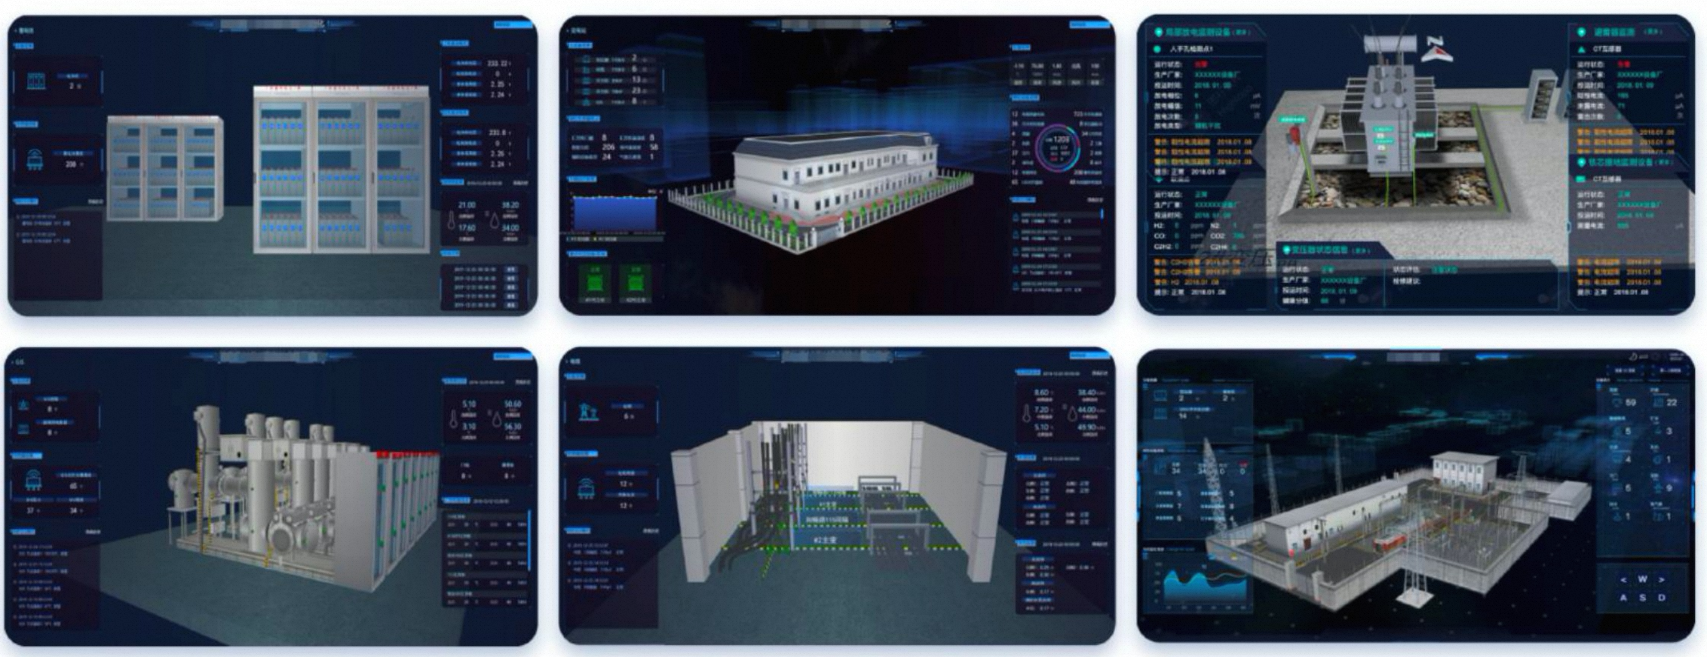
Figure 2. Data visualization of the monitoring system in the smart building industry
Use cases
Real-time monitoring dashboards
Situation awareness and risk monitoring
Defect detection based on device monitoring data
Tracing and analysis of all faults
AI-powered anomaly detection