OpenSearch allows you to use CloudMonitor to monitor applications. CloudMonitor collects metrics, such as Doc Size, Compute Resource, and QPS. You can use CloudMonitor to monitor the resource usage of an application and configure alert rules for metrics.
Metrics
Metric | Description |
Doc Size | The total storage capacity that is used. |
Doc Size Ratio | The ratio of the storage usage to the purchased storage space. |
Doc Count | The total number of documents. |
QPS | The number of queries per second. |
Loss QPS | The number of queries that are throttled per second. |
Latency | The duration of a single query, in milliseconds. |
Computing Resource | The number of logical computing units used for queries per second. |
Compute Resource Ratio | The ratio of the logical computing units that are used for queries per second to the quota of logical computing units. |
Compute Cost | The number of logical computing units that are consumed in a single query. |
Daily Peak Compute Resource | The maximum number of logical computing units that can be used for queries per day. |
APP Batch Import Throughput | The number of bytes that an application reads from a data source per second when full data is imported. |
APP Batch Read TPS | The number of documents that an application reads from a database per second when full data is imported. |
APP Batch Write TPS | The number of documents that an application writes to an engine per second when full data is imported and processed. In data processing, data may be merged or processed by using plug-ins. |
APP Realtime Input Throughput | The number of bytes that an application reads from a data source or by calling an API operation per second. |
realtime trigger latency | The latency in updating the real-time data to the secondary table. |
realtime write latency | The latency in updating the real-time data to the primary table. |
rt read tps | The number of documents that an application reads from a data source or by calling an API operation per second. |
rt write tps | The number of documents that an application writes to an engine per second when real-time data is imported and processed. In data processing, data may be merged or processed by using plug-ins. |
slave trigger tps | The number of documents updated in the primary table per second due to the update of secondary tables. For example, one entry in a secondary table is updated per second, and the number of entries in the primary table is three times that of entries in the secondary table. In this case, three entries in the primary table may be updated per second. |
write rate limit qps | The number of times that an application pushes data per second to trigger throttling. |
View metrics that are monitored by CloudMonitor
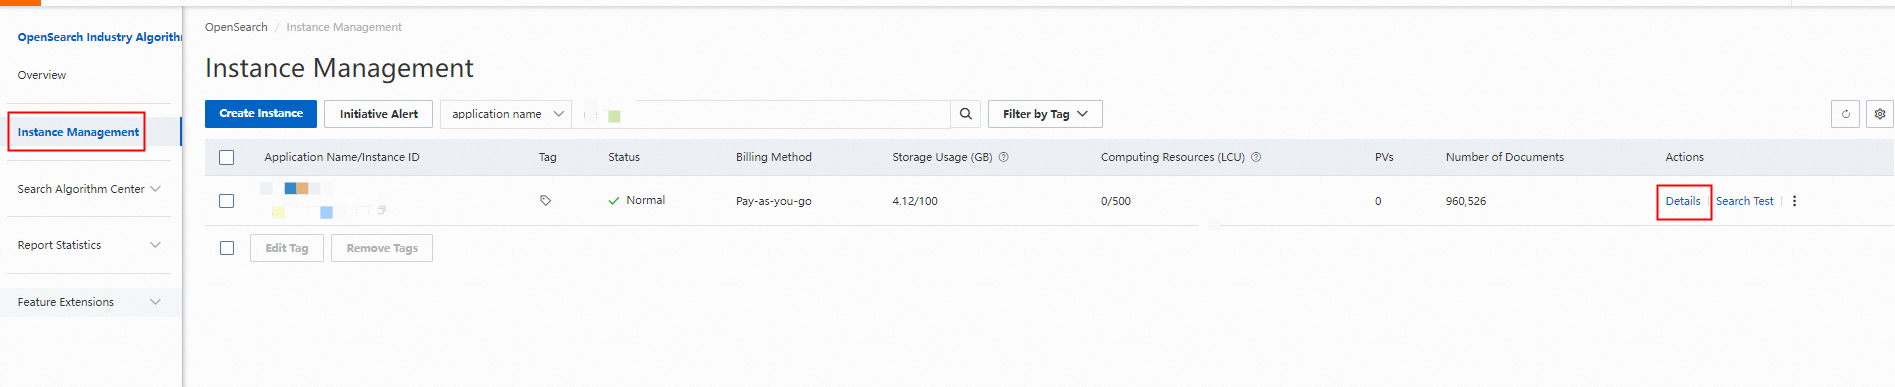
Log on to the OpenSearch console. On the Instance Management page, find the desired application instance and click Details in the Actions column.
2. In the upper-right corner of the Application Details page, click View CloudMonitor Metrics to view the resource usage of the application.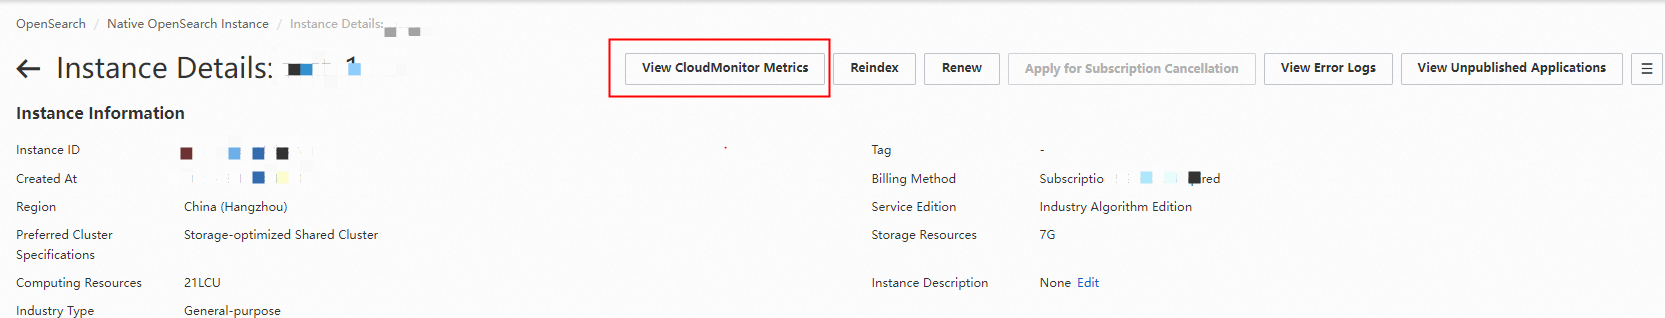
3. View metrics on the View CloudMonitor Metrics page.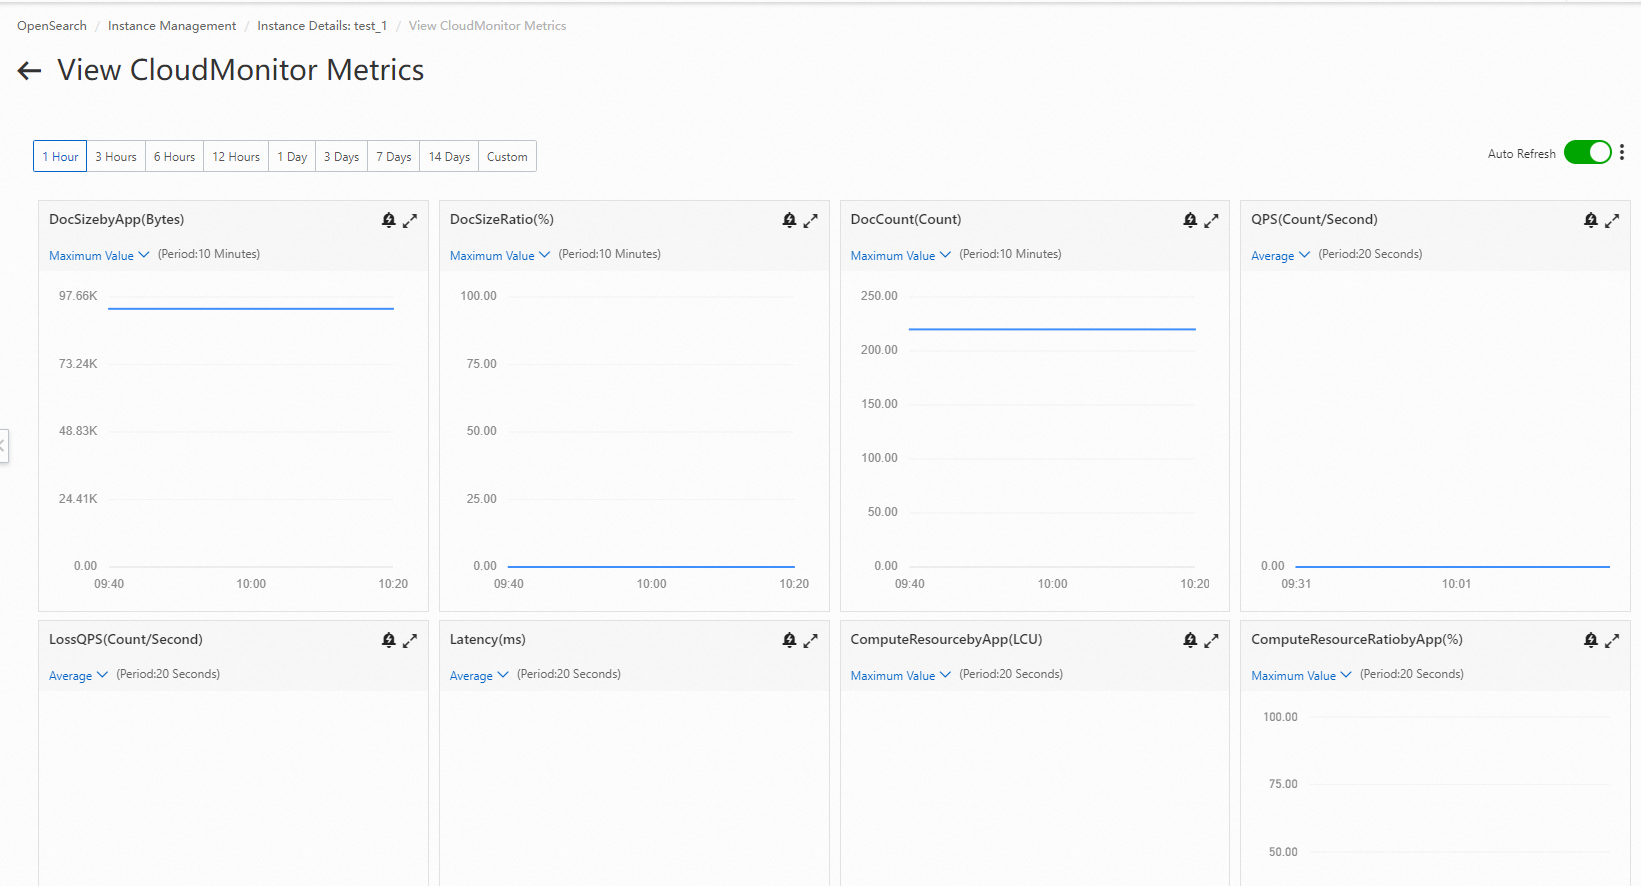
Enable the initiative alert feature
The following metrics are configured by default for the initiative alert feature: capacity usage, computing resource usage, QPS, and real-time processing latency. You can enable the initiative alert feature by performing the following steps:
Log on to the OpenSearch console with an Alibaba Cloud account. The Instance Management page appears. On the Instance Management page, click Initiative Alert. You can also log on to the CloudMonitor console and perform the operations described in Step 3.
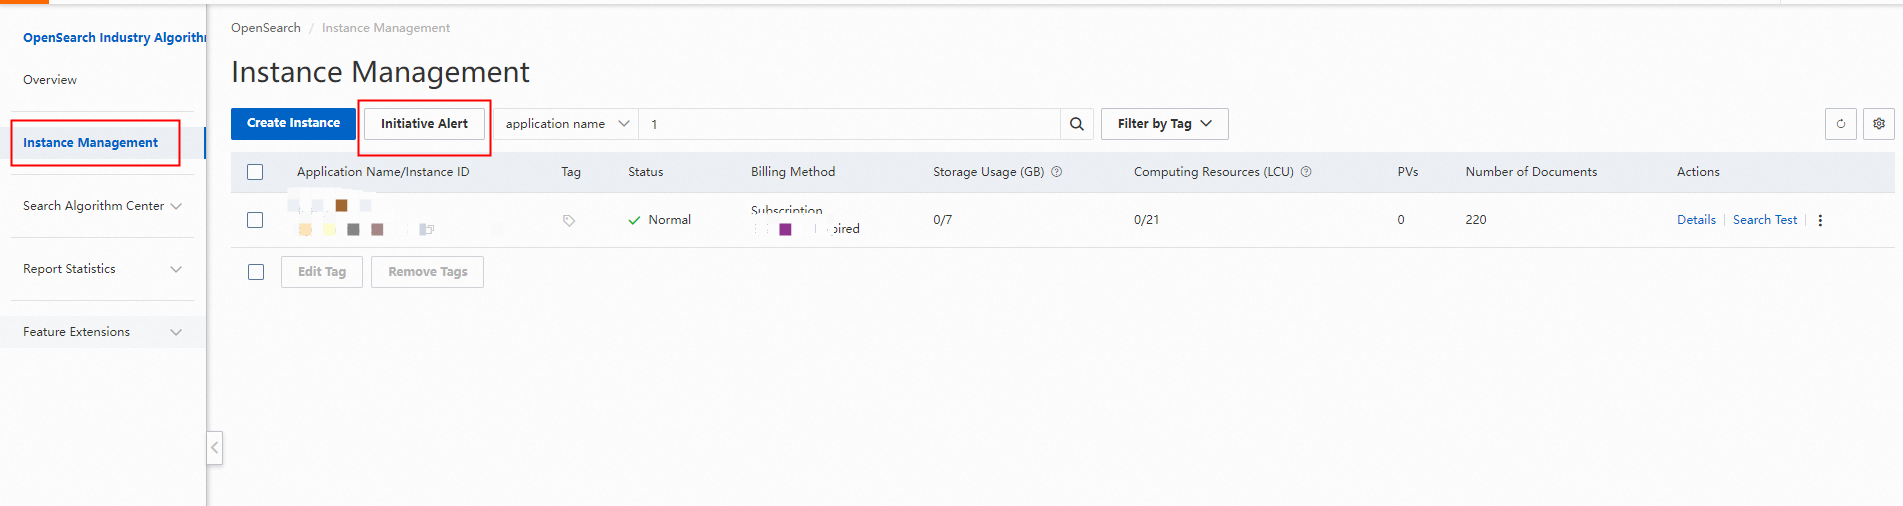
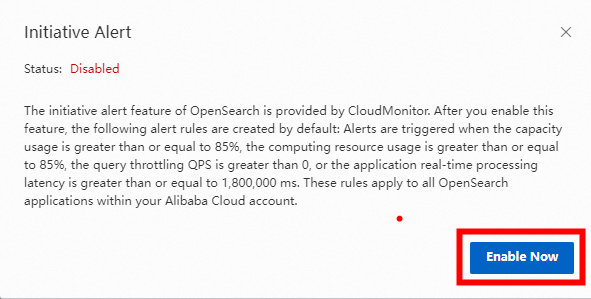
2. The Initiative Alert message appears with Status being Disabled. Click Enable Now. If the status is Enabled, you do not need to click the Enable Now button.
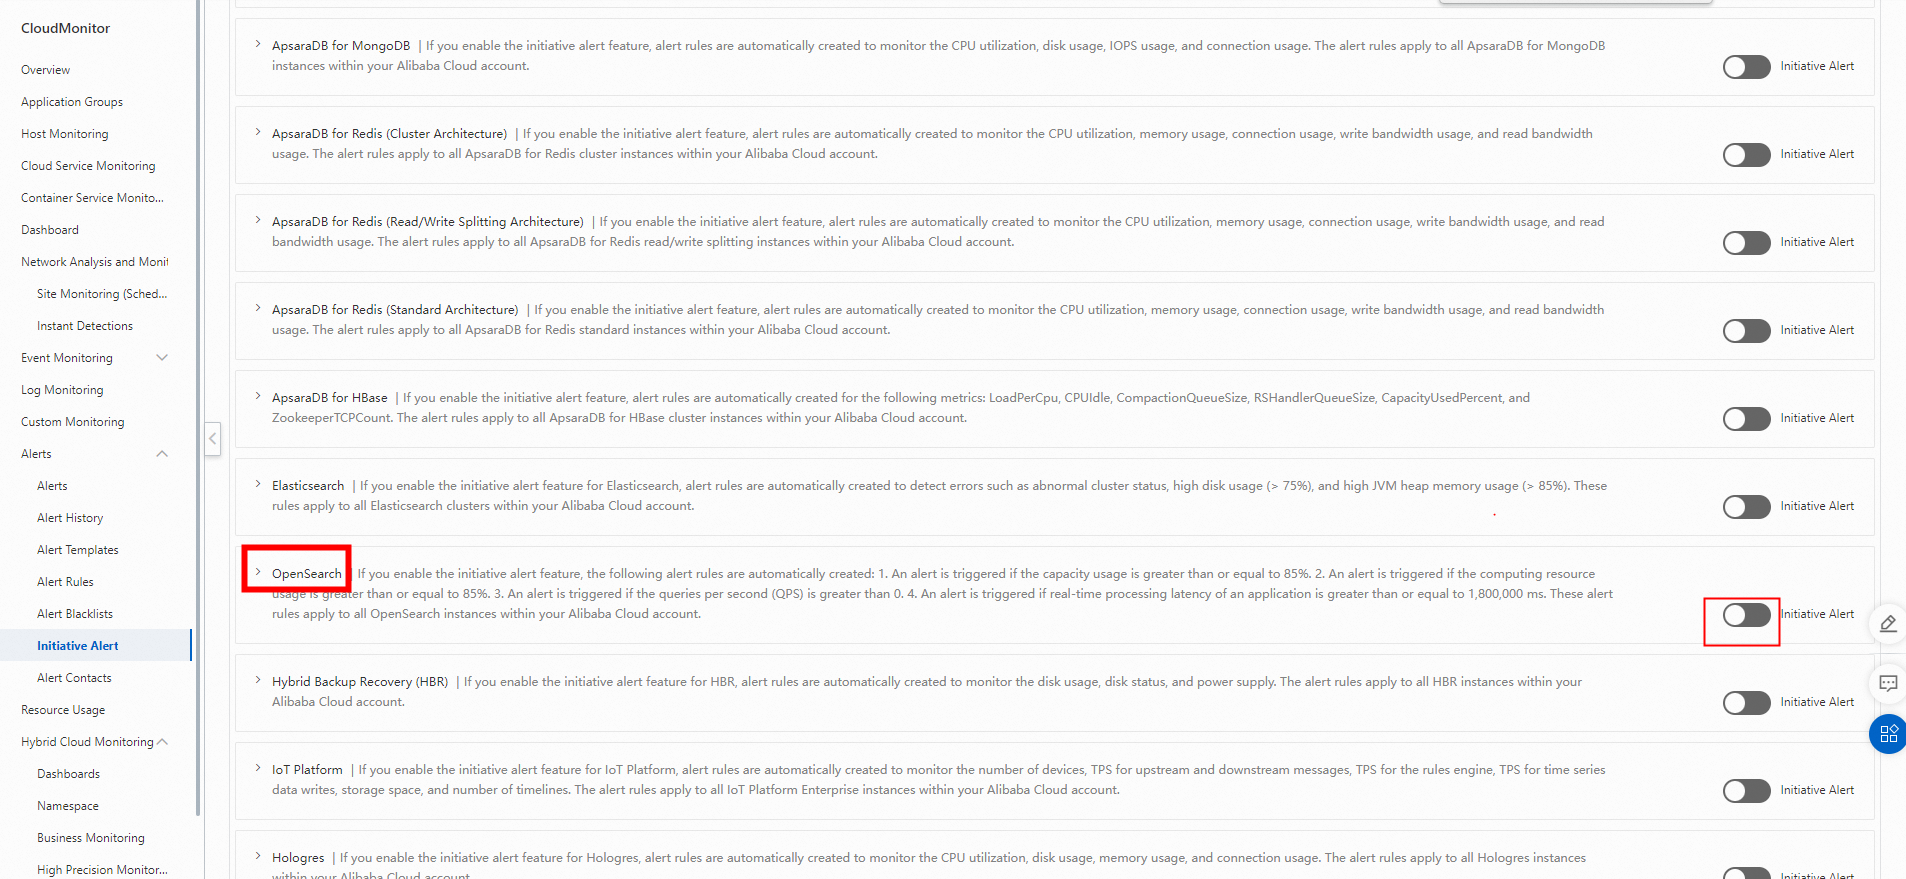
3. The CloudMonitor console appears. In the left-side navigation pane, choose Alerts > Initiative Alert. On the Initiative Alert page, find OpenSearch and turn on Initiative Alert. You can click the Show icon next to OpenSearch to view and configure alert rules.
Create custom alert rules
This section describes how to create a custom alert rule and configure alert contacts. For more information, see Create an alert rule.
If these topics cannot help you resolve the issues related to CloudMonitor, submit a ticket.