Auditbeat is a lightweight data shipper that collects audit logs from the Linux audit framework, monitors file changes in critical directories, and sends structured data to Elasticsearch for analysis in Kibana.
By the end of this guide, you will have:
Created and configured an Auditbeat shipper in the Alibaba Cloud Elasticsearch console
Collected audit events from the Linux audit framework using the auditd module
Monitored changes to critical files and directories using the file integrity module
Visualized the collected data in Kibana Discover and dashboards
How it works
Auditbeat supports two modules for collecting security-relevant data:
Auditd — Subscribes directly to the Linux kernel and receives audit events as they occur. Use this module to track system calls, process executions, network connections, and identity-related file changes.
File integrity — Watches specified directories in real time and detects file changes. Requires Linux kernel 2.6.13 or later (inotify support). Use this module to detect unauthorized modifications to binary files, configuration files, and other critical paths.
The open-source Auditbeat distribution includes an experimental system module. This module may be removed or significantly changed in a future release. Do not use it in production.Auditbeat integrates natively with Logstash, Elasticsearch, and Kibana.
Prerequisites
Before you begin, ensure that you have:
An Alibaba Cloud Elasticsearch cluster. See Create an Alibaba Cloud Elasticsearch cluster.
Auto Indexing enabled on the Elasticsearch cluster. Alibaba Cloud Elasticsearch disables this feature by default for security. Beats requires it when you select Elasticsearch as the output. See Access and configure an Elasticsearch cluster.
An Elastic Compute Service (ECS) instance in the same virtual private cloud (VPC) as the Elasticsearch cluster. Beats supports Alibaba Cloud Linux (Alinux), Red Hat Enterprise Linux (RHEL), and CentOS only. See Create an instance on the Custom Launch tab.
Cloud Assistant and Docker installed on the ECS instance. See Install Cloud Assistant Agent and Deploy and use Docker on Alibaba Cloud Linux 2 instances.
Step 1: Create and configure the Auditbeat shipper
Log on to the Alibaba Cloud Elasticsearch console.
In the left-side navigation pane, click Beats Data Shippers.
In the Create Shipper section, click Auditbeat.
Configure the shipper.
For configuration steps and field descriptions, see Collect the logs of an ECS instance and Prepare a YML configuration file for a shipper. The following figure shows the configuration used in this example.
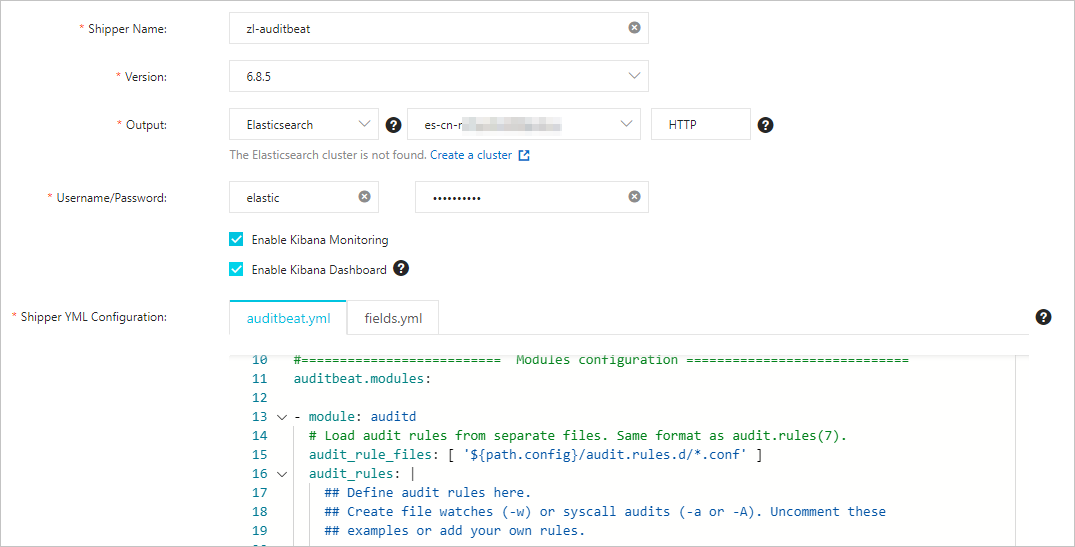
- Enable Kibana Monitoring — Enables Auditbeat service monitoring in the Kibana console. - Enable Kibana Dashboard — Generates pre-built charts in Kibana. No additional YML configuration is required. Because Alibaba Cloud Kibana is deployed in a VPC, enable the Private Network Access feature on the Kibana Configuration page before using this option. See Configure a public or private IP address whitelist for Kibana.
This example uses the default auditbeat.yml configuration. The module-specific settings are described below.
Auditd module
- module: auditd
  # Load audit rules from separate files. Same format as audit.rules(7).
  audit_rule_files: [ '${path.config}/audit.rules.d/*.conf' ]
  audit_rules: |
Parameter Description audit_rule_filesPaths to audit rule files. Wildcards are supported. Default files for 32-bit and 64-bit operating systems are provided — select the file that matches your OS. audit_rulesAudit rules applied directly in the configuration. To view the active audit rules on your ECS instance, run:
./auditbeat show auditd-rulesThe default rules are:
-a never,exit -S all -F pid=26253
-a always,exit -F arch=b32 -S all -F key=32bit-abi
-a always,exit -F arch=b64 -S execve,execveat -F key=exec
-a always,exit -F arch=b64 -S connect,accept,bind -F key=external-access
-w /etc/group -p wa -k identity
-w /etc/passwd -p wa -k identity
-w /etc/gshadow -p wa -k identity
-a always,exit -F arch=b64 -S open,truncate,ftruncate,create,openat,open_by_handle_at -F exit=-EACCES -F key=access
-a always,exit -F arch=b64 -S open,truncate,ftruncate,create,openat,open_by_handle_at -F exit=-EPERM -F key=access
The default rules cover most common security monitoring requirements. To use custom rules, edit the rule files in the
audit.rules.ddirectory.File integrity module
- module: file_integrity
  paths:
  - /bin
  - /usr/bin
  - /sbin
  - /usr/sbin
  - /etc
Parameter Description pathsDirectories to monitor. Default paths are /bin,/usr/bin,/sbin,/usr/sbin, and/etc. Add or remove paths based on your requirements.Select the ECS instance on which to install the shipper.
Step 2: Start the shipper and verify installation
Click Start. The Start Shipper message appears.
Click Back to Beats Shippers. In the Manage Shippers section of the Beats Data Shippers page, find the shipper you just created.
Wait for the state column to show Enabled 1/1, then click View Instances in the Actions column.
In the View Instances panel, confirm that Installed Shippers shows Normal Heartbeat. This indicates the shipper is running correctly on the ECS instance.
Step 3: View results in Kibana
Log on to the Kibana console of your Elasticsearch cluster. See Log on to the Kibana console.
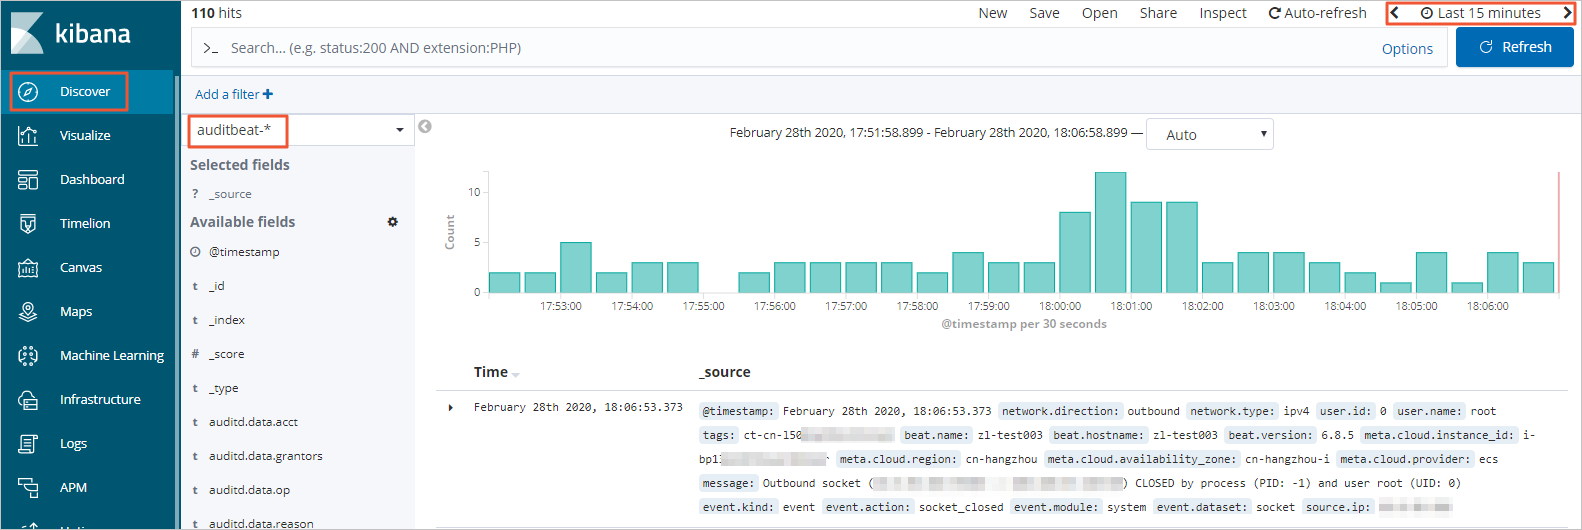
In the left-side navigation pane, click Discover. Select auditbeat-\* from the index pattern drop-down list in the upper-left corner and set a time range in the upper-right corner. Auditbeat data collected within the selected period is displayed.
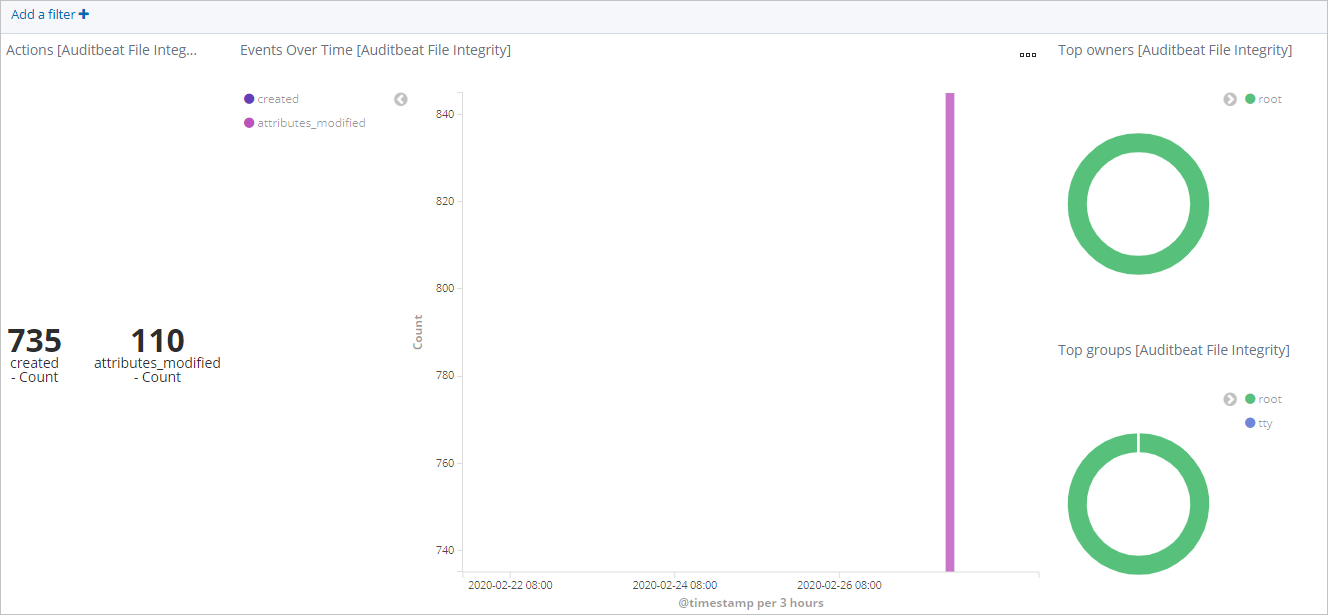
In the left-side navigation pane, click Dashboard.
In the Dashboards section, click [Auditbeat File Integrity] Overview. Set a time range to view file change events within that period.
Troubleshooting
Auditbeat conflicts with the auditd process
When the auditd module is enabled, other monitoring tools that also subscribe to the Linux audit framework may interfere with Auditbeat. If the auditd process is already registered to receive kernel audit events, Auditbeat may encounter an error.
Run the following commands to diagnose and resolve the conflict:
Check whether
auditdis running:service auditd statusStop the
auditdservice:service auditd stop