PAI-TensorFlow logs include pipeline running status logs and LogView logs. The LogView logs of PAI-TensorFlow contain more information about a pipeline. If the system reports an error when you run a pipeline, you can view the details of the errors based on the logs.
GPU-accelerated servers will be phased out. You can submit TensorFlow tasks that run on CPU servers. If you want to use GPU-accelerated instances for model training, go to Deep Learning Containers (DLC) to submit jobs. For more information, see Submit training jobs.
The following figure shows an example of the logs that are generated after you submit a PAI-TensorFlow task. 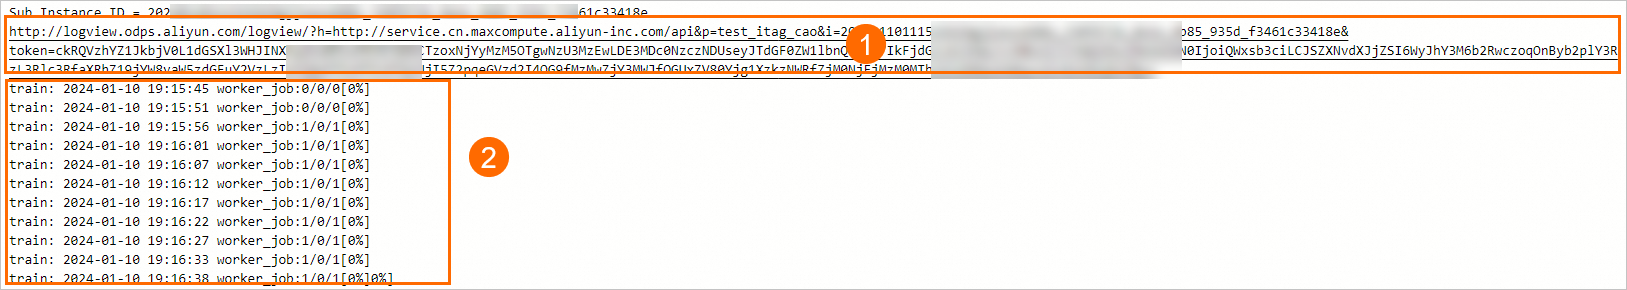
Section | Description |
① | The LogView logs. You can click the link to view the LogView logs in your browser. |
② | The running status logs. |
Running status logs
Running status logs include the running status of the servers on which the distributed training jobs are running. A log is displayed in the Parameter 1/Parameter 2/Parameter 3 format.
The value of Parameter 1 indicates the number of nodes that run the computing tasks.
The value of Parameter 2 indicates the number of nodes that completed the computing tasks.
The value of Parameter 3 indicates the total number of nodes.
If the progress of a pipeline is 100%, the pipeline is complete.
LogView logs
LogView logs provides the debug information of pipelines. You can use the following methods to view LogView logs:
Open the link in the preceding figure in a browser. The following page appears.

To view error logs or check the output information of the code that is used to run the pipeline, double-click the instance.
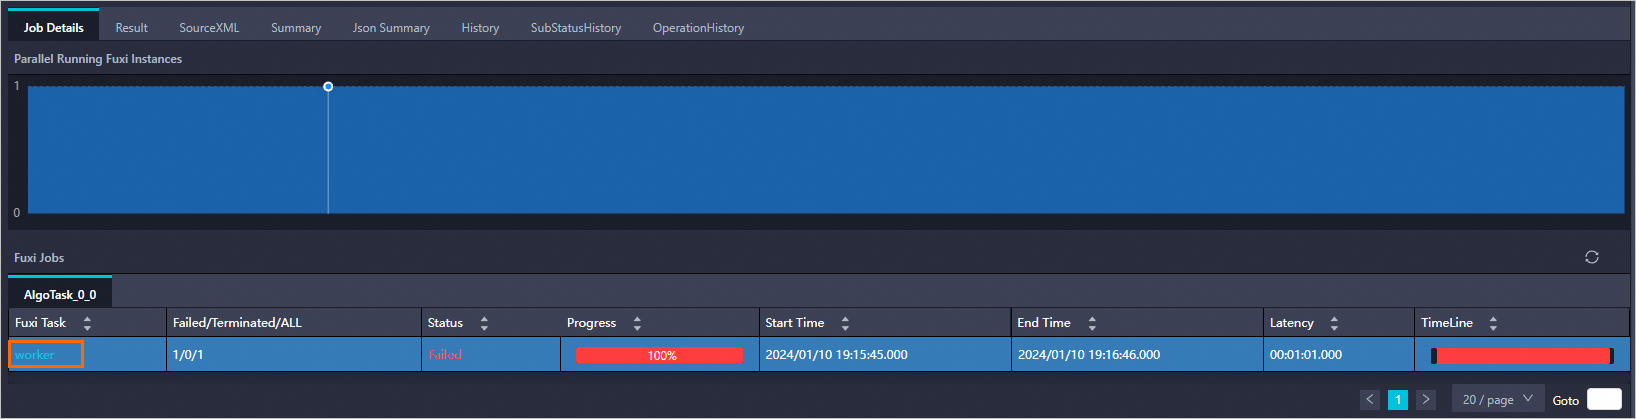
On the Worker tab, view the task instances or worker instances based on your business requirements.

To view the output information that is generated by the print function when you run the code, click the
 icon in the Stdout column.
 To view the debug information of the service, click the
 icon in the StdErr column.