Machine Learning Platform for AI (PAI) provides comprehensive features such as feature encoding, model training, and model evaluation. You can create a model by extracting and labeling the features of system anomalies. Then, you can use the model to monitor system metrics and predict system anomalies.
Background information
A user system may encounter anomalies. For example, the CPU utilization of the O&M system suddenly increases or a system is flooded with illegal information. If you can monitor the metrics of the user system in real time, and take preventive measures and implement real-time alerting for abnormal metrics, the user system may be far less exposed to risks.
Solutions
PAI provides a set of classification algorithms that are based on metric monitoring. You can use these algorithms to create binary classification models to monitor metrics and further detect system anomalies. Then, you can deploy the models to online systems to implement nearline risk management. The following conditions must be met before you can use these classification algorithms of PAI to create models:
You master knowledge of the classic algorithms in machine learning, especially feature engineering and binary classification algorithms.
You can be fully engaged in the development for one to two days.
You have more than 1,000 data records that are labeled with anomaly or normal.
Datasets
The pipeline described in this topic is based on system-level monitoring logs, including 22,544 data records. Among these data records, 9,711 record system anomalies. The following figure shows the sample data that is used in the pipeline. 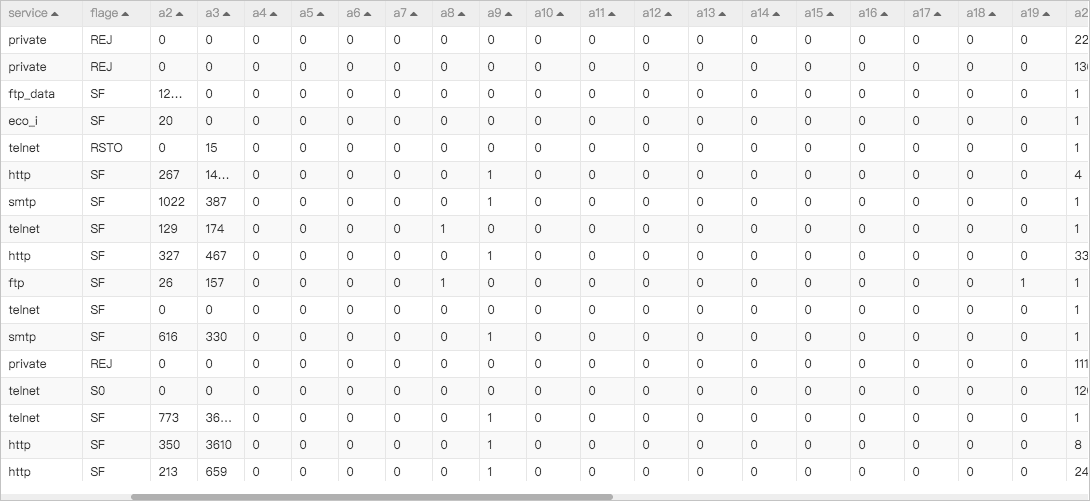
Parameter | Description |
protocol_type | The protocol that is used for network connection. Example: tcp, icmp, or udp. |
service | The service protocol. Example: http, finger, pop, private, or smtp. |
flage | The connection status. Example: SF, RSTO, or REJ. |
a2~a38 | The system metrics. |
class | The label field. Valid values: normal and anomaly. If the value of class for a data record is normal, the data record records a normal system event. If the value of class for a data record is anomaly, the data record records a system anomaly. |
Procedure
Go to the Machine Learning Designer page.
Log on to the PAI console.
In the left-side navigation pane, click Workspaces. On the Workspaces page, click the name of the workspace that you want to manage.
In the left-side navigation pane, choose .
Create a pipeline.
On the Preset Templates tab of the Visualized Modeling (Designer) page, find the Abnormal Behavior Risk Control template and click Create.
In the Create Pipeline dialog box, configure the following parameters. You can use their default values.
The value specified for the Data Storage parameter is the Object Storage Service (OSS) bucket path of temporary data and models generated during the runtime of the pipeline.
Click OK.
It requires about 10 seconds to create the pipeline.
On the Pipelines tab, double-click the Abnormal Behavior Risk Control pipeline to open the pipeline.
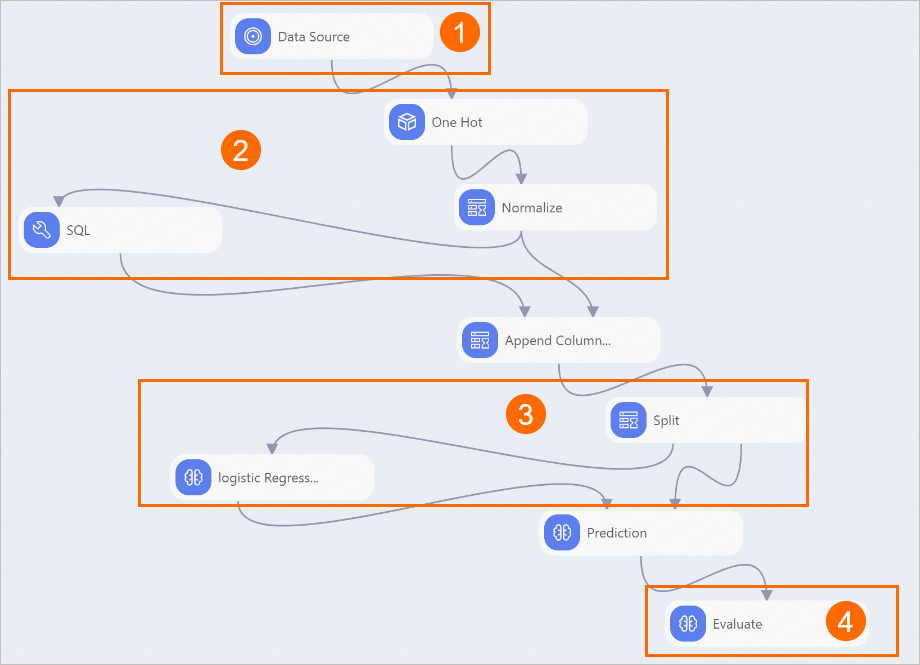
View the components of the pipeline on the canvas, as shown in the following figure. The system automatically creates the pipeline based on the built-in template.
Section
Description
①
The component displayed in this section imports the dataset used by the pipeline.
②
The components displayed in this section perform feature engineering.
The One Hot Encoding component converts STRING-typed feature data to numeric-typed data.
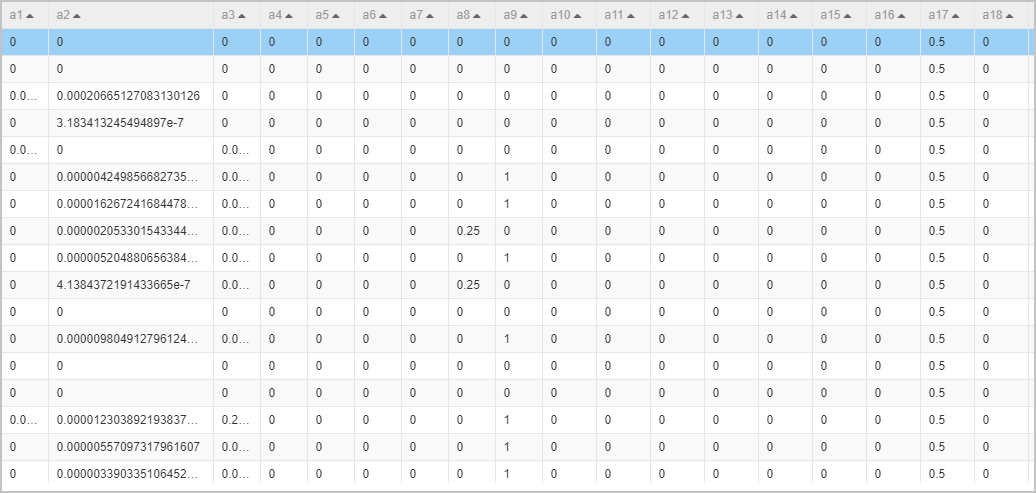
The Normalization component limits all data within the range of 0 to 1 to eliminate the impact of dimensions. The following figure shows the normalized data.
The SQL Script component executes the SQL statement to query the values of class in the source data. The SQL statement converts the value anomaly of class to 1 and the value normal of class to 0. In this example, the SQL Script-1 component executes the following SQL statement:
select (case class when 'anomaly' then 1 else 0 end) as class from ${t1};
③
The components displayed in this section use the logistic regression for binary classification algorithm to train a monitoring model based on data about normal system events and system anomalies.
④
The Evaluate component evaluates the quality of the model by using indexes such as an area under curve (AUC), a Kolmogorov-Smirnov (KS) value, and an F1 score.
Run the pipeline and view the results.
In the upper-left corner of the canvas, click
 .
. After the pipeline stops running, right-click the Evaluate component. In the shortcut menu that appears, click Visual Analysis.
In the Evaluate dialog box, click the Index data tab to view the indexes that are used to evaluate the model.
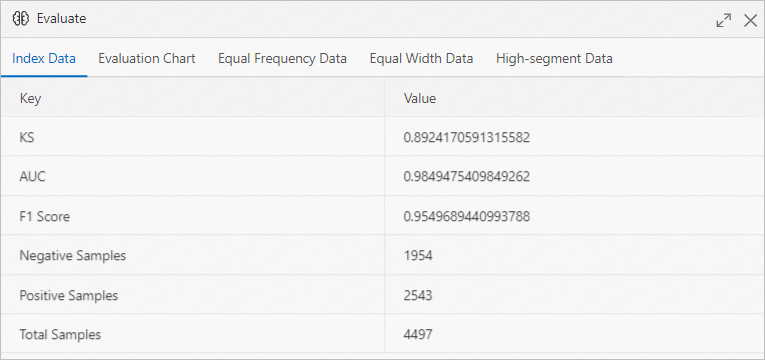 In the evaluation chart, the value of AUC is greater than 0.9, which indicates that the prediction accuracy of the model is higher than 90%.