View and process events
When many assets are connected, Agentic NDR alerts can be numerous, noisy, and lack semantic correlation. The Event Center automatically aggregates alerts by attacker into structured attack events and provides a unified Traceability View to simplify analysis of attack paths and impact scope, reducing alert management overhead.
-
Go to the Event Center
Log on to the Agentic NDR console. In the left-side navigation pane, click . -
View the event overview
The top of the Events page displays the Total Events and Risk Level Distribution for the selected time range. To adjust the time range, click the calendar icon in the upper-right corner.NoteRisk level descriptions:
-
Critical: Indicates a confirmed asset compromise or successful attack. This event includes a compromised asset or an exploited vulnerability.
-
High: A high-intensity attack attempt was detected. This event has a wide impact and affects a large number of assets.
-
Medium: Clear attack reconnaissance or probing was detected. The attack intent is clear, but the scope of affected assets is contained.
-
Low: An attack attempt was blocked by defense mechanisms or failed due to an environment mismatch. It involves a small number of assets.
-
-
View and process a specific event
The lower section of the page lists all events within the selected time range. You can use the filter bar to filter or search by criteria such as Status, Risk Level, or Event Name.
Click an event's Event Name to open the details panel, where you can respond to the event.
Event report from the agent
The top of the event details panel shows the agent-generated event report summary. Click Full Report to view details, including attack-related information and response recommendations.
Analysis views
In the event details panel, Agentic NDR provides the following three analysis views:
-
Traceability View: Displays a topology graph of the attack path between the attacker and the victim.
-
Entity View: Summarizes all IP Address and Domain Name entities associated with the event, including External Threat and Internal Asset.
-
Alert View: Summarizes all alerts associated with the event.
Traceability View
The Traceability View visualizes the attack path and supports the following interactions:
-
Click Timeline to sort alerts by time, from newest to oldest (top to bottom).
-
Click any alert to highlight its corresponding attack path, which helps you reconstruct the entire attack process.
The following table describes the icons. Click an icon to open the Entity Details page, which displays related Alibaba Cloud threat intelligence.
|
Icon |
Description |
|
|
The primary attacker in this event, representing the initial point of compromise. |
|
|
An internal asset or victim. The |
|
|
An external attacker, such as a scanner or brute-force source, that is not a C2 server. |
|
|
An external malicious C2 (Command and Control) server associated with a domain name that remotely controls a compromised host. |
Entity View
The Entity View lists all entities associated with the current event and supports the following actions:
-
Filter and search: In the filter bar, you can filter or search for entities by criteria such as Source, IP Address, Domain Name, or Entity Value.
-
View threat intelligence: Click the Entity Value of a target entity to view its related information in Alibaba Cloud threat intelligence.
-
Add to allowlist: In the Actions column for a target entity, click Whitelist to add the entity to the allowlist. After an entity is added to the allowlist, the system stops generating alerts for it.
Alert View
The Alert View lists all alerts associated with the current event and supports the following actions:
-
Aggregate and filter: In the aggregation bar, you can group alerts By Alert Name or Attack Type. In the filter bar, you can filter or search for alerts by criteria such as Attack result or Attacker IP.
-
View alert details: Click the Alert Name of a target alert to go to its Alert details p*.
-
View AI results: In the AI Analysis column, click the
 icon to view the AI-generated alert analysis and corresponding defense recommendations.
 -
Add to allowlist: In the Actions column for a target alert, click Whitelist to go to the Configure Alert allowlist page and add the alert to the allowlist.
Respond to and update event status
In the event details panel, you can update an event's status or take response actions based on your analysis:
-
Respond to an event: Click Recommended Actions in the upper-right corner or One-Click Response in the lower-left corner to go to the Recommended Actions page. The page supports the following two types of response actions:
-
Add entity to allowlist: In the Actions column for a target entity, click Whitelist to add the entity to the allowlist on the Configure alert allowlist page. After an entity is added to the allowlist, the system stops generating alerts for it.
-
Block entity: This feature works with Cloud Firewall using an "address book reference + ACL policy reuse" design pattern. Agentic NDR pre-configures a dedicated block address book and ACL policies in Cloud Firewall. Block and unblock operations only modify address book entries, avoiding rule stacking. When an address book reaches its maximum capacity of 2,000 entries, the system automatically adds a new set of ACL policies and address books. This expansion is transparent to users.
In the Actions column for a target entity, click Block to go to the Block Configuration page and configure the following items.
Important-
Prerequisites: The block feature relies on Cloud Firewall capabilities. After NDR performs a block operation, the system automatically creates Cloud Firewall address books and access control policies. Before configuration, make sure that Internet access control is enabled and protection is enabled for the associated public network assets. If Cloud Firewall is not enabled or protection is not enabled for the direction where the target IP resides, the block operation may not take effect.
-
Block scope: Currently, only public network-direction IP addresses and domain names can be blocked. Blocking private IP addresses is not supported.
-
Domain block protocol scope: Domain name blocking only applies to HTTP/HTTPS traffic, based on Cloud Firewall's FQDN identification capability. Non-standard ports or non-HTTP protocols communicating with malicious domain names are not supported for blocking.
-
Address book capacity limit: The number of entries in a single address book is limited by the Cloud Firewall quota. For more information, see Limits.
-
ACL policy dependency: Do not manually modify, delete, or disable the ACL policies and address books created by NDR in the Cloud Firewall console. Otherwise, the system may display related exception messages.
Parameter
Description
Blocked Entity
The entities associated with the current event. This field cannot be modified.
Traffic Direction
-
Inbound: Blocks external entities from accessing your assets. This is suitable for defending against inbound scanning or vulnerability exploitation by external attackers.
-
Outbound: Blocks your assets from accessing external entities. This is suitable for blocking outbound communication between compromised hosts and C2 IPs.
-
Bidirectional: Applies both inbound and outbound block policies simultaneously.
Block Type
Supports Permanent Block and Timed Block. If you select Timed Block, you must also configure the specific Block Duration.
Remarks
Enter a remark to identify this rule.
-
-
-
Update event status: In the Status area in the upper-right corner, click the
 icon to change the Update Status to Processing or Processed.
These actions can also be performed from the event list in the Event Center. In the event list, click Recommended Actions or Update Event Status in the Actions column for a target event to perform the same functions.
Block Management
After performing the Block entity operation, you can manage blocked entities from the event list page in the Event Center by clicking Block Management on the right side. The available features are:
-
Edit or delete blocked entities: In Blocklist, the system displays entities that are Blocked and those that are Expired (including manually unblocked or automatically unblocked after the duration expires). For Blocked entities, you can unblock or edit them. For Expired entities, you can re-block or delete them.
-
View Block Records: On the Block Records tab, the system records complete block logs and supports filtering and querying by entity name, status, action, and other conditions.
-
Configure Block Allowlist: To prevent business interruption caused by accidentally blocked entities, you can add entities that should not be blocked to the allowlist on the Block Allowlist tab.
Configure Custom Allowlist
On the Custom Allowlist tab, click Add Allowlist and configure the following items:
Parameter
Description
Entity Type
Supports IP Address and Domain Name.
Entity Name
-
IP address format:
172.16.0.0/16or192.168.1.1 -
Domain name format:
aliyun.com
Separate multiple entities with commas (,).
Remarks
Enter a remark for identification.
Configure the enablement status of Predefined Allowlist
Agentic NDR includes Predefined Allowlist (such as trusted IPs for Alibaba Cloud services). You can configure the enablement status on the Predefined Allowlist tab.
NoteYou can only view or toggle the enablement status of Predefined Allowlist. The IP addresses within it cannot be edited. For high-reputation IP and domain name virtual address books based on threat intelligence, specific address lists are not provided.
-
Threat analysis overview
Threat analysis is a core capability of Agentic NDR. It leverages Alibaba Cloud's intrusion detection, threat intelligence, behavior analysis, and security sandbox engines to provide full-traffic attack detection and threat analysis. It also offers statistical, aggregation, and correlation analysis of alert data.
Agentic NDR can also restore files transmitted over the network for risk analysis, generate alerts for suspicious files, and provide sample data for further analysis.
Alert analysis
-
Sign in to the Agentic NDR Console.
-
In the left-side navigation pane, select Detection.
-
On the Alerts tab, view the current number of compromises and the total number of alerts, and view the detection time and the connection between the attacker and victim for each alert.
You can query alert analysis data for a specific scope by using multiple filter conditions and group the data by Alert Name, Attacker IP, and Victim IP Address for aggregated statistics. The Attacker IP and Victim IP Address have a cascading relationship. A specific Attacker IP can be linked to a corresponding Victim IP Address, and vice versa. When you select an Attacker IP or a Victim IP Address, the alert data in the section below updates in real time. Click a Victim IP Address address to view its asset details in a dialog box.
Alert details
The alert details page provides a detailed analysis organized into five modules: basic alert information, detailed alert logs, related packets, correlated alert information, and ATT&CK technique information. This helps you quickly assess and respond to alerts.
AI alert analysis
When you open the details page, the Security AI Assistant automatically generates and displays the following explanations for the alert:
|
Component |
Description |
|
Alert summary |
Summarizes the alert information, including basic details like the attacker, victim, alert name, and detection engine, and outlines the attack intent. |
|
Payload analysis |
Explains the detected payload, including its content, the attack technique used, and potential threats. |
|
Attack result analysis |
Explains the attack result from the detection engine. If the engine marks the result as an attempt, the large language model (LLM) determines the final result by analyzing request and response packets. |
|
Threat intelligence |
Queries threat intelligence for the attacker IP address and any domain names or IP addresses found in the payload, and explains the findings. |
|
Correlated alert analysis |
Summarizes related alerts for the attacker and victim within a 48-hour window to analyze the attack intent and determine the attack stage. |
|
Attacker IP threat analysis |
Summarizes the alert activity for the attacker IP over the last 24 hours. It analyzes the threat posture of the attacker IP based on the distribution of attack counts, times, results, and affected assets. |
|
Defense recommendations |
Provides defense recommendations for log investigation, application analysis, and access control based on the alert content and analysis. |
Basic information
In the Basic Information area, you can view CVEs that may be related to the alert. Click View CVE Information to access the Alibaba Cloud vulnerability database for disclosure details, impact scope, and recommended fixes. This area also provides details such as Attack Time, Alert Count, Alert Time, and Alert Name.
Related alerts
-
In the Related Alerts area, view the alert information. In the Raw Data column, click payload to analyze the alert payload's key information. The portion that triggered the alert rule is highlighted. Click the Decoding Tools at the bottom right of the payload to decode the payload section of the raw traffic. The Agentic NDR decoding tool supports various decoding methods, such as ASCII, UTF-8, and hexadecimal.
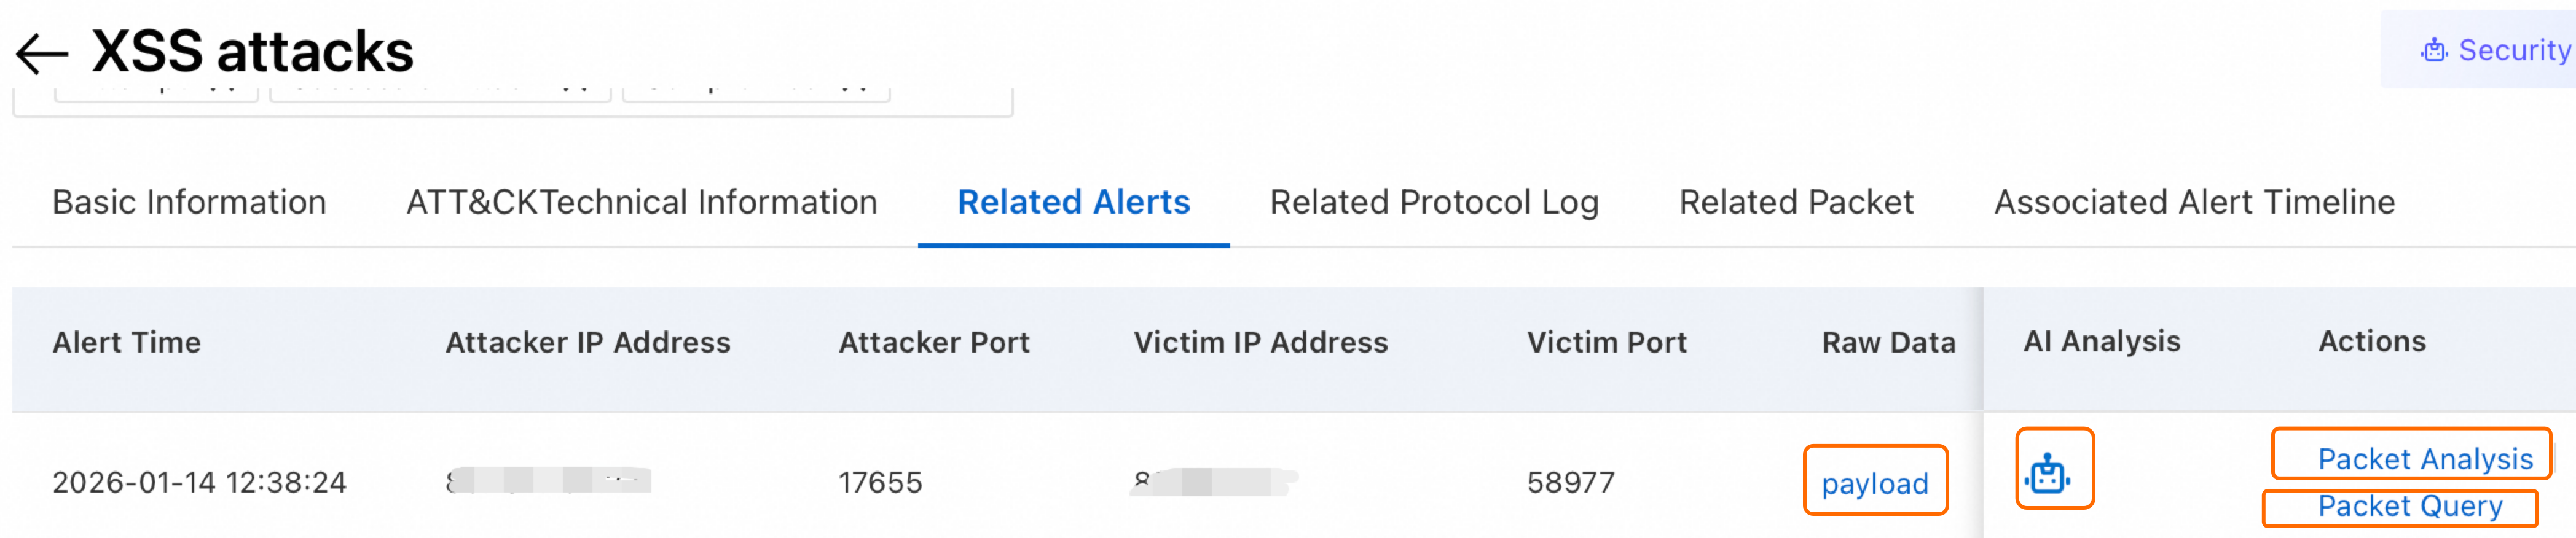
-
In the AI Analysis column, click the
 icon. The Security AI Assistant automatically generates and displays an explanation for the alert, improving readability and response efficiency.
 -
In the Actions column, click Packet Analysis to open the Online PCAP Parsing page and view the packet analysis. For more information, see Packet analysis management.
-
In the Actions column, click Packet Query to go to the Attack Forensics page. On this page, you can retrieve the raw packets related to the alert by using the traffic 5-tuple and download the PCAP file of the related packets for further analysis.
Related protocol logs
In the Related Protocol Log area, view the log overview. Click Log Details to open the protocol log analysis page for further investigation.
Related packets
In the Related Packet area, you can perform the following actions:
-
Packet Analysis: View the packet analysis on the Online PCAP Parsing page. For more information, see Packet analysis management.
-
Packet Query Details: Navigate to the Risks page based on the source and destination IP address 2-tuple to retrieve the raw packets related to the alert.
-
Generate PCAP: Download the PCAP file of the raw packets.
Correlated alerts timeline
In the Associated Alert Timeline area, a timeline shows alerts triggered by the same attacker and victim IP addresses around the time of the current alert. Use it to identify temporal relationships and attacker behavior patterns. Click an alert name on a related alert card to open its details in a new page.
ATT&CK technique
In the ATT&CK technique information area, you can view a detailed analysis of the underlying attack technique.
ATT&CK Matrix
On the ATT&CK Matrix tab, Agentic NDR allows you to analyze alerts based on ATT&CK labels.
This tab displays statistics for alerts related to different attack techniques. Techniques with active alerts are highlighted and moved to the top. Click the number on an alert item to view details in the ATT&CK technique information pop-up. To view specific alert information, click Click to view specific alert to go to the Alerts tab.
Configure alert allowlist
The alert allowlist lets you mark specific alert types as safe or acknowledged to avoid repeatedly processing them.
The IP addresses of Security Center scanners are blocked by default and do not generate alerts.
-
Sign in to the Agentic NDR Console.
-
In the left-side navigation pane, select Detection.
-
On the Alert Whitelist tab, click Create Rule.
-
In the Alert Rule Filter panel, configure the relevant fields.
-
Click Confirm.
During the trial period, alert logs are retained for a maximum of 90 days. The system overwrites logs that exceed this retention period, starting with the oldest ones.