By Dassi Orleando, Alibaba Cloud Community Blog author.
This article will look into Alibaba's open-source tool Archas, its major features, and how you can start to use it. Before we begin, let's first discuss what exactly Archas is and why you would want to use it.
Arthas is an open-source diagnostic tool created by Alibaba to help developers to troubleshoot production issues in Java applications easily. That is, Arthas makes things convenient because with it developers can troubleshoot a variety of technical issues without the need of updating the source code or restarting the server.
Let's look at some of the major, key features of the current version of Arthas, which as of writing this article is version 3.1.1. Arthas can do the following:
All of Arthas's releases are described on this page.
Arthas can be run on most of the major operating systems, including Linux, MacOS, and Windows. You'll just need to make sure that Java Virtual Machine 6 or later is installed on your system before you begin to set up Arthas. Generally speaking, Arthas consists of a single runnable Jar file, which is named arthas-boot, which is Arthas's runner.
To download arthas-boost, you can use this following command:
wget https://alibaba.github.io/arthas/arthas-boot.jarAfter that, you can use the following command to manage Arthas:
java -jar arthas-boot.jar
java -jar arthas-boot.jar –h
From the Arthas help command (-h), we can see there are plenty of options possible to address or enable some specific features of the diagnostic tool. Here are some interesting ones that may be often used:
--target-ip: In case the targeted Java Virtual Machine is located at a specific IP address over the network, then the default is 127.0.0.1 (which is the localhost).--telnet-port: The targeted Java Virtual Machine listen telnet port. The default port is 3658.--http-port: The targeted Java Virtual Machine listen HTTP port. The default port is 8563.--use-version: This uses a special Arthas version--use-http: This enforces use of HTTP for downloading items. By default, HTTPS is used.--verbose: This is used to make the code more verbose so to print more debug information.After Arthas is up and running, you can click Enter to jump into Arthas. Next, you can use the command line interface associated with Arthas to enter some additional commands into your Arthas server. Here, in the examples I give in this article, it's the local machine so as a result I'm not going to specify --target-ip.
Below is an example of how the terminal looks:
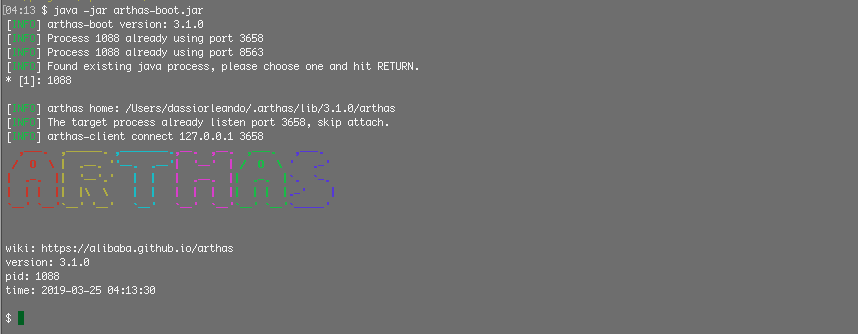
You can receive additional help from the inner-prompt by entering help and then clicking the Enter key. Here's the result for the current machine:
$ help
 NAME         DESCRIPTION
 help         Display Arthas Help
 keymap       Display all the available keymap for the specified connection.
 sc           Search all the classes loaded by JVM
 sm           Search the method of classes loaded by JVM
 classloader  Show classloader info
 jad          Decompile class
 getstatic    Show the static field of a class
 monitor      Monitor method execution statistics, e.g. total/success/failure count, average rt, fail rate, etc.
 stack        Display the stack trace for the specified class and method
 thread       Display thread info, thread stack
 trace        Trace the execution time of specified method invocation.
 watch        Display the input/output parameter, return object, and thrown exception of specified method invocation
 tt           Time Tunnel
 jvm          Display the target JVM information
 ognl         Execute ognl expression.
 mc           Memory compiler, compiles java files into bytecode and class files in memory.
 redefine     Redefine classes. @see Instrumentation#redefineClasses(ClassDefinition...)
 dashboard    Overview of target jvm's thread, memory, gc, vm, tomcat info.
 dump         Dump class byte array from JVM
 options      View and change various Arthas options
 cls          Clear the screen
 reset        Reset all the enhanced classes
 version      Display Arthas version
 shutdown     Shutdown Arthas server and exit the console
 session      Display current session information
 sysprop      Display, and change the system properties.
 sysenv       Display the system env.
 history      Display command history
 cat          Concatenate and print files
 pwd          Return working directory name
From the result above, we can easily find some additional commands, which can helpful when it comes to the production diagnostics side of Arthas. Now, let's look at some of them with the following lines.
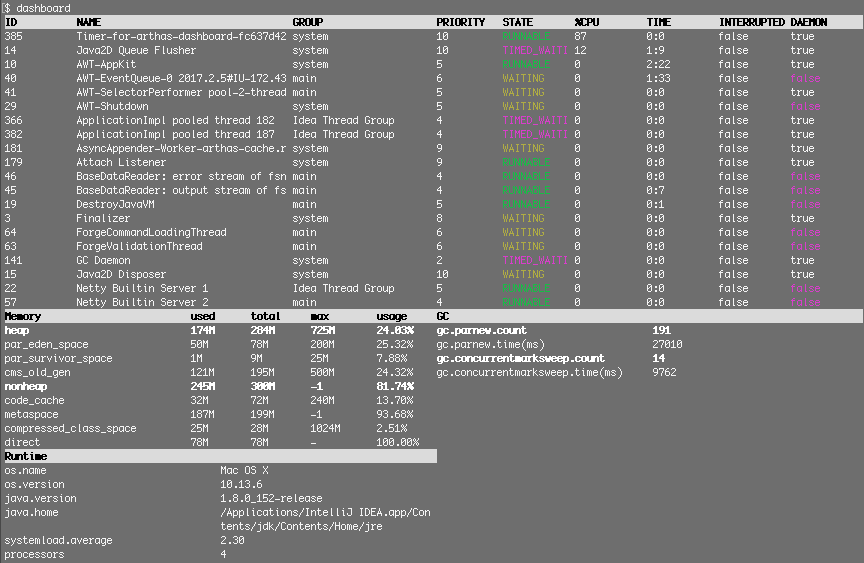
First, there's the dashboard command, which provides a real time overview of your current java virtual machine threads, cpu usage, memory usage, computer architecture, and operating system, along with some additional information, as shown in the following image:
Next, the classloader command is used to show class loading information, which happens to print loads of information, such as the class loaded count and instances number. There are more options as the one to completely list all the classes instances (-l) or view the class loader hierarchy (-t).
Also, there's the jad command, which is a great tool for decompiling a class. How it works is that it can help you find the exact class code that is running on production so that you can ensure that the code running is the code you actually want to be running online. It is a relatively simple command, following the class name shown here: jad java.lang.String. The result of this command is that you will have a String class decompiled in the console.
A more advanced way for decompiling only the class source code and saving it out into a file at the location that you have specified would be as follows: jad --source-only java.lang.String > /tmp/String.java. For this, --source-only is used here to remove some particular class loader and location descriptions from the top of the decompiled class.
The command getstatic is used to show the static field value of a class. The syntax for it is as follows: getstatic package.to.Class staticFieldName. And here's another example: getstatic java.lang.String serialVersionUID, which results in showing the string's serial version UID value as shown below:

The jvm command is used to show the full results of the Java virtual machine. Next, sc can be used to find all the classes that the JVM has loaded, and it can also be read as a search class. This is useful for detecting class loading issues.
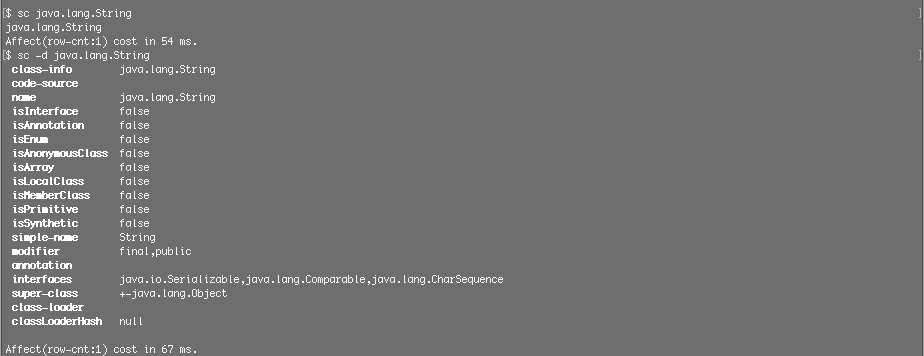
Following this, the –d option prints out specific information related to the finding class of which there may be modifiers, annotations, interfaces, or super-classes with booleans. These can be used to determine which kind of class it is. For example, it can determine whether it is an interface, annotation, or enumeration. Here's in image the result of java.lang.String check with and without the –d option:
sc does supports wildcard characters, too, which can be helpful for listing more results such as for printing all the classes that contain a certain match. You can do so with syntax like this: sc String*. See the output example below.

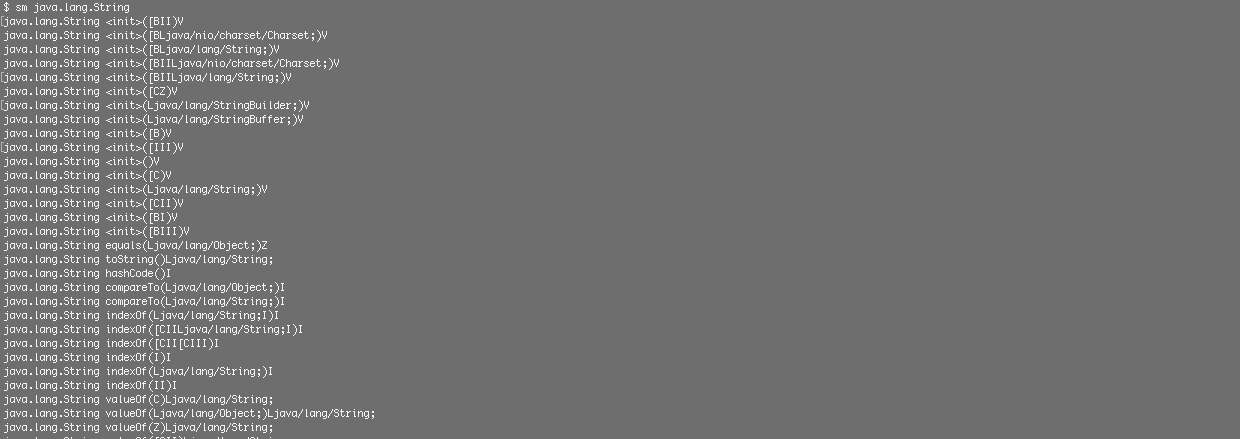
sm stands for search method, and it is used to search and view a loaded class methods into the console. The –d option is especially useful for this command when it comes to finding single method information such as modifiers, annotations, parameters, return types or exceptions.
You can also use the following commands:
- sm java.lang.String
- sm -d java.lang.String toString
For which, you'll see the following results:

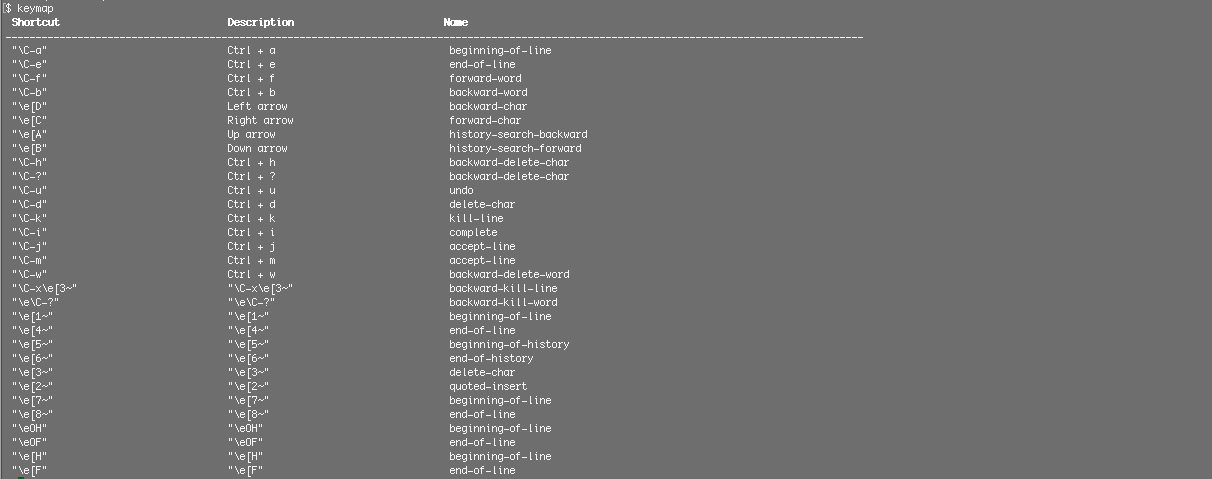
Next, you can also use sysenv, which allows you to view the current JVM environment variables into the console. You can also run the keymap command to print the current keymap, as shown in the screenshot below:
Another command you may use often is thread, which can be used to show all Java thread information in a single table as below:
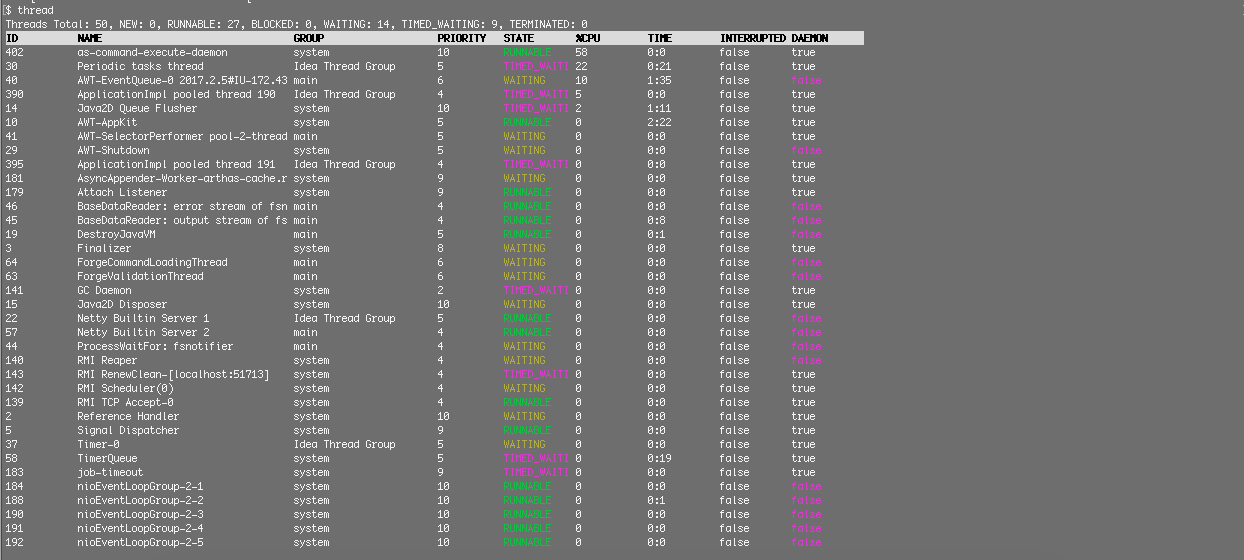
To view a specific thread's stack, you can just follow a command with the corresponding thread ID, such as thread 40, for instance. As another example, you can list the top 3 busiest threads with detailed stack trace by using thread -n 3, or you could alternatively find and list all blocking threads with thread –b. You can check out this document for more information on how all of this works and look into some cool options to print details for each single thread by their number while you're there.
Next, there's watch, which monitors classes methods in term of return values, exceptions and parameters. Consider this example of using the watch command. Let's say you run the following:
watch package.to.*Controller * '{params, returnObj, throwExp}'In the above, the first parameter is the class name, which has support for the wildcard, and the second is the method. This also happens to support the use of the wildcard. This command as a whole prints the parameters in real time, returns object and exceptions if or when any controller methods are called. This command is quite useful for debugging.
Note:
*Controller matches with such things as the UserController, BillingController, AuthController, IndexController, so on.-e option, which means that only requests that throw an exception are detected.Some other good examples for when to use the Arthas-demo project are accessible from the documentation.
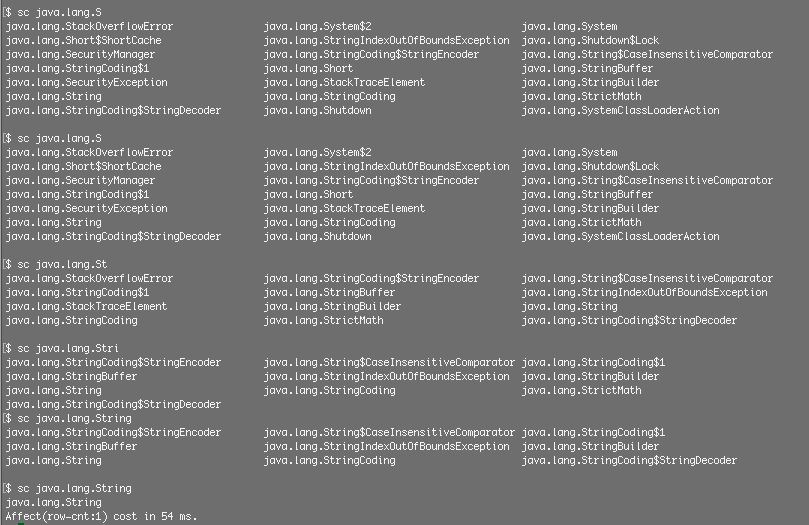
In the console interface, Arthas has support for a range of auto-completion features and also for navigating among several different classes of packages depending of what words you entered first by just clicking the Tab key to get more proposes.
The image below shows the autocomplete suggestions you may receive when typing .string.
The trace command traces the execution time of specified method invocation. It can be helpful to determine the performance flaws we may have in our Java Application, with only the first level method call being traced and no deep-traces involved.
Consider the following: trace package.to.Class method '#cost > 50'. This method will trace and print execution of the class method function when the time cost is higher than 50 ms.
Next, the stack command prints the full call stack of the current method. We often know one method gets called, but without any clue on which code path gets executed or when the method gets called since there are so many code paths to the target method. This is the purpose of the stack command. It has a pretty similar syntax like trace, supporting filtering too, with by cost in ms as example.
Normally, if you press the direction arrows (left, right, up, or down) on a Command Line Interface, it'll scroll through the list of previously executed commands.
The command shutdown is used for completely shutting down your Arthas server and then exiting the console.
One of the most popular ways for interacting with Arthas is through the terminal command as what we've been doing through this article. However, another way to interact with Arthas, of course, is by using its Web Console in your browser window.
Arthas's Web Console communicates with Arthas's server through using web sockets and can be accessed at http://server_ip_address:8563/. Remember, of course, to replace rhw server_ip_address in the preceding with your actual server IP where Arthas's server is deployed. If you deployed it locally, then the address should be 127.0.0.1.
Here's what the web interface looks like:
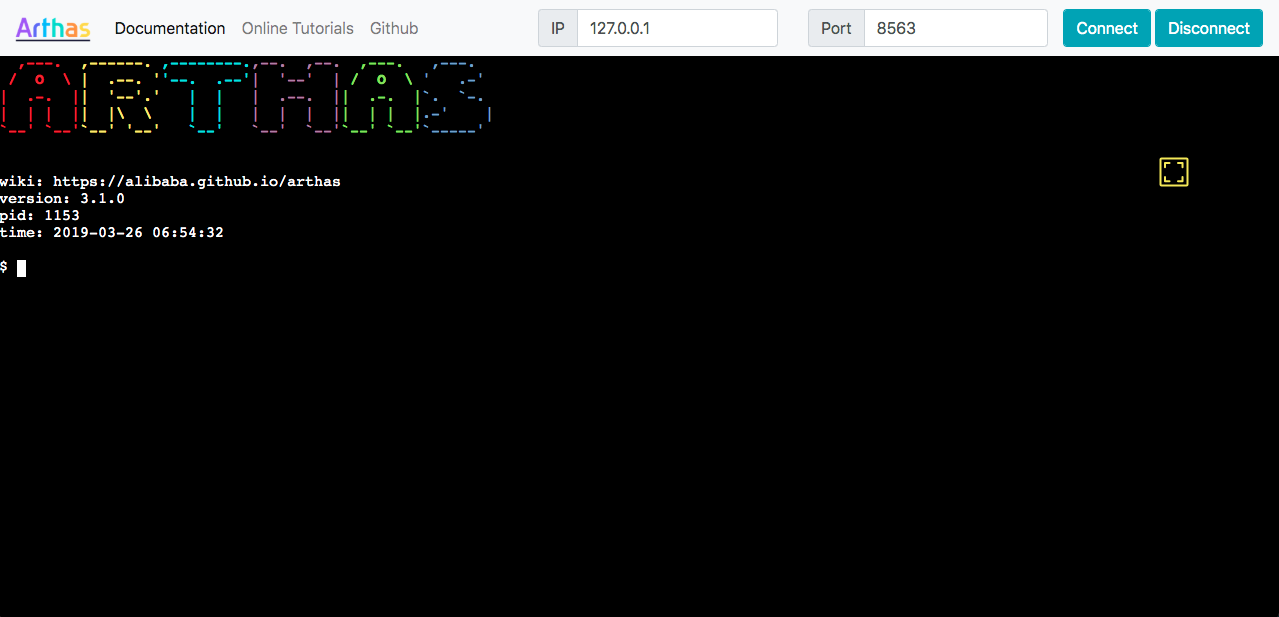
From the top menu of the web console, you can see how you can connect to other Arthas servers by just filling the the server IP address and port. Later, more investigations can be done to make it more secure.
In this article, you have got to leanr more about Arthas as well as how you can install and start up Arthas. You also learned how you can running some commands to diagnose our JVM threads through Arthas's command line interface.

2,593 posts | 794 followers
FollowAlibaba Cloud Native - February 2, 2024
Alibaba Cloud Native Community - May 22, 2023
Alibaba Clouder - August 18, 2020
Alibaba Cloud Native Community - May 22, 2023
Adrian Peng - February 1, 2021
Alibaba Developer - August 18, 2020

2,593 posts | 794 followers
Follow Managed Service for Prometheus
Multi-source metrics are aggregated to monitor the status of your business and services in real time.
Learn More Application Real-Time Monitoring Service
Build business monitoring capabilities with real time response based on frontend monitoring, application monitoring, and custom business monitoring capabilities
Learn More CloudMonitor
Automate performance monitoring of all your web resources and applications in real-time
Learn More Managed Service for Grafana
Managed Service for Grafana displays a large amount of data in real time to provide an overview of business and O&M monitoring.
Learn MoreMore Posts by Alibaba Clouder