By Chang Haiyun (Yida)

This article describes how to troubleshoot and fix common performance issues and faults that occur when using Java. It also gives several helpful practical methods.
CPU utilization is an important metric for measuring how busy the system is. Generally, high CPU utilization is not a problem because it indicates that the system is continuously processing tasks. However, if the CPU utilization is so high that tasks are piling up and causing a high system load, it becomes dangerous to the system and requires troubleshooting. There is no standard metric value for safe CPU utilization because CPU utilization varies depending on whether your system is compute-intensive or I/O-intensive. Generally, a compute-intensive system has a higher CPU utilization and lower load. This is the opposite for an I/O-intensive system.
1) Frequent Full Garbage Collection (GC) or Young GC
jstat -gcutil pid to view memory usage and GC condition.2) Abnormal code-related CPU consumption, such as the consumption caused by endless loops, MD5 operations, and other memory operations
3) Troubleshoot with Arthas
4) Troubleshoot with the jstack command
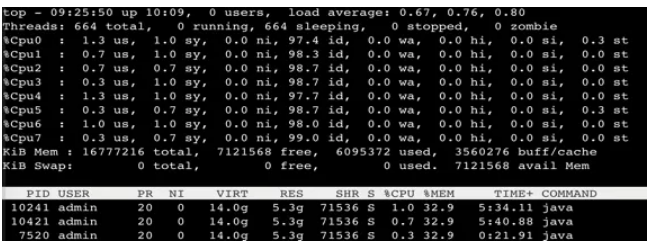
ps –ef | grep java to retrieve the Java process ID.top -Hp pid to identify the thread with the highest CPU utilization.printf '0x%x' tid to convert the thread ID to the hexadecimal format.jstack pid | grep tid to identify the thread stack.
Note: You can enter "1" to view the status of each CPU when running this command. We have seen a case in which a CPU was bound to middleware, causing a spike in CPU utilization.
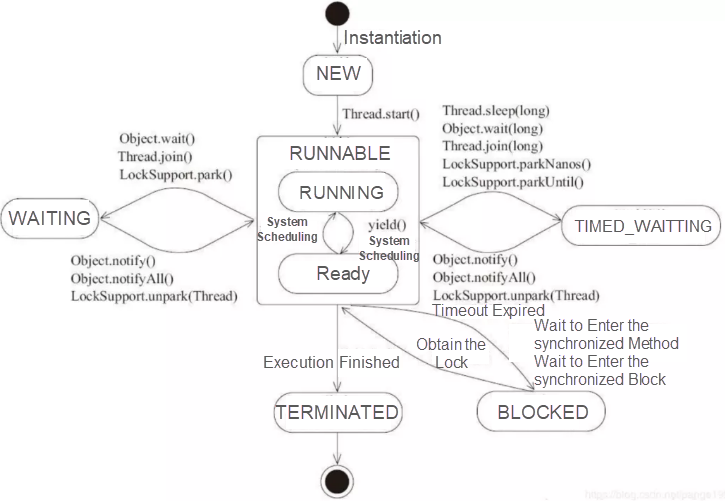
The CPU load refers to the number of active processes per unit time, including processes in running states (runnable and running) and uninterruptible states (I/O lock and kernel lock.) As you can see, the keywords in this case are "running states" and "uninterruptible states." The running states can be referred to as the six states of a Java thread, as shown in the following figure. The thread is in a new state after being initialized, then enters the runnable state, and waits for CPU scheduling after being started. In this case, busy CPUs will produce an increasing number of processes in the runnable state. The uninterruptible states include network I/O lock, disk I/O lock, and kernel lock when the thread is in the synchronized state.

1) High CPU utilization with a large number of processes in the runnable state
2) High iowait value for pending I/O
vmstat to check for blocked processes.jstack -l pid | grep BLOCKED to check the blocked thread stack.3) To troubleshoot, wait for the unlock of kernel lock, for example, when the thread is in the synchronized state.
jstack -l pid | grep BLOCKED to check the blocked thread stack.Before we learn about the causes for a Full GC, let's review Java Virtual Machine (JVM) memory.
New objects are placed in the Eden space. When the Eden space becomes full, it triggers a Minor GC and moves living objects to S0.
Later, when the Eden space becomes full again, it triggers another Minor GC and moves both living objects and the objects in S0 to S1. In this case, S0 or S1 must be empty.
This cycle repeats until S0 or S1 is about to be full. Objects inside the full space will be moved to the old generation. When the old generation also becomes full, a Full GC is triggered.
For versions earlier than JDK 1.7, Java class information, the constant pool, and static variables are stored in the permeant generation, and the metadata and static variables of a class are imported into the permeant generation when the class is loaded, and are cleared when the class is uninstalled. In JDK 1.8, the metaspace replaces the permeant generation and native memory is used. In addition, the constant pool and static variables are moved to the heap space, which to some extent solves the Full GC problem that occurs when a large number of classes are generated or loaded during runtime, for example, during reflection, proxy, and groovy operations.
The young generation often uses ParNew, replication algorithms, and multi-thread parallelism.
The old generation often uses the Concurrent Mark Sweep (CMS) algorithm (which incurs memory fragmentation) and concurrent collection (which involves objects generated by user threads.)
CMSInitiatingOccupancyFraction indicates the old generation occupancy at which a Full GC is triggered.UseCMSCompactAtFullCollection indicates that the old generation memory is defragmented after a Full GC to avoid memory fragmentation.1) Promotion Failed
Objects promoted from the S space are too big for the old generation, triggering a Full GC. If the Full GC fails, an out-of-memory (OOM) error is thrown.
The survivor space is too small and the objects enter the old generation too early.
jstat -gcutil pid 1000 to check the running condition of memory.jinfo pid to check the SurvivorRatio parameter.The capacity of memory is insufficient for allocating large objects.
The old generation contains a large number of objects.
jmap -histo pid | sort -n -r -k 2 | head -10 to retrieve the top 10 classes with the greatest number of instances.jmap -histo pid | sort -n -r -k 3 | head -10 to retrieve the top 10 classes with the largest instance capacity.2) Concurrent Mode Failed
During the CMS GC process, the business thread runs out of memory when moving objects into the old generation, which is common to the concurrent collection.
1) The extent of triggering a Full GC is too large, causing a high occupancy in the old generation. Meanwhile, user threads keep generating objects during concurrent collection, reaching the threshold of triggering a Full GC.
jinfo command to check that the value of the CMSInitiatingOccupancyFraction parameter ranges from 70 to 80.2) Memory fragmentation occurs in the old generation.
jinfo command to check the UseCMSCompactAtFullCollection parameter and sort out the memory after a Full GC.Use a Java thread pool that uses a bounded queue as an example. When a new task is submitted, if the number of running threads is less than corePoolSize, another thread is created to process the request. If the number of running threads is equal to corePoolSize, new tasks are queued until the queue becomes full. When the queue is full, new threads are created to process existing tasks, but the number of the threads does not exceed maximumPoolSize. When the task queue is full and the maximum number of threads is reached, ThreadPoolExecutor denies service for upcoming tasks.
1) The downstream response time (RT) is high and the timeout period is inappropriate.
2) Slow SQL queries or database deadlock occurs.
jstack or zprofiler command to identify blocked threads.3) Java code deadlock occurs.
jstack –l pid | grep -i –E 'BLOCKED | deadlock to check for deadlock.zprofiler to analyze blocked threads and locks.1) JAR Package Conflict
When Java loads all JAR packages under the same directory, the loading order fully depends on the operating system.
mvn dependency:tree and analyze the version of the JAR package with the error. If conflicted JAR package versions are found, always leave the one with the later version while removing the other.arthas:sc -d ClassName and XX:+TraceClassLoading to check for class conflict.2) Same Classes
ClassNotFoundExceptionNoClassDefFoundErrorClassCastException1) tail
2) grep
3) pgm
4) awk
5) sed
Alibaba open-source Java diagnostics tool, Arthas, uses the instrumentation method based on JavaAgent to modify bytecode for Java application diagnosis.
watch xxxClass xxxMethod " {params, throwExp} " -e -x 2watch xxxClass xxxMethod "{params,returnObj}" "params[0].sellerId.equals('189')" -x 2watch xxxClass xxxMethod sendMsg '@com.taobao.eagleeye.EagleEye@getTraceId()'1) The thread pool is full.
2) The CPU utilization and load are high.
3) The downstream RT is high.
4) Database Issues
The troubleshooting of online problems requires accumulated experience. To find the cause and eliminate the problem, you must understand the principles behind the problems. In addition, useful tools can help lower the threshold for troubleshooting and quick recovery.
The views expressed herein are for reference only and don't necessarily represent the official views of Alibaba Cloud.
Understanding the Difference Between Backups and Snapshots on Alibaba Cloud

2,593 posts | 793 followers
FollowYe Tang - March 9, 2020
Adrian Peng - February 1, 2021
Alibaba Cloud Native - February 2, 2024
Alibaba Clouder - November 25, 2019
Alibaba Cloud Native Community - July 22, 2022
Alibaba Cloud Native Community - May 9, 2023

2,593 posts | 793 followers
Follow VPC
VPC
A virtual private cloud service that provides an isolated cloud network to operate resources in a secure environment.
Learn More Apsara Stack
Apsara Stack is a full-stack cloud solution created by Alibaba Cloud for medium- and large-size enterprise-class customers.
Learn More AgentBay
Multimodal cloud-based operating environment and expert agent platform, supporting automation and remote control across browsers, desktops, mobile devices, and code.
Learn More Alibaba Cloud PrivateZone
Alibaba Cloud DNS PrivateZone is a Virtual Private Cloud-based (VPC) domain name system (DNS) service for Alibaba Cloud users.
Learn MoreMore Posts by Alibaba Clouder