In our previous articles, we looked at the challenges of a traditional IoV architecture and discussed how a cloud-based deployment can resolve these issues. In this article, we will discuss testing and performance optimization for key IoV services in the cloud.
A performance sharing Server Load Balancer instance cannot guarantee instance performance indicators, but a performance guaranteed one can provide guaranteed performance. The performance guaranteed Server Load Balancer instance is recommended out of consideration for the high concurrency features of the IoV industry. The performance guaranteed Server Load Balancer instance three key performance indicators:
Max Connection defines the maximum number of connections that a Server Load Balancer instance can bear. When the number of connections on the instance exceeds the maximum number, new connection requests are discarded.
CPS defines the speed of connection creation. When the connection creation speed exceeds the specified CPS, new connection requests are discarded.
QPS defines the number of HTTP/HTTPS queries (requests) that can be completed in a second. It is a special performance indicator for an L7 listener. When the request speed exceeds the specified QPS, new connection requests are discarded.
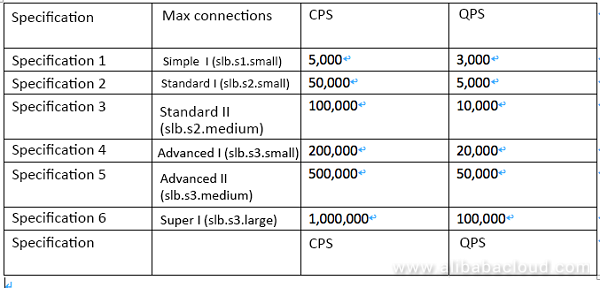
As performance guaranteed instances are provided with specific SLAs on the maximum number of connections, number of connections per second, and number of queries per second, tests on these instances are omitted. You can check the performance indicators on CloudMonitor in real time when using these instances.
You can select the ECS instance type based on the use case. For details, see the recommendations on the official website at https://www.alibabacloud.com/help/doc-detail/25378.htm
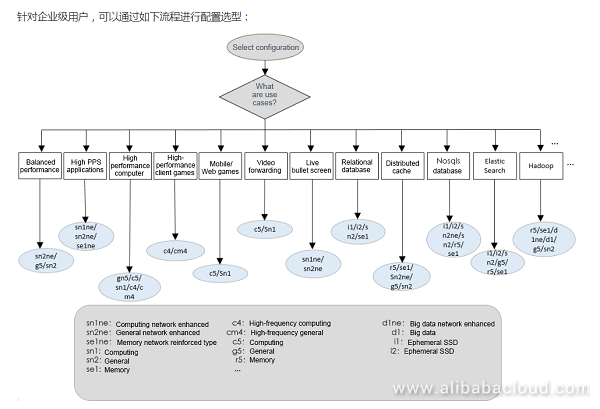
Alibaba Cloud Elastic Compute Service (ECS) provides different instance types for different use cases to satisfy diversified user demands.
Considering the high concurrency, high throughput feature of the IoT industry, the computing type (C5) with quad core, 8 GB memory, and cloud SSD system disk is recommended for web frontend application, and the general type (G5) with quad core, 16 GB memory, and cloud SSD system disk is recommended for backend application.
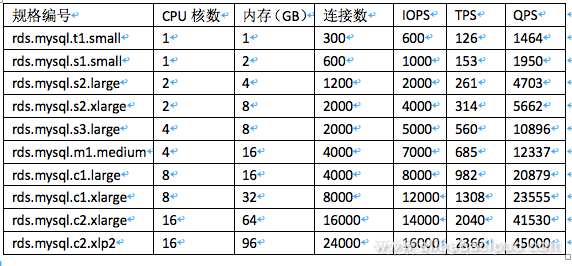
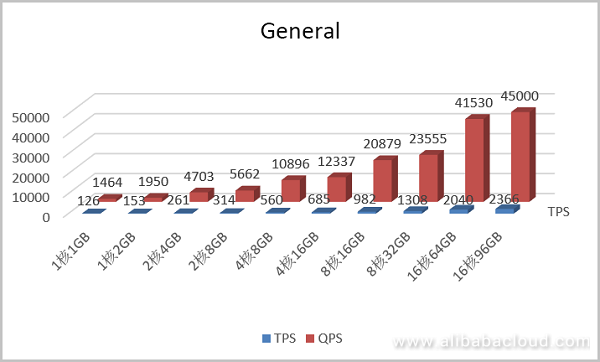
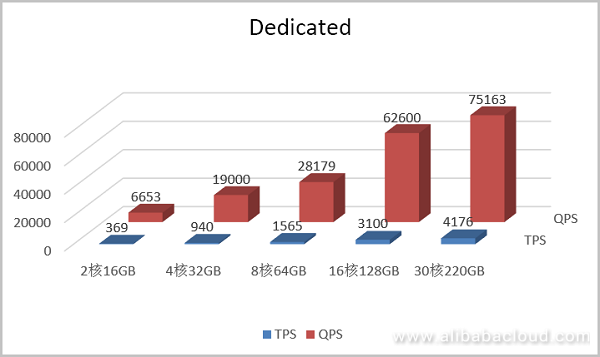
The following is a performance test on Alibaba Cloud ApsaraDB for RDS MySQL 5.6.
SysBench is a cross-platform and multithread modular benchmarking tool used to evaluate the performance of core parameters when high-load databases are running in the system. SysBench helps you quickly know the database system performance without complex database benchmark settings and even with no database installed.
Transactions per second (TPS) indicates the number of transactions processed by the database per second. The counted transactions are committed transactions.
Queries Per Second (QPS) indicate the number of SQL statements such as INSERT, SELECT, UPDATE, and DELETE that the database runs per second.
General
Dedicated

Some parameters of ApsaraDB for MySQL instances can be modified on the console. When some important parameters are set inappropriately, the instance performance may be affected or an error may occur. This document provides some suggestions for important parameter optimization. Suggestions highlighted in red are for the optimization of the IoV scenarios featuring high concurrency, large data volume, and many read-write operations.
back_log (Set a large value for high-concurrency scenarios)
Default value: 3000
Symptom: If the value is too small, the following error may occur:
SQLSTATE[HY000] [2002] Connection timed out;
Suggestion: Increase the value of this parameter.
innodb_autoinc_lock_mode (It can avoid the deadlock and improve the performance)
Default value: 1
Symptom: When auto-incrementing table locks are used for loading data through the INSERT ⋯ SELECT statement or REPLACE ⋯ SELECT statement, applications may encounter deadlocks during the concurrent data import process.
Suggestion: We recommend that you change the value of innodb_autoinc_lock_mode to 2 to enable the use of the lightweight mutex lock (only in row mode) for all types of Insert operations. This avoids auto_inc deadlocks while greatly improving the performance of the INSERT ⋯ SELECT statement.
NOTE: If the parameter value is set to 2, you must set the format of binlog to row.
query_cache_size (you are recommended to set this value to 0 for IoV scenarios with many read-write operations.)
Default value: 3145728
Symptom: The database goes through a number of different statuses, including checking query cache for query, waiting for query cache lock, and storing results in query cache.
Suggestion: ApsaraDB for RDS disables the query cache by default. If the query cache is enabled for your instance, you can disable it when the preceding problem occurs.
net_write_timeout (This parameter can avoid car data write failure caused by timeout.)
Default value: 60
Symptom: If the parameter value is too small, the client may report an error "the last packet successfully received from the server was milliseconds ago" or "the last packet sent successfully to the server was milliseconds ago".
Suggestion: The default value of this parameter for ApsaraDB for RDS instances is 60s. A small value of net_write_timeout may result in frequent disconnections when the network condition is poor or it takes a long time for the client to process each block. In this case, we recommend that you increase the parameter value.
tmp_table_size (you are recommended to enable this parameter in large memory scenarios to improve the query performance.)
Default value: 2097152
Symptom: SQL execution takes a longer time if temporary tables are used when a complex SQL statement contains GROUP BY and DISTINCT clauses which cannot be optimized through an index.
Suggestion: If the application contains many GROUP BY and DISTINCT clauses and the database has enough memory, you can increase the values of tmp_table_size and max_heap_table_size to improve query performance.
loose_rds_max_tmp_disk_space
Default value: 10737418240
Symptom: If the temporary file size exceeds the value of loose_rds_max_tmp_disk_space, the following error may occur.
The table '/home/mysql/dataxxx/tmp/#sql_2db3_1' is full
Suggestion: Check whether the SQL statements resulting in additional temporary files can be optimized by indexing or other means. If your instance has enough space, you can increase the value of this parameter to guarantee normal execution of SQL statements.
loose_tokudb_buffer_pool_ratio
Default value: 0
Suggestion: If you use the TokuDB storage engine in your ApsaraDB for RDS instance, we recommend that you increase the value of the parameter to improve the access performance of the TokuDB engine table.
loose_max_statement_time
Default value: 0
Symptom: If the query time exceeds the value of this parameter, the following error may occur.
ERROR 3006 (HY000): Query execution was interrupted, max_statement_time exceeded
Suggestion: To control the SQL execution time in the database, enable this parameter. The unit is milliseconds.
loose_rds_threads_running_high_watermark (This parameter can be used for protection purposes in high concurrency scenarios.)
Default value: 50000
Suggestion: This parameter is often used for handling seckilling or highly concurrent requests, offering effective database protection.
Elasticsearch is a Lucene-based search and data analysis tool that provides a distributed service. Elasticsearch is an open-source service conforming to the Apache open-source terms and a mainstream enterprise-level search engine.
Alibaba Cloud Elasticsearch provides the open-source Elasticsearch v5.5.3 and the X-Pack Business Edition for the scenarios such as data analysis and data search. A range of functions such as enterprise-level rights management, security monitoring and alarms, and automatic report generation are built upon open-source Elasticsearch. The following is a test of the read/write performance of Alibaba Cloud Elasticsearch.
Test Environment
Clusters of three Elasticsearch 5.5.3 instances, respectively of types dual core 4 GB, quad core 16 GB, and 16 core 64 GB, 1 TB SSD instances, are used in stressing test. esrally is used for stressing testing.
Rest API
There are two types of stressing test data:
Test Results
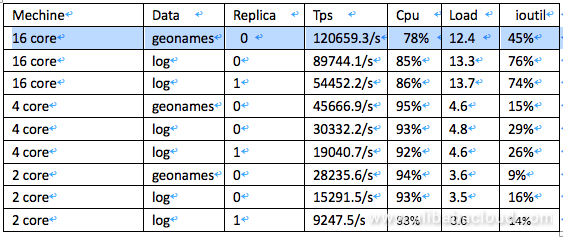
Write performance indicator comparison
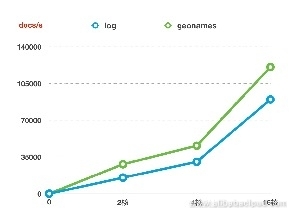
Impact of the machine on the write performance
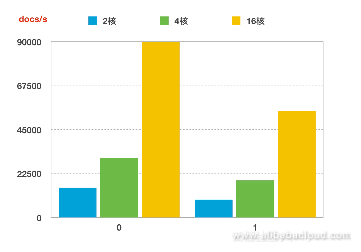
Impact of the number of copies on the performance indicators
Test environment
Test result

Mechine Qps Cpu Load JVM Memory 90th percentile service time
2 core 12378 89% 3.98 47% 17.6141ms
4 core 23498 93% 4.63 48% 20.3789ms
ApsaraDB for HBase is a stable, reliable, and elastically scalable distributed database service based on NoSQL, compatible with the open-source HBase protocol. The functions available and to be available consist of security, public network access, HBase on OSS, backup and recovery, and cold/hot data separation. The supported storage media are ultra cloud disk, cloud SSD, and local disks. HBase may run on a single host or distributed modeled.
HiTSDB Edge is a high performance time series database running close to the client.
The data model used in the test is based on metrics generated randomly. Timelines metric and tagKey, and tagValue consist of tags, that is, a character string in a fixed length (10 bytes) and an index. Timelines metric and tagKey, and tagValue with real meaning are not used as they cannot cover various real scenarios and the test purpose is to compare HiTSDB with other time series databases horizontally. Testing with timelines without real meanings can generate reliable test results when the test data and software and hardware conditions are maintained consistent for these databases. 8 byte long integer time stamps and 8 byte dual precision integer values are used. The data sample is as follows:

Each time before testing, the database service is restarted to avoid impact of the previous operation results on the cache.
Transactions per second (TPS) is the number of data point operations completed in a time unit.
Each time after a write operation, the timeline is manually selected at random for data query, and the data write consistency is verified based on the granularity. For a HiTSDB write operation, the SDK callback is registered, so that the operation failure or success is perceived.
In addition, to avoid the impact of the test data, data is cleared before each test.
The number of timelines is verified on the HiTSDB internal interface/API/TScount during each test. The increase of the timeline number meets with the expectation. Single-node comparison tests for HiTSDB and other databases
One write request for a database may include one or multiple data points. Generally, the more data points a request contains, the higher is the write performance. In the following test, P/R, points/request, indicates the number of data points in a request.
Write performance of a single client under 500 points per request

Write performance of a single client under 1 million timelines
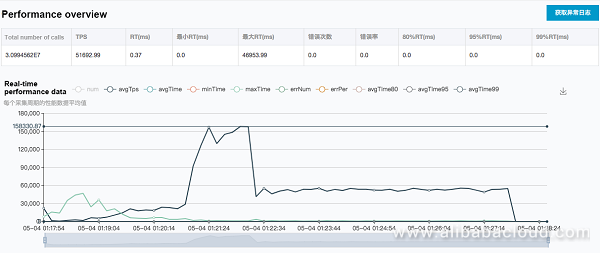
Client CPU Usage
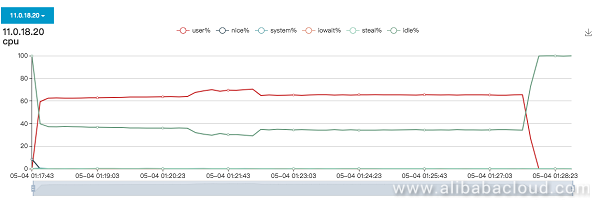
Based on analysis of the result in the table below, the write TPS decreases when the number of timelines increases on the HiTSDB. The write TPS is about 50,000 when the number of timelines reaches 1 million in 6xlarge, which is close to the 60,000 TPS performance released on Alibaba Cloud official website.
Write performance of dual clients under 500 points per request

Write performance of dual clients under 1 million timelines
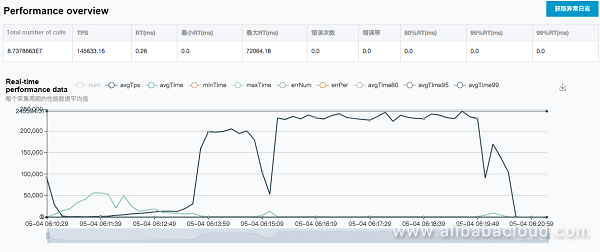
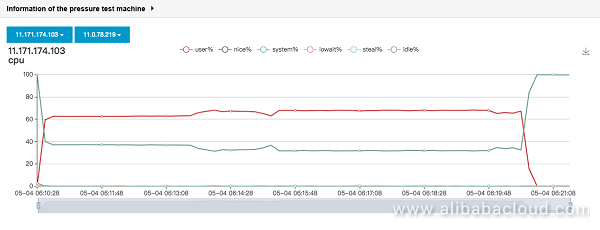
Client CPU Usage
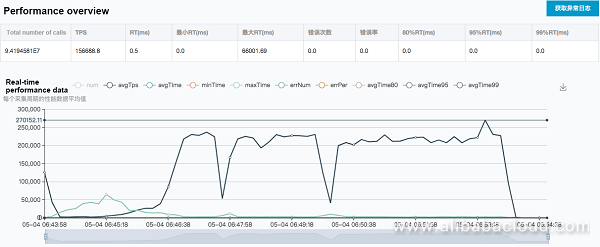
Write performance of four clients under 500 points per request

Write performance of four clients under 1 million timelines
Client CPU Usage
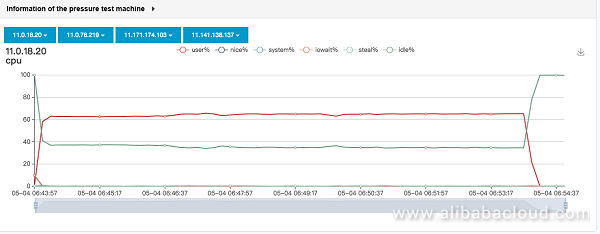
According to the results of these three test groups, the write TPS of HiTSDB decreases when the number of timelines increases. In the 10,000 and 100,000 timeline number levels, the TPS does not change greatly with the number of clients. In the 1000,000 timeline number level, the TPS increases when the number of clients increases from 1 to 2, and does not increase when the number of clients increases from 2 to 4. Therefore, it can be considered that the HiTSDB write TPS peak is about 150,000 in 6xlarge with 1000,000 timelines. The data is cleared before each test. The write TPS decreases (to about 50,000 to 60,000 according to a test) when the timelines increase in the environment. Therefore, 150,000 is a peak value.
Multiple write data entries for one batch
To query data in a long time range, split the query by hour
Cloud Deployment Process for Internet of Vehicles: IoV Series (III)

9 posts | 2 followers
FollowAlibaba Cloud Product Launch - December 11, 2018
Alibaba Cloud Product Launch - December 11, 2018
Alibaba Clouder - March 9, 2018
Alibaba Clouder - October 15, 2018
Alibaba Clouder - October 1, 2019
Alibaba Clouder - November 28, 2018

9 posts | 2 followers
Follow Architecture and Structure Design
Customized infrastructure to ensure high availability, scalability and high-performance
Learn More Oracle Database Migration Solution
Migrate your legacy Oracle databases to Alibaba Cloud to save on long-term costs and take advantage of improved scalability, reliability, robust security, high performance, and cloud-native features.
Learn More Database Migration Solution
Migrating to fully managed cloud databases brings a host of benefits including scalability, reliability, and cost efficiency.
Learn More Cloud Migration Solution
Secure and easy solutions for moving you workloads to the cloud
Learn MoreMore Posts by Alibaba Cloud Product Launch