In order to win this inevitable battle and fight against COVID-19, we must work together and share our experiences around the world. Join us in the fight against the outbreak through the Global MediXchange for Combating COVID-19 (GMCC) program. Apply now at https://covid-19.alibabacloud.com/
By Xiyan(Yan Jiayang) and Waishan(Cao Xu) from AliENT
During the coronavirus disease (COVID-19) outbreak, the demand for entertainment services has been surging across China. Video platforms such as Youku provide users with massive volumes of high-quality videos and online education capabilities throughout this difficult time. In particular, AI-based search is the core entry connecting users and content. Its mission is to allow people to quickly, accurately, and comprehensively obtain their desired video content. Whether it is TV shows like The Surgeon and ER Doctors, live news on the COVID-19 outbreak Situations, or homeschooling resources, this content is delivered to users based on their search input.
Tens of millions of terabytes (TB) of videos and billions of TB of information are played and innumerable videos are updated every second. How does Youku deliver this information to users in a timely and efficient manner? How does Youku ensure that the data is presented accurately?
Youku video search is a core entry to the distribution of cultural entertainment. It has a wealth of data sources and complex business logic. In particular, it is very challenging to ensure the quality of real-time systems. How does Youku video search ensure data quality and measure the impact of data changes on its business? This article will provide a detailed explanation.
The following figure shows the workflow of a search process. From content production to index generation, the data goes through a complex processing procedure. More than 1,000 intermediate tables are generated. Real-time data disappears after being consumed, and as a result, it is difficult to trace and reproduce such data.
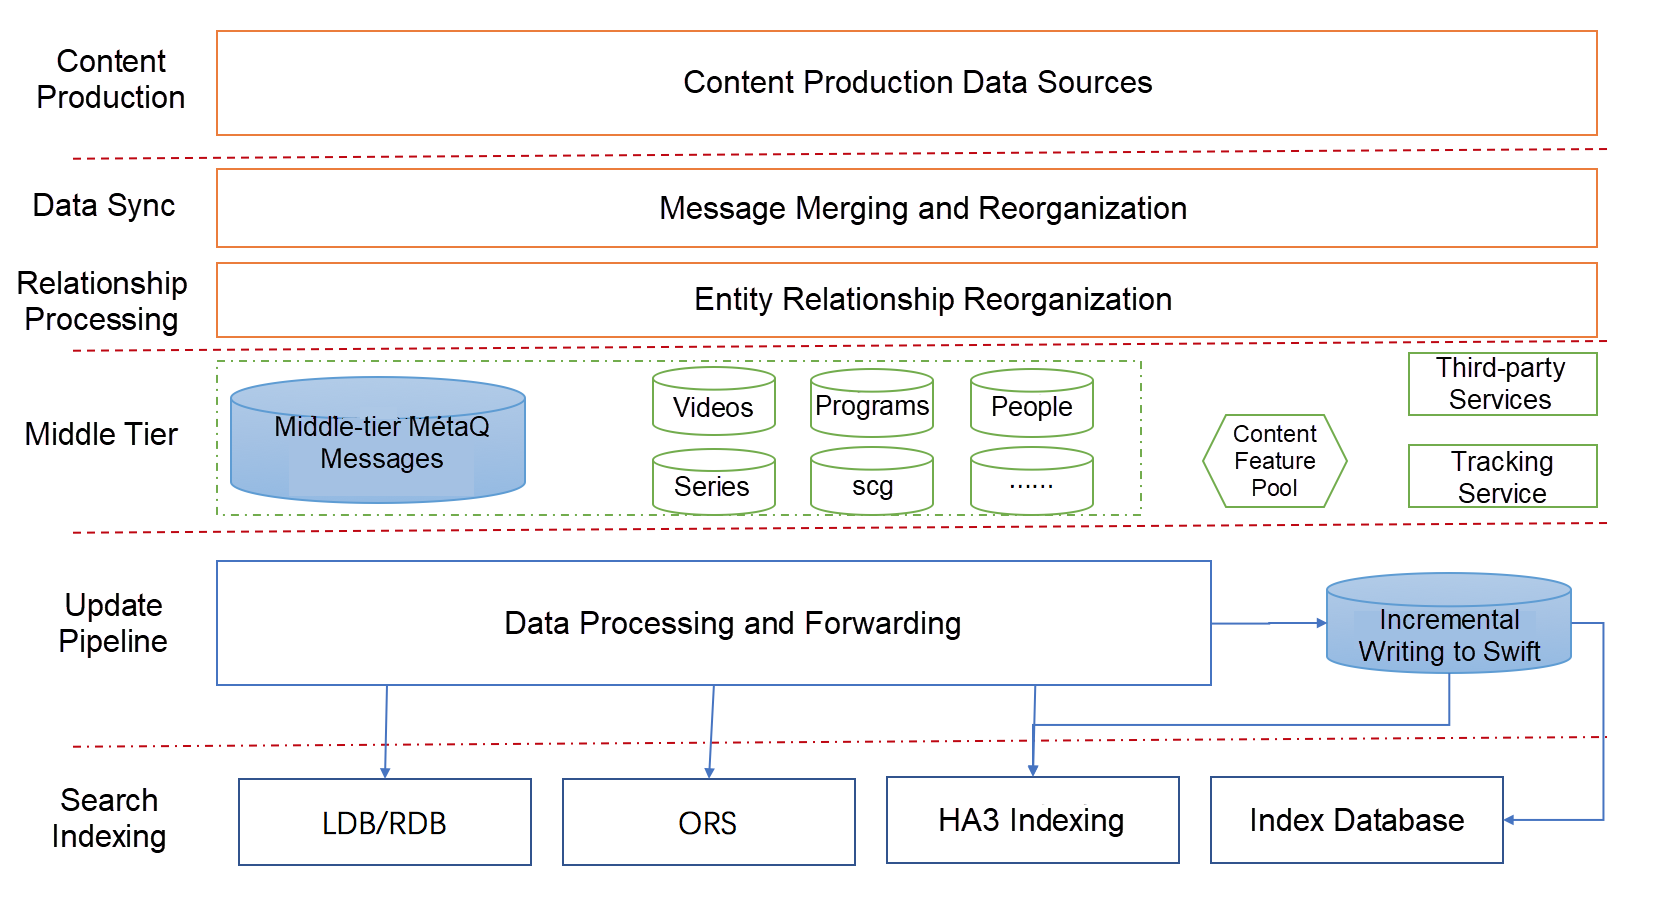
As shown in the preceding figure, data mainly flows as real-time streams throughout the system. At the business tier, the data is divided according to entity types. At the entry to the database, the data is decoupled by tiers in a unified manner. This greatly improves the timeliness and stability of the business. However, quality assurance for such a huge stream computing-based business system poses a major challenge. We have to build a real-time data quality assurance system from scratch and smoothly migrate the business data of the search engine.
To ensure quality, we must first grasp the core issues. Based on an analysis of the architecture and business, we find that the entire stream computing-based business system has several key features: stream computing, data services, full pipeline, and data businesses (including indexing and summary of the search engine). The overall quality requirements demand that we ensure the following aspects:
Based on the closed-loop theory covering online, offline, and the full pipeline, we designed an overall quality assurance solution, as shown in the following figure.
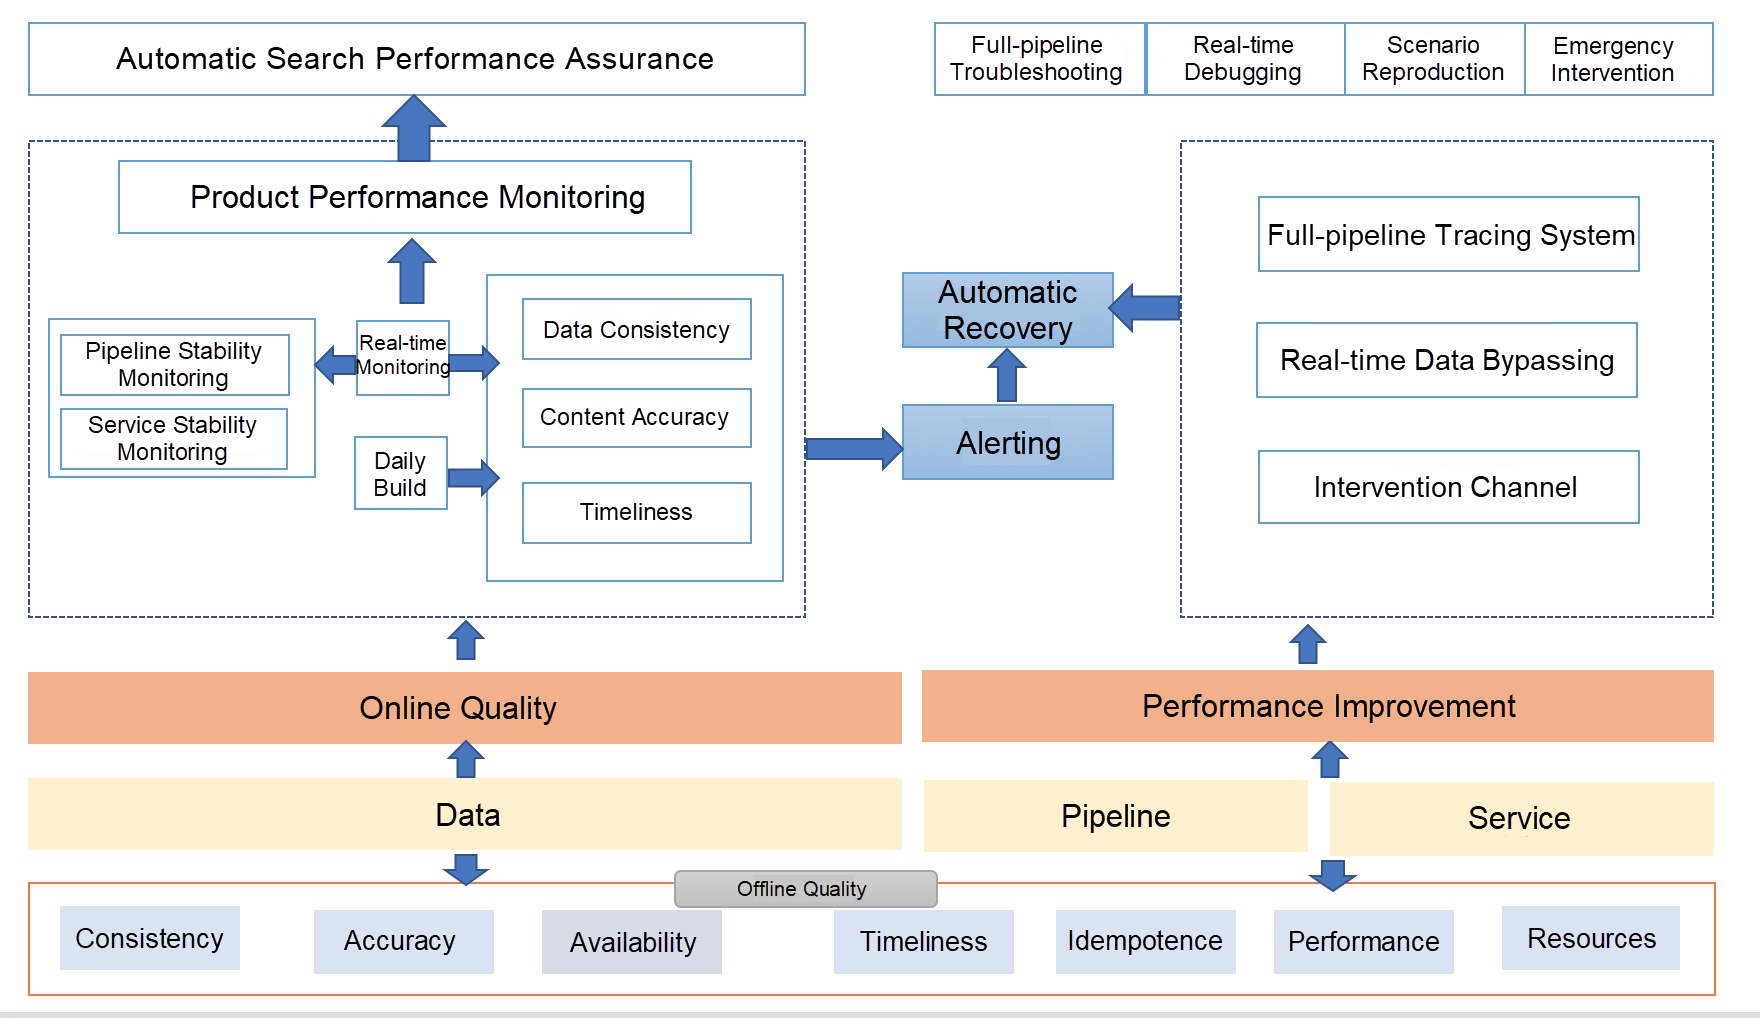
We first carry out data tests, covering node comparison, timeliness, accuracy, consistency, and availability. Then, we design our real-time dumping solution based on Alibaba technologies and resources, as shown in the following figure.
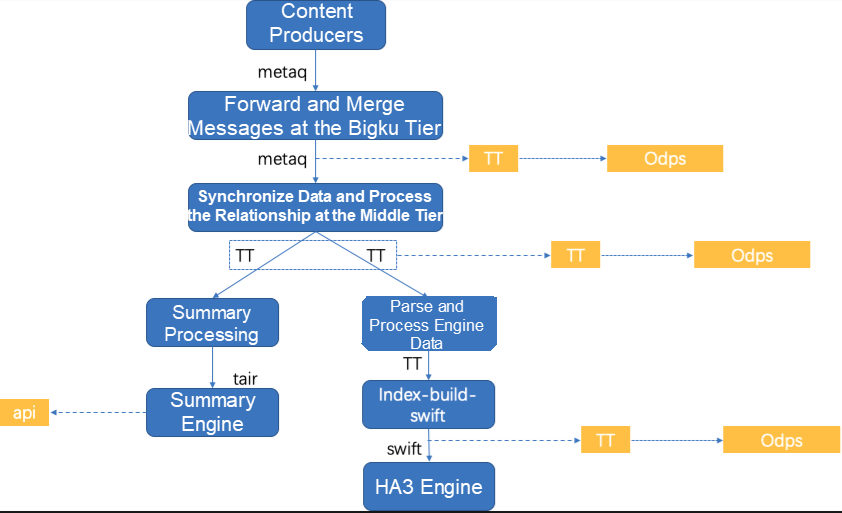
Here, consistency refers to the data consumption consistency between nodes in the data pipeline. To ensure that data consumption is consistent among all nodes, we compare the data consumption of all nodes by time and frequency. The following figure shows the specific solution.
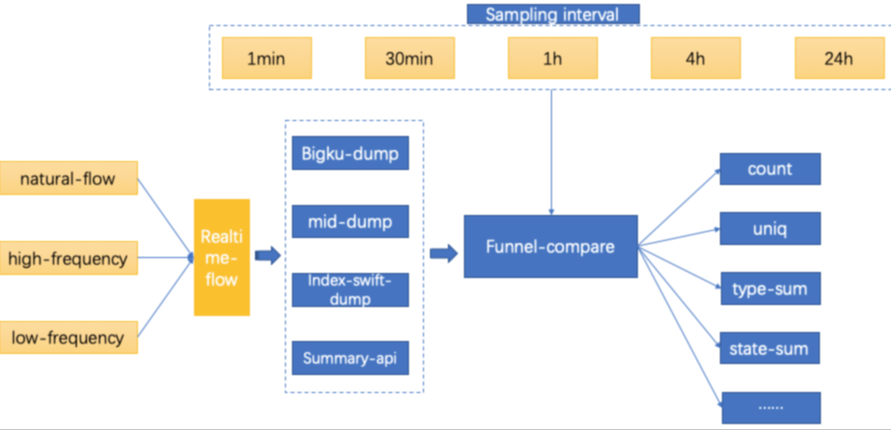
We transfer data streams at different frequencies to the real-time pipeline for consumption, dump the data by using the dumping mechanism of each tier, and compute and analyze the dumped data at different sampling intervals. We use the following data frequencies:
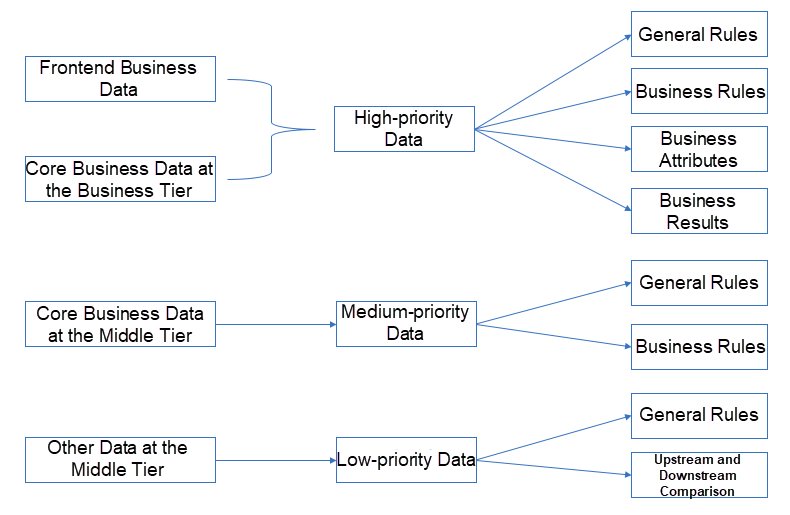
Data accuracy assurance means verifying the specific values of data content according to the following general principles:
First, the accuracy of the data that affects the user experience needs to be prioritized.
Second, the accuracy of core business-related data that is directly used by the business tier needs to be ensured.
Third, the core business-related data at the middle tier is not exposed externally and will be converted into the final-tier business data for the business engine. Therefore, we apply general rules and business rules to ensure the basic data quality at the middle tier. In addition, we make difference comparison between upstream and downstream data to ensure accuracy throughout the process.
Data availability assurance means ensuring that the final data produced through the data pipeline can be used securely and properly. This covers the following aspects: storage, query read and write efficiency, data read and write security, and consistency between data provided for different users.

Availability assurance mainly focuses on the following dimensions: data storage, query, and data protocol (data structure). The criteria are as follows:
In the real-time pipeline, data flows as streams and multiple entities may be updated multiple times. Due to these features, we need to focus on the following core issues when testing timeliness:
As shown in the following figure, we abstract a stream tracing model that integrates a tracing process and a track-wrapper.
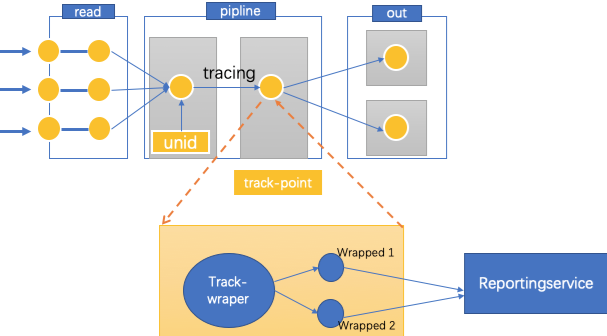
This model allows you to obtain the time spent on each node in the pipeline, including the transfer time and the processing time. You must define a unified tracking specification and format for the track-wrapper and ensure that this information does not affect your business data or greatly increase performance overhead. The following figure shows the final track-info that is output through the tracing process and the track-wrapper. The track-info is in JSON format and therefore has high scalability.
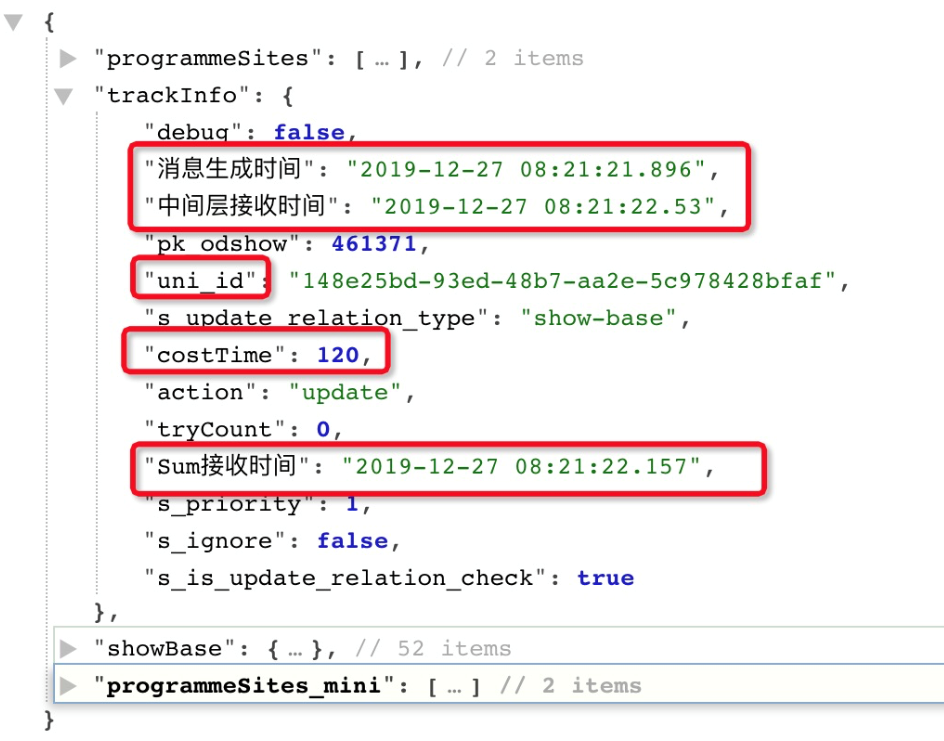
This allows you to easily obtain any desired information and calculate the time spent on each node.

Alternatively, you can measure the timeliness by calculating some statistical metrics through sampling, as shown in the following figure.

In addition, you can filter out the data with obvious anomalies in timeliness and continuously optimize the data timeliness.
In essence, a real-time data pipeline is a set of full-pipeline data computing services. Therefore, we need to test its performance.
First, specify the system services to test in the entire pipeline.
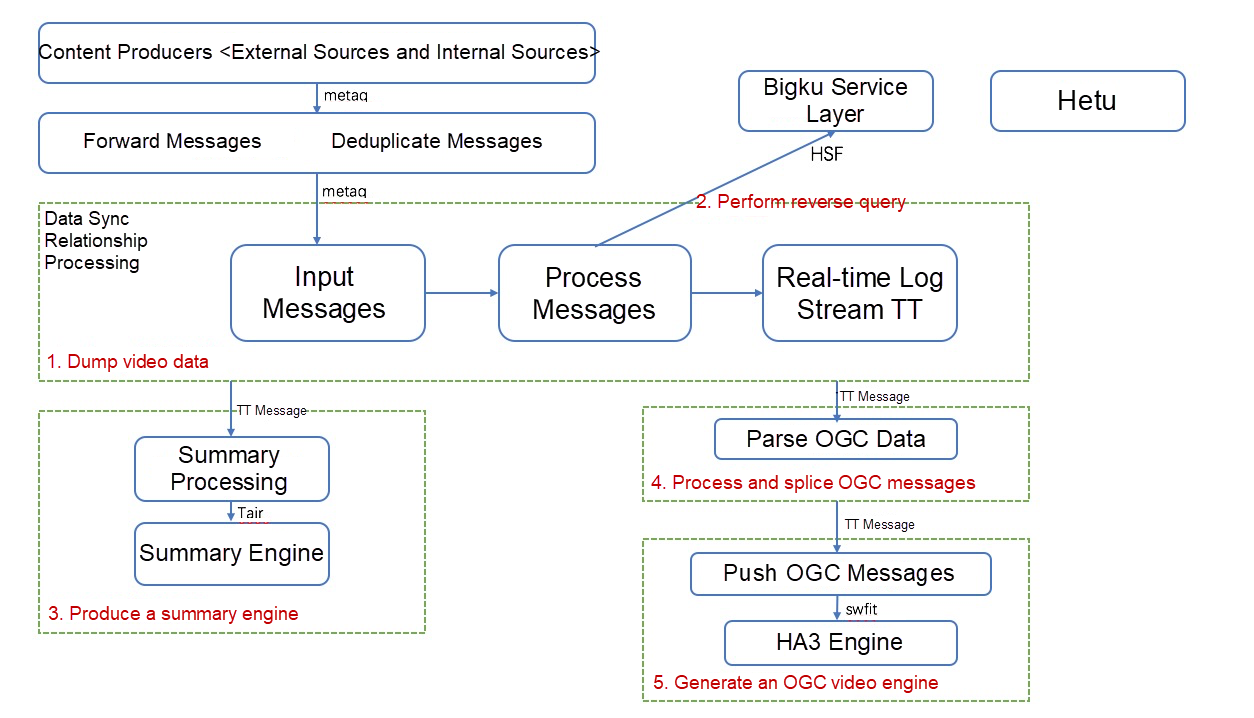
Specifically, we need to test the performance of the Bigku reverse query service, namely the HSF service, and the performance of the nodes in the computing pipeline of Blink.
Second, prepare data and tools.
The business data required in stress testing is messages. We can prepare the data through one of two methods. One is to simulate the most real messages possible. We only need to obtain the message content and then run a program for automatic simulation. The other method is to dump real business data and then play back the traffic. This data is more real.
Due to the nature of the data pipeline, adding loads on the stress testing pipeline means to send message data. So how can we control data sending? Two methods are available. The first method is to develop a service API for sending messages and convert it into a conventional API for stress testing. As such, we can use any Alibaba stress testing tool with this API and turn the entire test into a regular performance test. The second method is to use the message tracing mechanism of Blink to repeatedly consume historical messages for stress testing. However, this method has a disadvantage because the frequency of the messages cannot be controlled.
To perform stress testing, we need to collect metrics, including service metrics and resource metrics, based on business conditions. For more information about the metrics, see the following sample performance test report, where data is truncated.


In terms of stability, we need to ensure the stability of each node in the real-time computing pipeline and the stability of built-in services.
Full-blink computing is used in real-time computing. Therefore, we can manage monitoring tasks based on the features of the Blink system. In the monitoring task for each node, we need to configure stability metrics, including the RPS, delay, and failover. The following figure shows an example of the monitoring results.

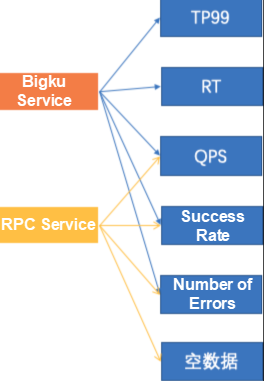
Entity services are high-speed service framework (HSF) services. We monitor the overall service capabilities by using the unified monitoring platform provided by Alibaba. The following figure shows an example of the monitoring results.
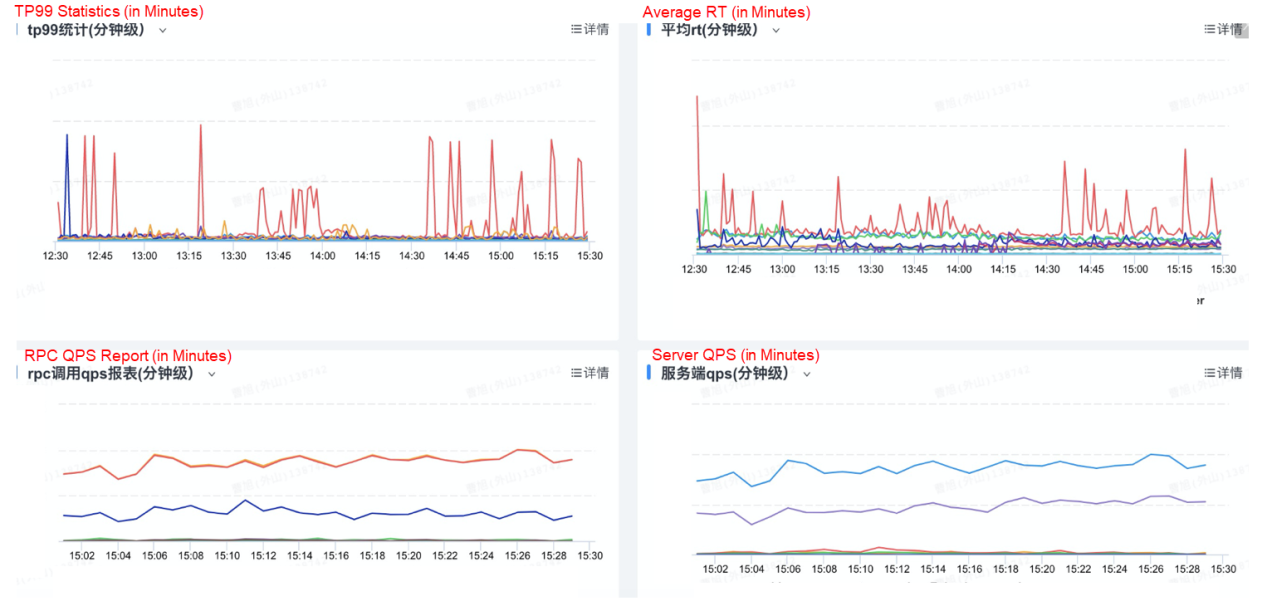
The following figure shows the overall metrics.
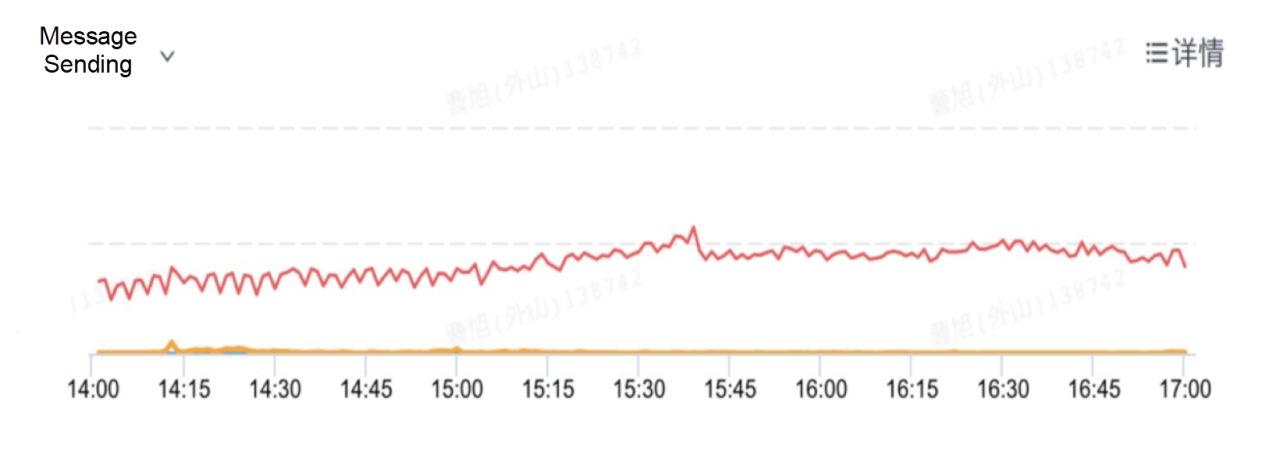
In terms of data consumption, we focus on the consumption capability and exceptions at each tier of the pipeline. We collect data statistics by using the accumulated track-report capabilities and ensure consumption by using the comprehensive basic capabilities of the platform. The pipeline is divided into two tiers:
Core tier: At this tier, we collect statistics on and monitor the output messages according to entity types, including the total number of messages and the number of messages of each type. The following figures show examples of the monitoring results of the core tier.
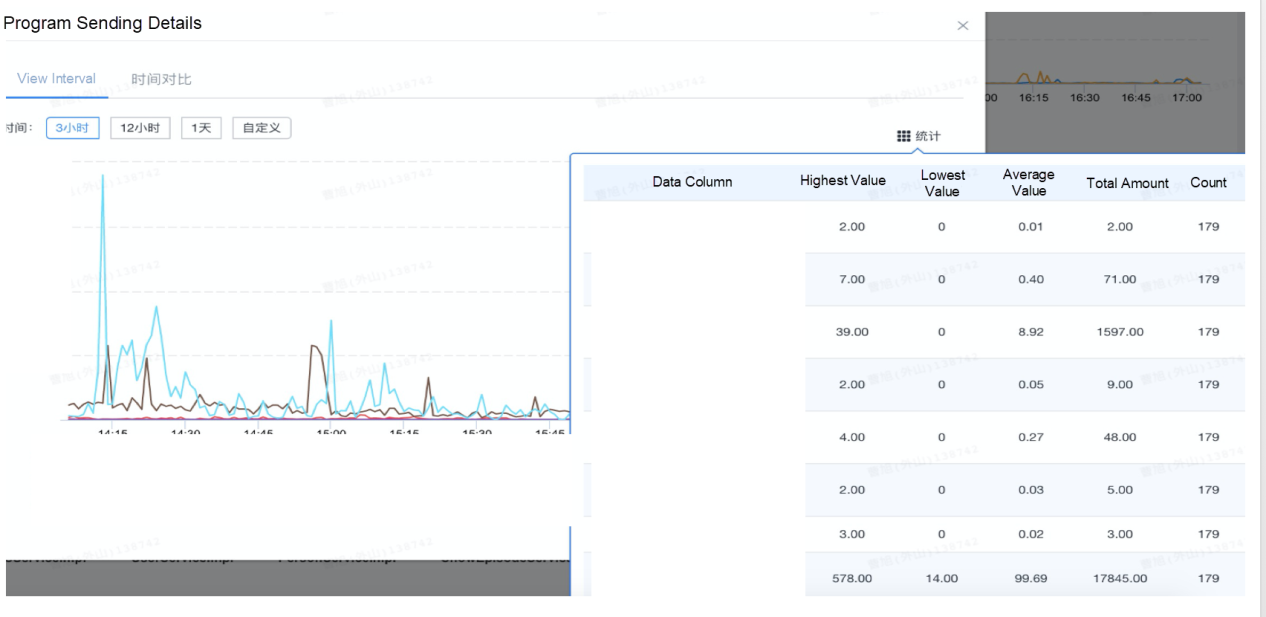
Middle tier: At this tier, we receive the messages processed by each entity and measure the successfully processed messages, failed messages, and skipped messages from the logic tier. This allows us to observe the consumption capability of each tier in the pipeline in real time, including the received messages, successfully processed messages, failed messages, and abnormal but reasonable messages. The following figure shows an example of the monitoring results of the middle tier.
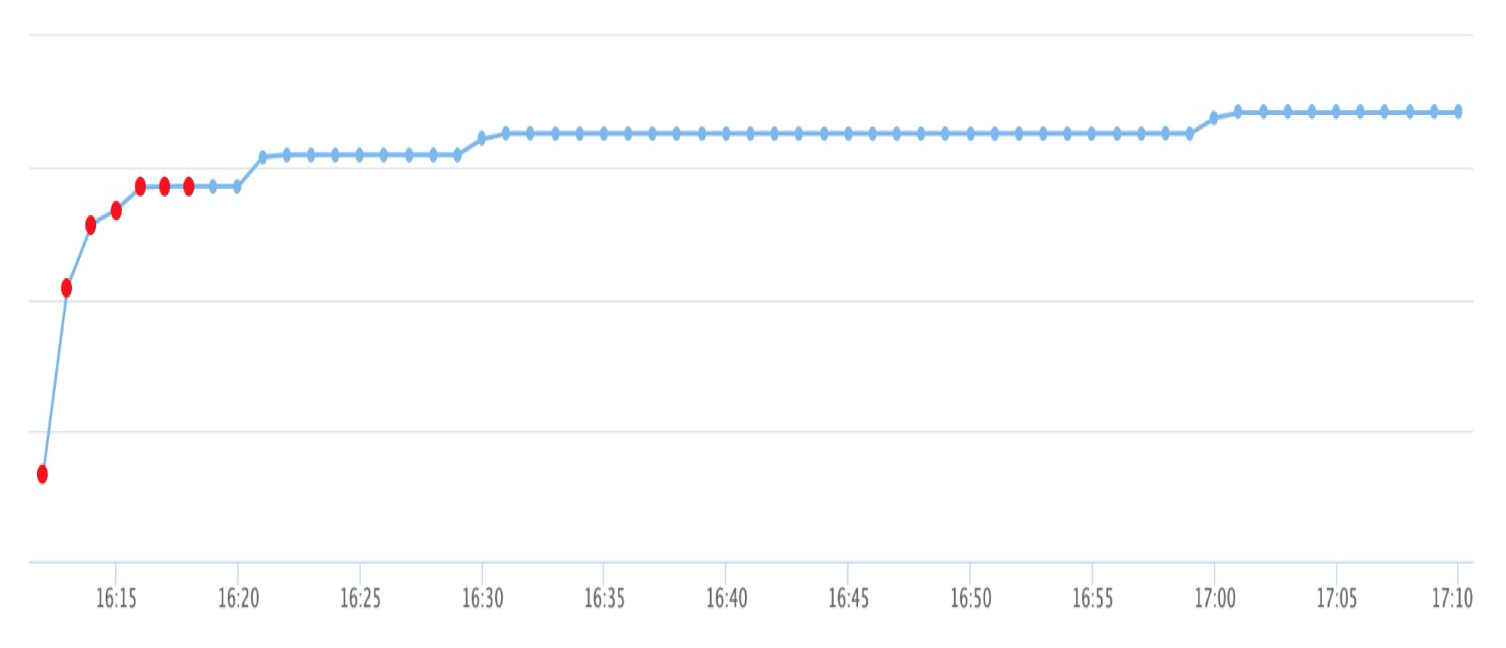
At the data content tier, we perform a precise data inspection, covering data updates, data content, and business results. As such, a closed-loop detection is implemented, covering data production, consumption, and availability, as shown in the following figure.
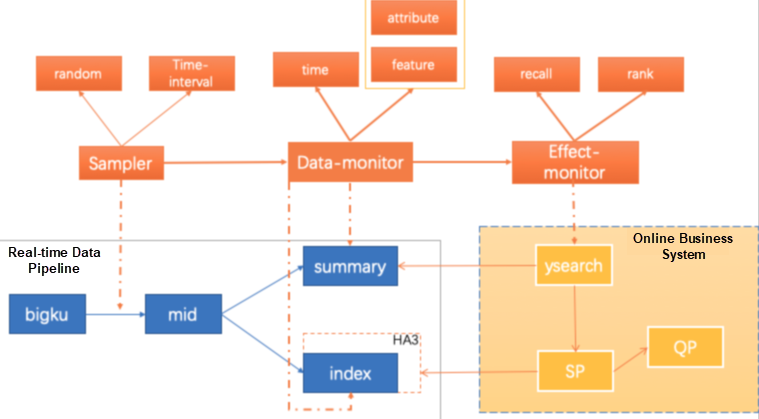
As shown in the figure, data content assurance is divided into three parts:
1) Sampler: Extracts data to be tested from the messages consumed by Blink in real time in the pipeline. Generally, only the data ID is extracted. Sampling policies are divided into interval sampling policies and random sampling policies. An interval sampling policy selects a specific piece of data at a fixed interval for inspection, whereas a random sampling policy samples data based on a certain random algorithm.
2) Data-monitor: Checks data content, including the update timeliness, data features, and data attributes.
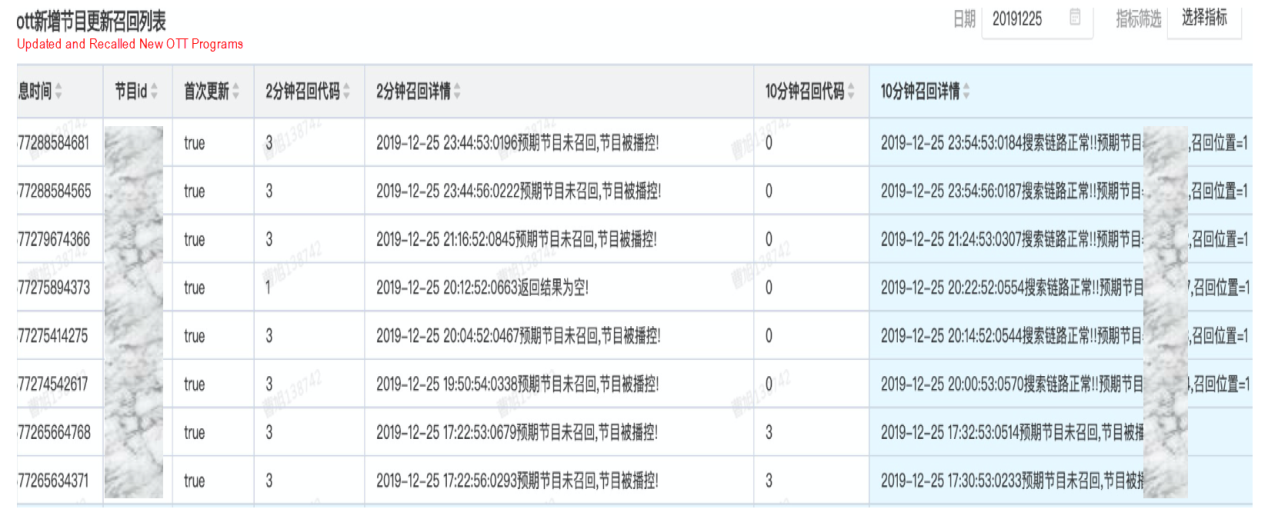
3) Effect-monitor: Checks the effect of normal data updates on online business in real time. This check focuses on the processing of search results (recall and sorting) as well as data attributes that are related to the user experience.
The following figure shows an example of the real-time effect monitoring results.
The following figure shows an example of the real-time intervention channels.
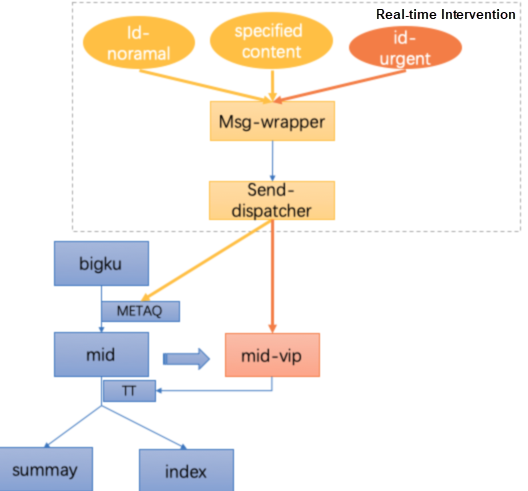
The real-time intervention system assembles messages and distributes the messages through channels according to different intervention requirements, message content, and intervention mechanisms.
1) When the business pipeline of the primary channel is normal, to forcibly update the data based on the ID, you only need to enter the ID and update the data in the primary pipeline.
2) When you need to forcibly send specific data to a specified message channel, you can perform precise intervention based on the data content.
3) In an emergency, you can perform forcible intervention when the data processing at the middle tier of the primary pipeline has a relatively high delay or is completely congested, which makes it impossible to normally obtain and input the data at the downstream business tier. We set up a VIP message channel by fully copying the primary logic. Therefore, we can directly intervene in outbound messages by using the VIP channel and ensure that the business data can be updated preferentially in normal scenarios.
In terms of quality efficiency, we hope that R&D engineers can quickly perform self-tests before launch and efficiently locate and eliminate online problems. This way, we can achieve fast iteration and reduce manpower investment. Therefore, we provide two efficiency improvement systems: a real-time debugging system and a real-time full-pipeline tracing system.
Real-time debugging is a set of services provided based on the capabilities of real-time message channels and the debugging mechanism. This is very useful for R&D engineers in scenarios such as self-tests and problem reproduction. The debug mode allows R&D engineers to learn more about the processing at the business tier of the pipeline. At the business tier, R&D engineers only need to customize the debugging content as required. This is a highly universal and scalable approach that does not involve other access costs.
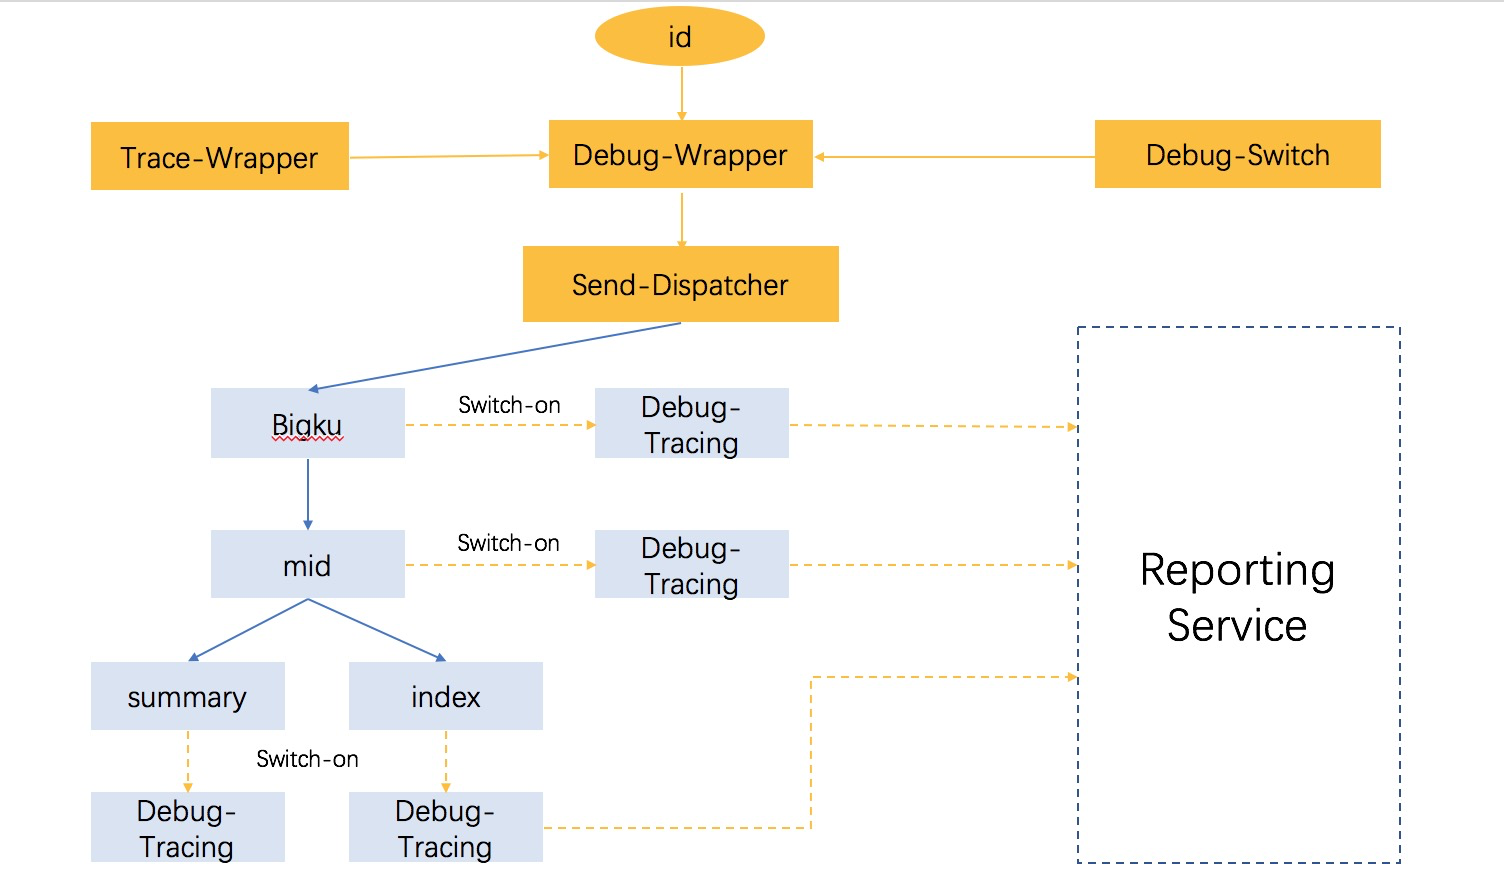
The following figure shows an example of the platform.

By entering the program ID and sending the message, R&D engineers can automatically enter the real-time debugging mode.
In addition, the platform provides an expert mode where message content can be specified. This allows R&D engineers to conveniently customize message content for testing and intervention.

We have extracted a general model for real-time full-pipeline tracing and also provide a more fine-grained tracing mechanism. Let's look at the implementation of a tracing system based on the logical view of the real-time business pipeline, as shown in the following figure.
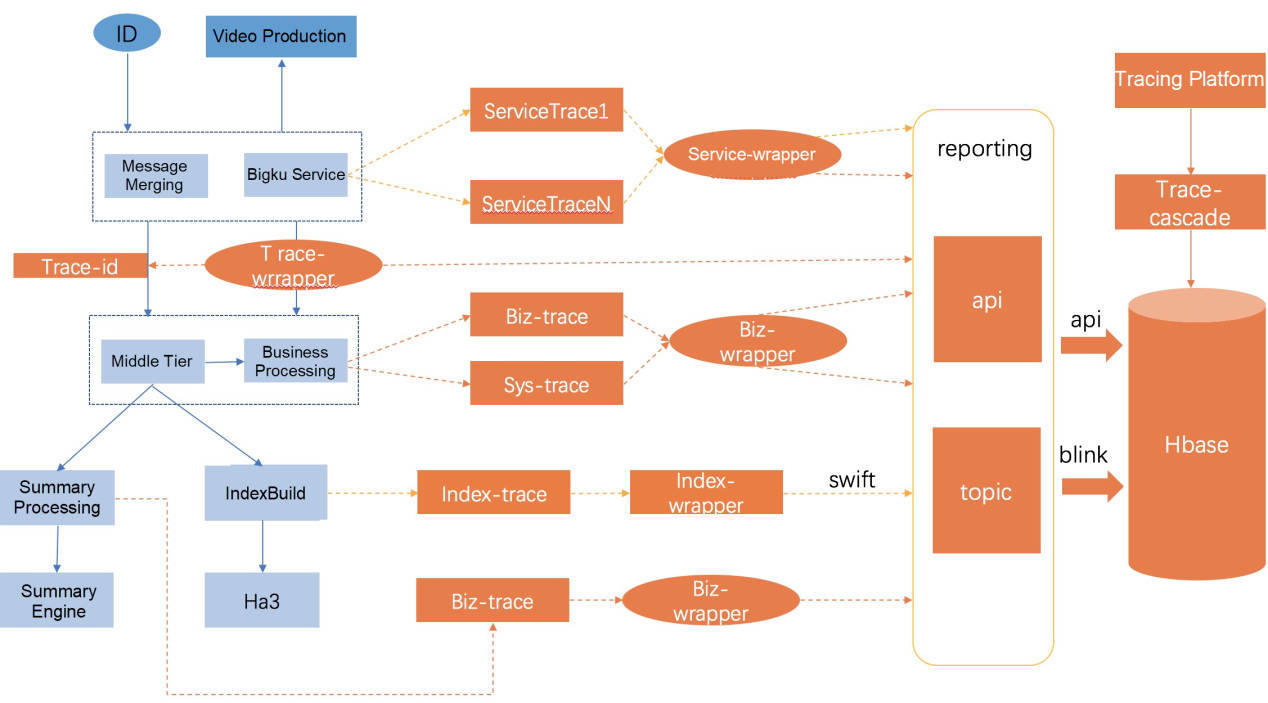
From the perspective of pipeline tiers, the system is currently divided into four business blocks and data streams are displayed in chronological order.
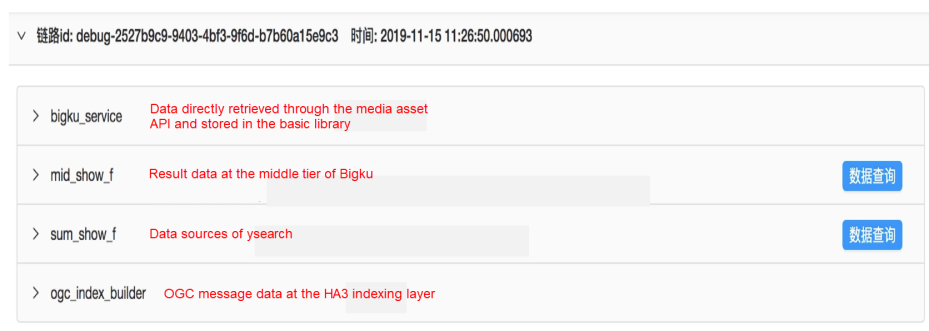
1) bigku_service: This block shows the image data of the current message.

2) mid_show_f: This block contains basic algorithm features, that is, first-tier features, including business information and system information. This information is engineering-related metric data and is mainly used to provide guidance for optimization.

3) sum_video_f and ogc: These blocks contain the data of the search pipeline. For example, complex truncation logic is usually used in programs. We can use a dictionary table to provide a logical view of the data tier, allowing R&D engineers to view all the information about the pipeline.
To ensure the quality of real-time data content, we implement an integrated business performance and data quality monitoring solution. Based on this, we build a closed-loop pipeline performance assurance system to allow users to detect, locate, and fix problems in real time. This system has achieved good results. The following figure shows the solution.
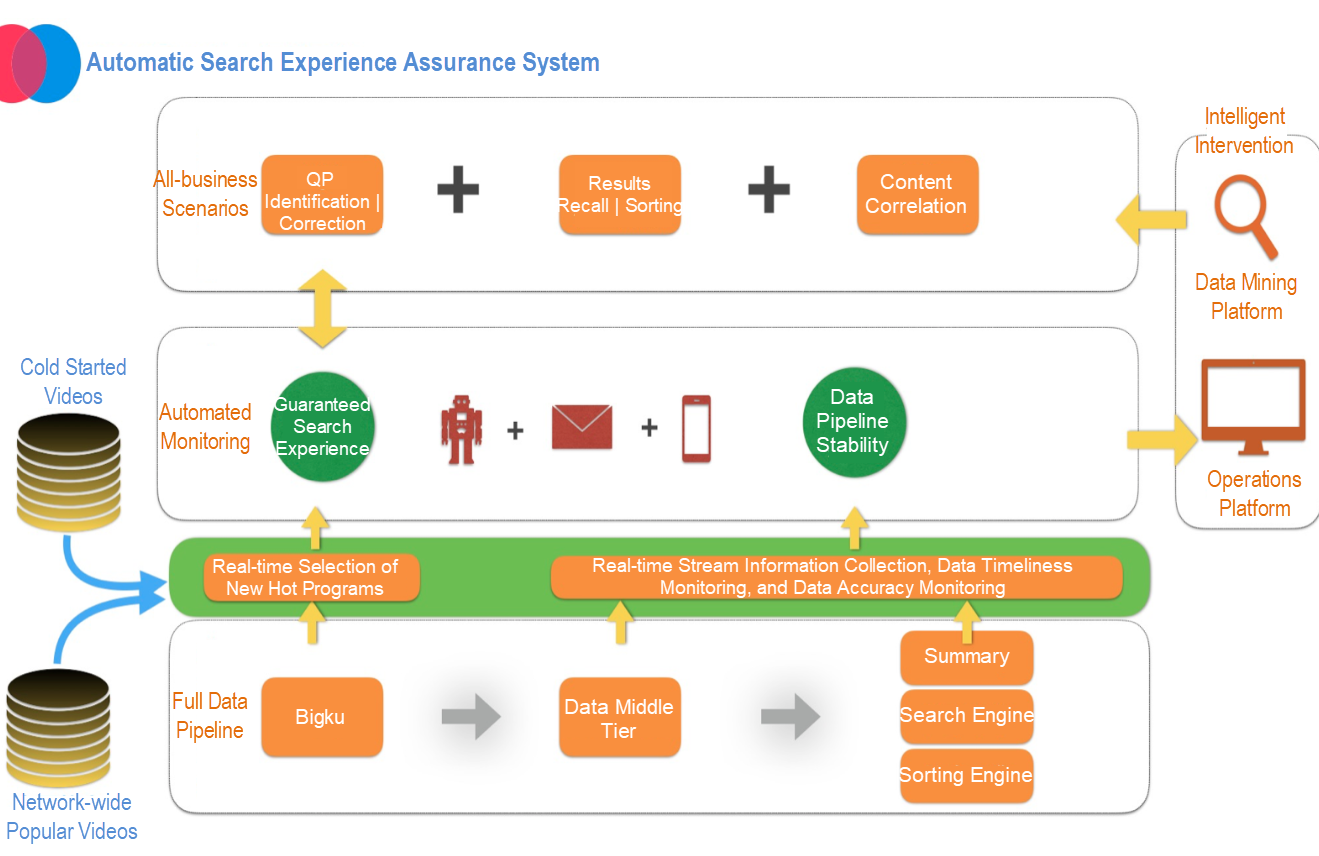
Data is the lifeblood of algorithms. With data quality assurance and the efficient distribution of high-quality content, we can better retain users while allowing them to watch high-quality video content during the COVID-19 epidemic. Data quality is a long-standing barrier and, in the future, we must delve into every node and logic to explore the relationship between massive amounts of data and user perception. This will help us develop the algorithmic business while enabling large numbers of users to enjoy the spiritual nourishment brought by cultural entertainment.
While continuing to wage war against the worldwide outbreak, Alibaba Cloud will play its part and will do all it can to help others in their battles with the coronavirus. Learn how we can support your business continuity at https://www.alibabacloud.com/campaign/fight-coronavirus-covid-19
How Alibaba Cloud's Storage Technology Is Supporting Online Education

2,593 posts | 791 followers
FollowAlibaba Clouder - January 17, 2018
Proxima - April 30, 2021
Alibaba Cloud Community - November 26, 2024
ApsaraDB - December 13, 2024
Alibaba Clouder - November 11, 2020
Alibaba Clouder - October 23, 2020

2,593 posts | 791 followers
Follow Media Solution
An array of powerful multimedia services providing massive cloud storage and efficient content delivery for a smooth and rich user experience.
Learn More Fight Coronavirus [COVID-19]
Empowering businesses to fight against coronavirus through technology
Learn More Storage Capacity Unit
Plan and optimize your storage budget with flexible storage services
Learn More Hybrid Cloud Storage
A cost-effective, efficient and easy-to-manage hybrid cloud storage solution.
Learn MoreMore Posts by Alibaba Clouder