By Sheng Dong, Alibaba Cloud After-Sales Technical Expert
Troubleshooting completely unfamiliar issues and system components is a great pleasure and challenge for Customer Services. This article outlines and analyzes one such issue. For effective troubleshooting, we must understand some completely unfamiliar components, such as Systemd and D-Bus.
However, the ideas and methodology of troubleshooting cross-applies to multiple scenarios and this article illustrates the key concepts with an example to help you understand better.
Alibaba Cloud has its own Kubernetes container clusters and with the rapid increase of Kubernetes cluster shipments, online users find that nodes are in NotReady state with a very low probability. There are one or two customers encountering the issue every month.
When a node is in the NotReady state, the master node in the cluster cannot control the specific node. For example, delivering new pods or capturing real-time information about pods running on the node.

"Hardware bases" of Kubernetes clusters are cluster nodes in the form of single-node systems. Such nodes are either physical machines or virtual machines. Cluster nodes include a master node and worker nodes. The master node loads cluster control components, such as schedulers and controllers, while worker nodes run businesses.
Kubelet is the proxy running on each node, which communicates with control components and manages worker nodes according to control component instructions.

When a cluster node enters the NotReady state, check whether kubelet running on the node is normal. When this issue occurs, run the systemctl command to check the status of kubelet. Ensure that it runs properly as a daemon managed by Systemd. Following errors occur while running the journalctl command to view kubelet logs.

The errors indicate that the container runtime does not work and the pod lifecycle event generator (PLEG) is unhealthy. The container runtime indicates the docker daemon. Kubelet controls the container lifecycle by operating the docker daemon. The PLEG is the health check mechanism used by kubelet to check the container runtime. Also, use kubelet in polling mode to check the container runtime.
However, the cost of polling mode is high. Therefore, PLEG was developed. The PLEG checks the health of the container runtime in "interruption" mode although both polling and "interruption" mechanisms are used.
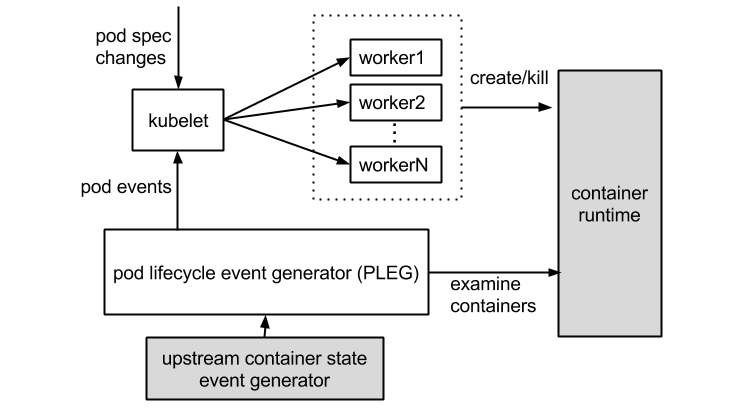
Determine whether the container runtime is faulty according to the preceding errors. IWhen you run the docker command to run a new container, and the command does not respond, it indicates that the assumptions about the preceding errors are accurate.
The Docker is the container runtime used by Alibaba Cloud Kubernetes clusters. For versions later than 1.11, the Docker is split into multiple components to adapt to the OCI standard. After splitting, it includes the Docker daemon, containerd, containerd-shim, and runC. The containerd component manages the lifecycle of containers on cluster nodes and provides the gRPC interface for the Docker daemon.
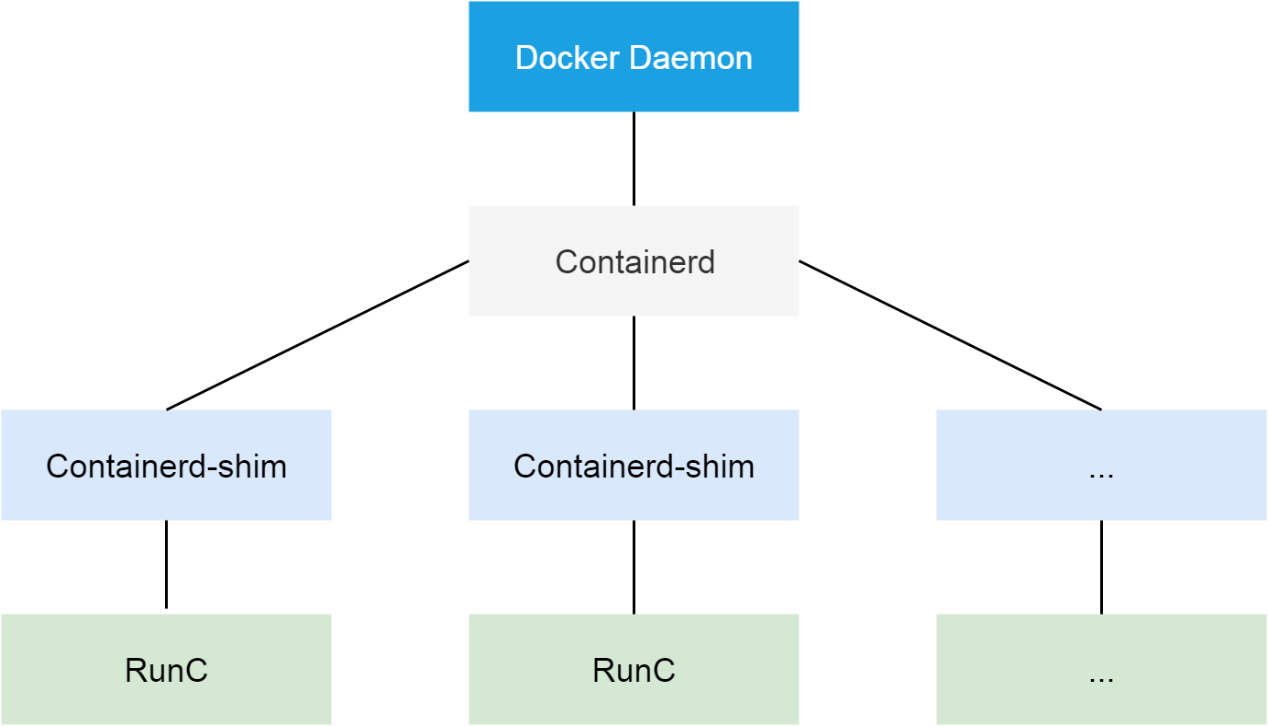
Here, the PLEG considers that the container is not running properly. Therefore, you need to start with the Docker daemon. Run the kill -USR1 <pid> command to send the USR1 signal to the Docker daemon. After receiving the signal, the Docker daemon outputs all of its thread call stacks to the file/var/run/docker folder.
The call stacks of the Docker daemon are relatively easy to analyze. Note that most call stacks are similar to those shown in the following figure.
According to the name of each function on a stack and the name of the file or module where the function is located, the lower half of the call stack is the process of routing a received HTTP request. The first half is the actual processing function. Finally, the processing function enters the waiting state, waiting for a mutex instance.
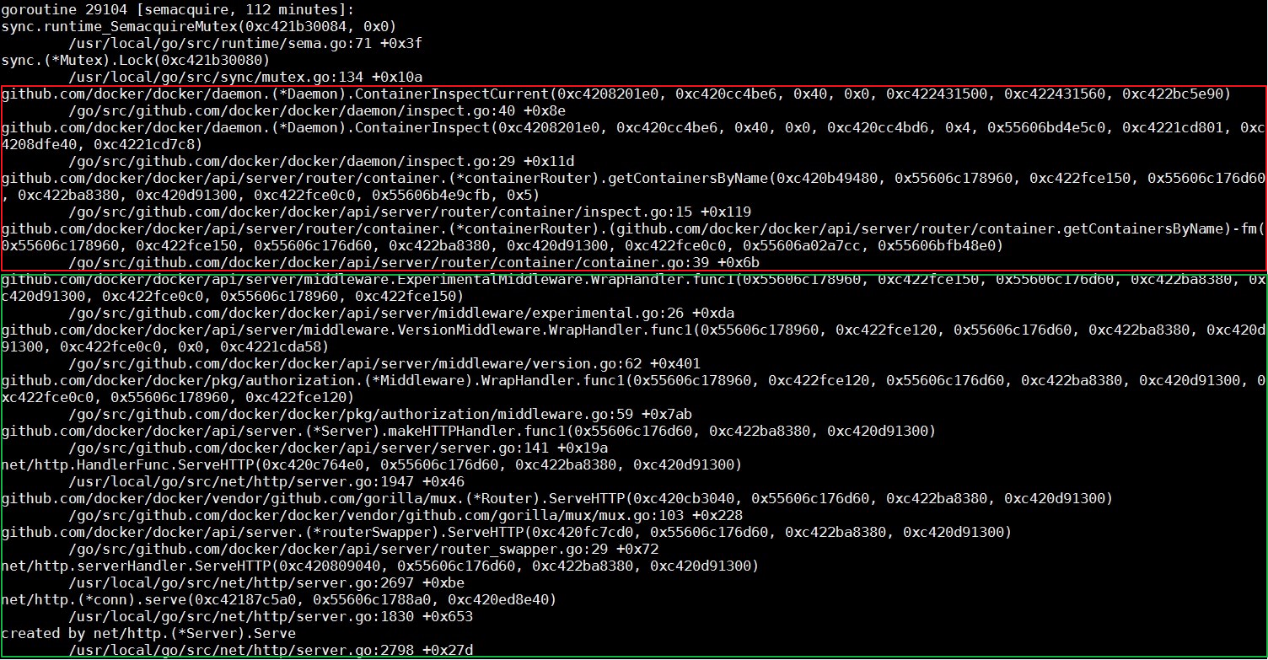
Now, check the implementation of the ContainerInspectCurrent function. It is important to understand that the first parameter of this function is the mutex pointer. Using this pointer to search for the entire call stack file, find all threads waiting on the mutex pointer. Also, see the thread shown in the following figure.
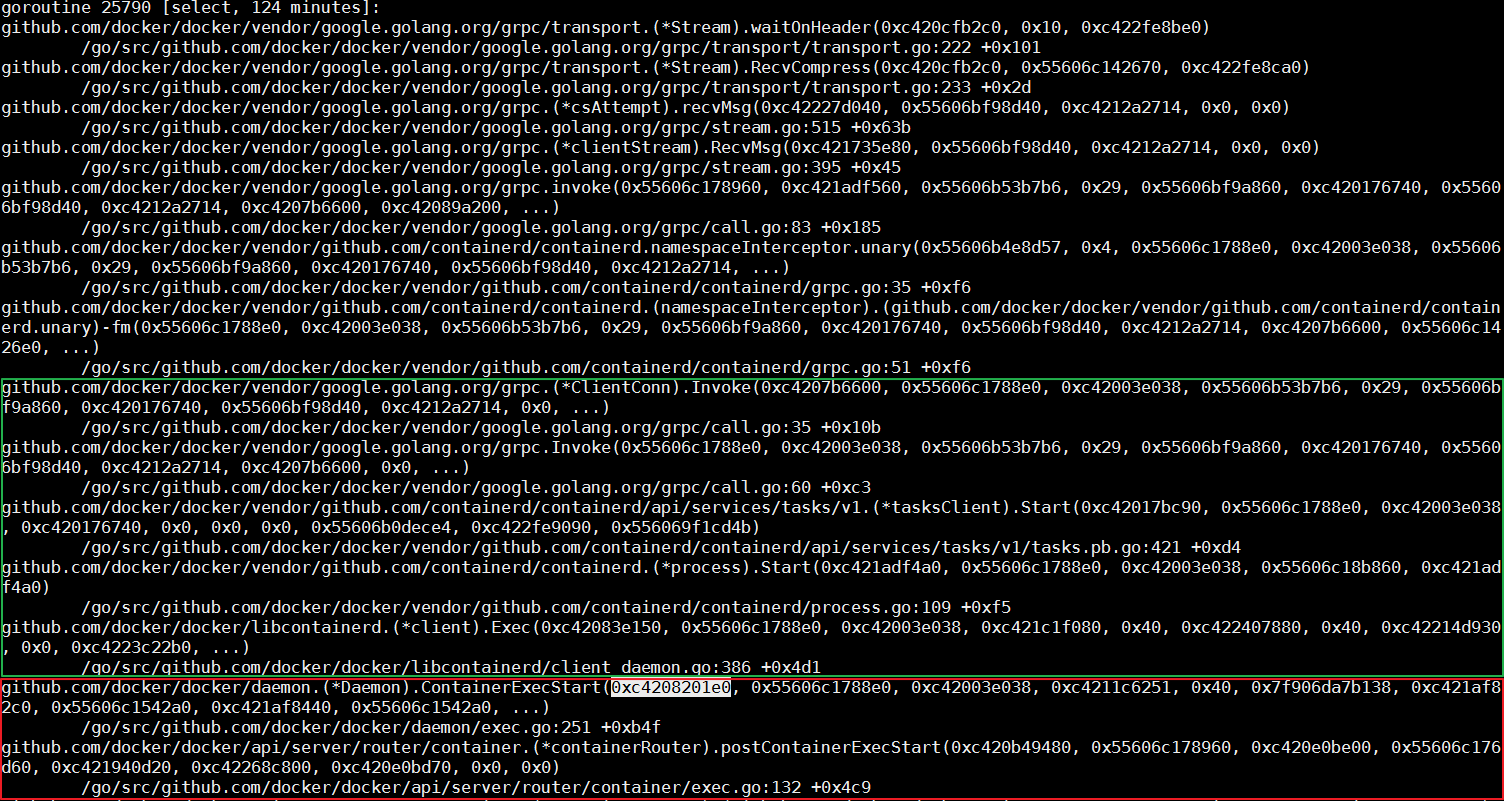
In the thread, the ContainerExecStart function receives the mutex parameter while processing a specific request. However, the ContainerExecStart function is not waiting for mutex but has taken the ownership of mutex and turned the execution logic to the containerd call. Use code to verify the same.
As mentioned above, containerd provides the gRPC interface for the docker daemon. The first half of the call stack indicates that the docker daemon calls containerd through a gRPC request.
Similar to the Docker daemon, run the kill -SIGUSR1 <pid> command to output call stacks of containerd. The difference is that the call stacks are output to message logs but not a folder.
As a gRPC server, containerd creates a thread to process the request after receiving a remote request from the Docker daemon. There is no need to focus on details about gRPC here. On the client call stack of the request, check that the core function of the call is a Start process. While searching for fields such as Start, Process, and process.go in the call stack of containerd, easily find the thread shown in the following figure.
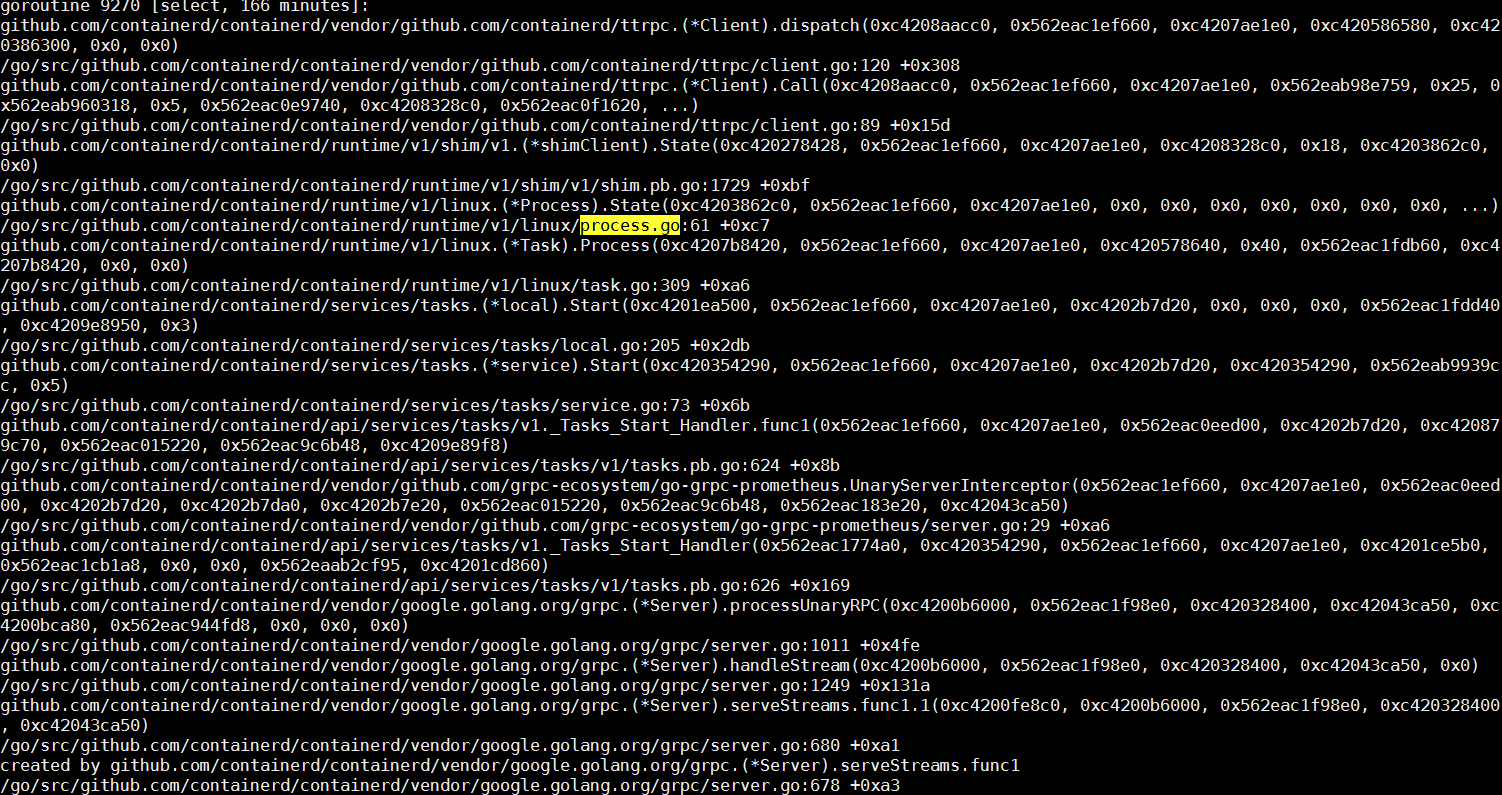
The core task of this thread is to create a container process depending on runC. After the container is started, runC processes exit. Next, check whether runC successfully completes tasks. In the process list, there are some runC processes still running in the system, which is out of expectations.
The time consumed for starting a container is roughly equal to the time take for starting a process. If a runC process is running in the system, runC cannot start a container.
The runC command of the container runtime is a simple encapsulation of libcontainer. This tool manages a single container, such as creating a container or deleting a container. At the end of the preceding section, it is mentioned that runC cannot create a container. Kill the corresponding processes, then run the same command on the command line to start the container, and use strace to track the entire process.
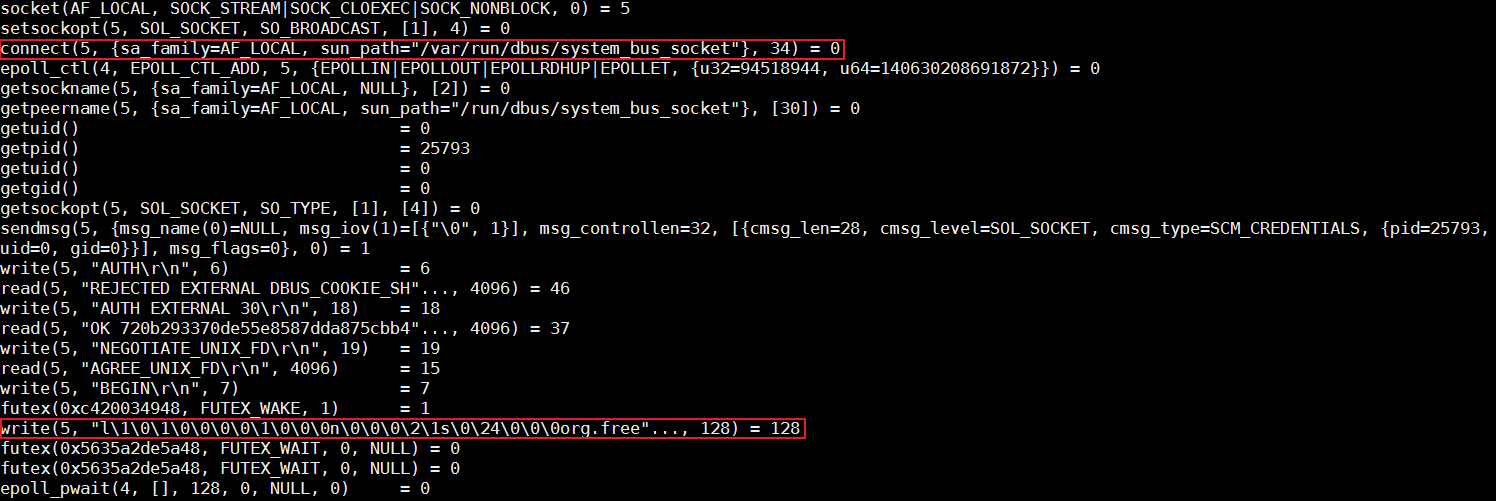
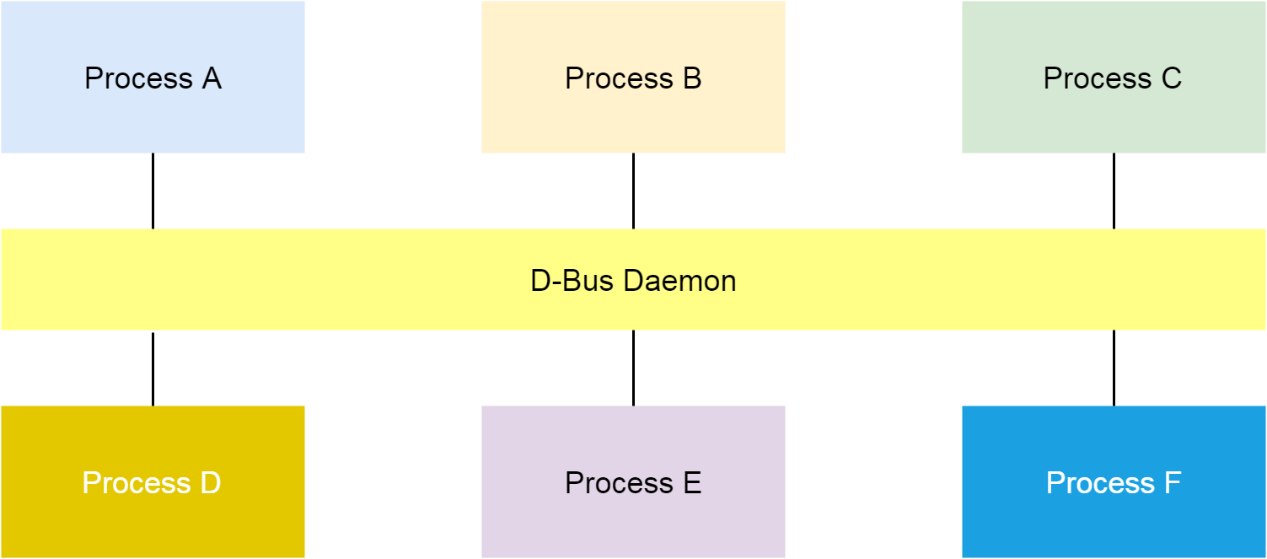
According to the analysis, runC stops writing data to D-Bus with the org.free field. In Linux, D-Bus is a mechanism for inter-process messaging.
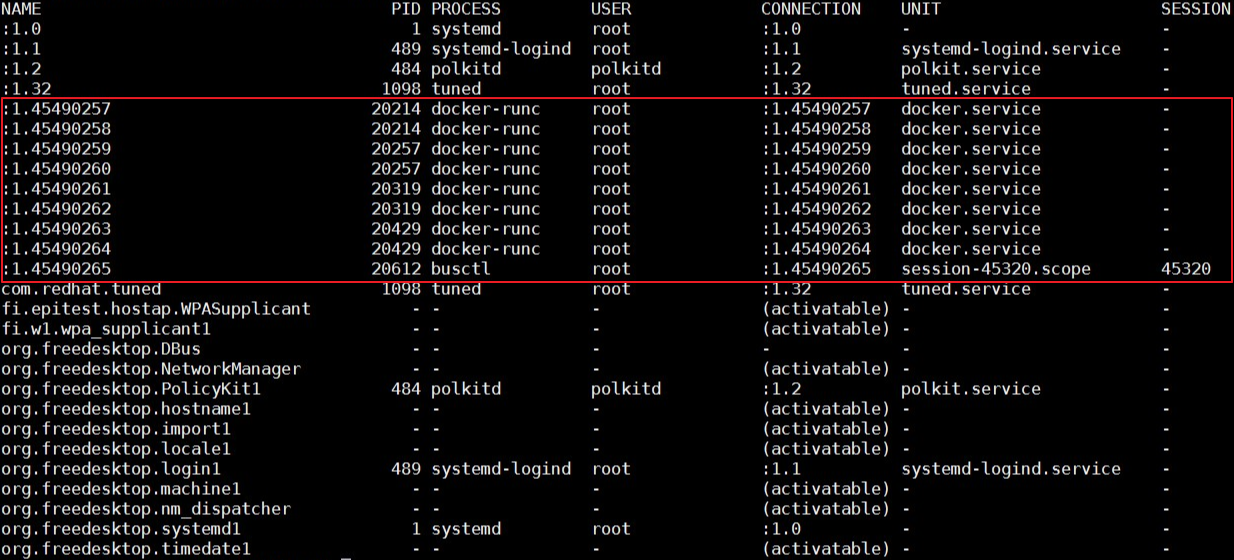
Run the busctl command to list all existing buses in the system. When the issue occurs, the cluster node number specified by Name is very large. Therefore, some D-Bus data structures, such as Name, exhaust and cause this issue.
Implementation of the D-Bus mechanism depends on the dbus-daemon component. If D-Bus data structures are exhausted, restart the daemon to solve the issue. However, the issue is not so simple. After the dbus-daemon component is restarted, the issue persists.
In the preceding figure where strace is used to trace runC, runC data writing is blocked at the bus with the org.free field. In the bus list output of the busctl command, the buses with the field are used by Systemd.
Then, if you run the systemctl daemon-reexec command to restart Systemd, the issue disappears. Thus, it is determined that the issue might relates to Systemd.
Systemd is a very complex component, especially for those who have not done any development work. Basically, there are four methods to troubleshoot the issue of Systemd, including debug logs, core dump, code analysis, and live debugging.
Let's find out the cause of the issue according to debug logs, code analysis, and live debugging, starting with the useless core dump.
This issue indicates that runC does not respond when using D-Bus and Systemd for communication, and is solved upon Systemd restart. Therefore, first, check whether any key threads related to Systemd are locked. Check all threads in the core dump.
Only the following thread is used but it is not locked. It is waiting for the D-Bus event to respond.

Run the busctl tree command to output the exposed interfaces of all buses. According to the output, the org.freedesktop.systemd1 bus cannot respond to the interface query request.
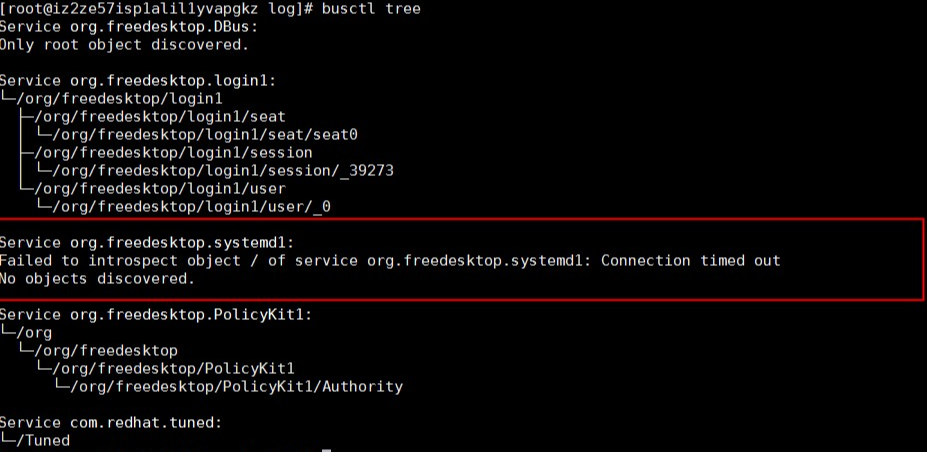
Run the following command to check all requests received on org.freedesktop.systemd1. You will see a message indicating a large number of unit creation and deletion operations in a normal system but no message on the bus in a faulty system.
gdbus monitor --system --dest org.freedesktop.systemd1 --object-path /org/freedesktop/systemd1
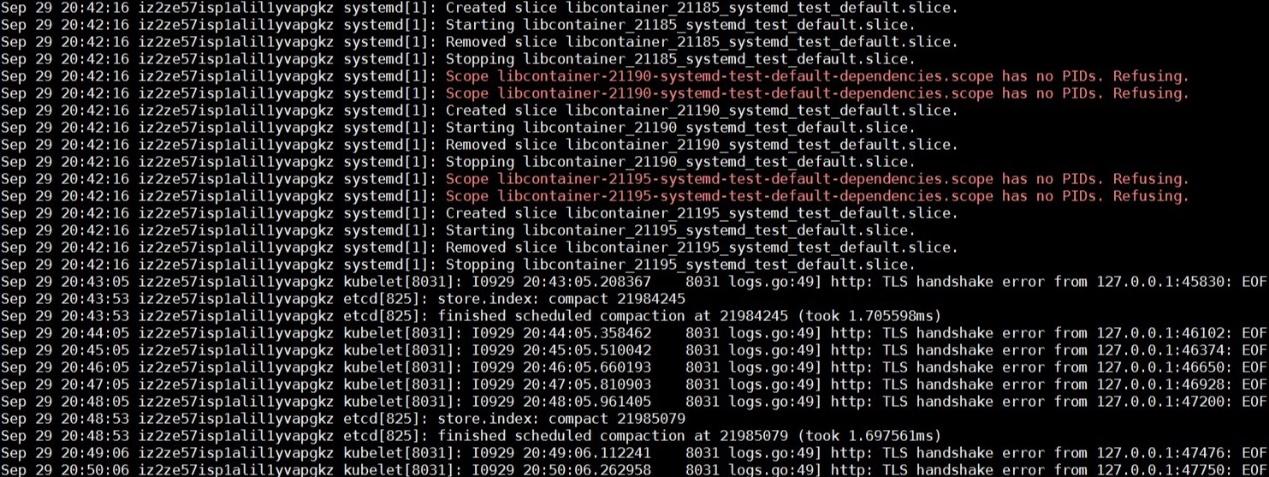
By analyzing system logs before and after the issue occurs, it is visible that runC repeatedly runs the libcontainer_%d_systemd_test_default.slice test. The test is very frequent but stops when the issue occurs. Therefore, the issue may have a lot to do with the test.
Additionally, Systemd reports the "Operation not supported" error while running the systemd-analyze command to access the debug logs of Systemd.
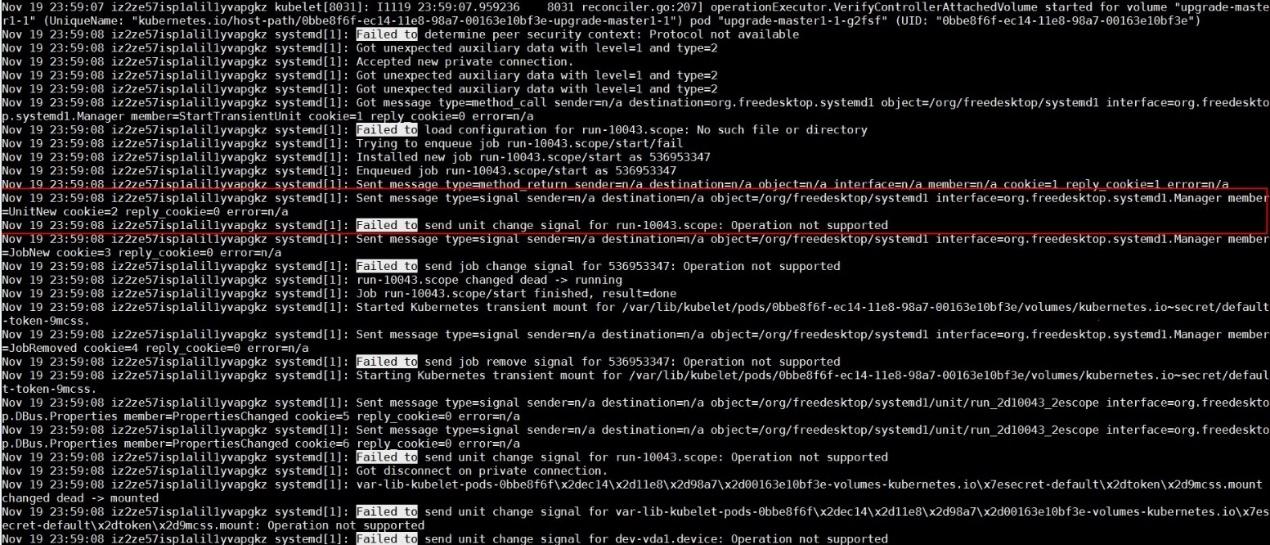
According to the preceding scattered information, it is concluded that the org.freedesktop.systemd1 bus does not respond after a large number of unit creation and deletion operations. During frequent unit creation and deletion operations, a checkin of runC rewrites the UseSystemd function to test whether some functions of Systemd are available. The UseSystemd function is called in many situations, such as while creating a container or viewing container performance.
This issue occurs in all online Kubernetes clusters at a frequency of about twice a month. The issue persists and can be solved by restarting Systemd only after the issue occurs, which is highly risky.
You can submit bugs to the Systemd and runC communities respectively. However, they do not have an online environment like Alibaba Cloud, and the probability of reproducing this issue is almost zero. Therefore, you cannot count on the communities to solve this issue rather strive to solve the tough issue by yourself.
At the end of the preceding section, Systemd reports the "Operation not supported" error when the issue occurs. This error seems to be totally unrelated to the issue but it is the closest point to the issue. Therefore, let's find out why the error is reported. The amount of Systemd code is large, and this error might be reported in many positions.
With the customer's consent, download the Systemd debugging symbol, attach Cloud Graph Database (GDB) to Systemd, execute breakpoints under the suspicious function, and continue the execution.
After multiple instances of verification, it is observed that Systemd steps into EOPNOTSUPP in the sd_bus_message_seal function and reports the error.
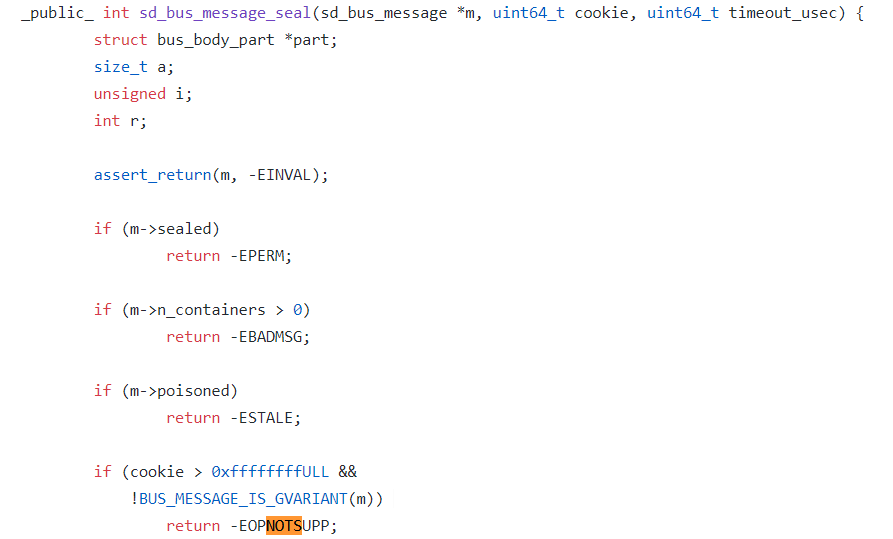
The error is reported because Systemd uses the cookie variable to track all D-Bus messages it processes. When adding a new message each time, Systemd first increases the cookie value by one and then copies the cookie value to the new message.
When using GDB to print the cookie value, it is observed that the value is greater than 0xffffffff. Therefore, it seems that this issue is caused by a 32-bit overflow of the cookie value and a new message adding failure after too many messages are added by Systemd.

In addition, to prove the conclusion, use GDB to set the cookie value close to 0xffffffff in a normal system and then observe that the issue occurs upon overflow of the cookie value.
Install GDB and Systemd on the faulty node, run the gdb /usr/lib/systemd/systemd 1 command to attach GDB to Systemd, set breakpoints in the sd_bus_send function, and then continue the execution.
After Systemd breaks in the breakpoints, run the p /x bus->cookie command to view the corresponding cookie value.
If the value is greater than 0xffffffff, the cookie overflows. In this case, the node enters the NotReady state. After confirmation, run the quit command to detach the debugger.
Fixing this issue is not so straightforward. One of the reasons is that Systemd uses the same cookie variable to be compatible with dbus1 and dbus2. For dbus1, the cookie value is 32-bit. This value will certainly overflow after frequent unit creation and deletion by Systemd for three to five months. For dbus2, the cookie value is 64-bit. This value never overflows.
Another reason is that we cannot turn back the cookie value to solve the overflow issue. If we turn back the cookie value, Systemd may use the same cookie value to add different messages, which is disastrous.
The final solution is to use the 32-bit cookie value for both dbus1 and dbus2. In addition, after the cookie value reaches 0xfffffff, the next cookie value is 0x80000000. The highest bit is used to indicate that the cookie is in the overflow state. When the cookie is in this state, check whether the next cookie is being used by other messages to prevent cookie conflicts.
The issue considered in this article is caused by Systemd. However, the UseSystemd function of runC uses a poor method to test Systemd functions. During the management process of the entire container lifecycle, frequent triggering of the function causes the low-probability issue to occur. Systemd troubleshooting is accepted by Red Hat.
We expect to solve this issue by upgrading Systemd in the near future. Refer to this page for recent updates.
From Confused to Proficient: Analysis of Failure to Delete a Kubernetes Cluster Namespace

2,593 posts | 793 followers
FollowAlibaba Clouder - December 19, 2019
Alibaba Clouder - December 19, 2019
Alibaba Clouder - December 19, 2019
Alibaba Clouder - December 19, 2019
Alibaba Clouder - December 19, 2019
Alibaba Clouder - December 19, 2019

2,593 posts | 793 followers
Follow ECS(Elastic Compute Service)
Elastic and secure virtual cloud servers to cater all your cloud hosting needs.
Learn More Container Service for Kubernetes
Alibaba Cloud Container Service for Kubernetes is a fully managed cloud container management service that supports native Kubernetes and integrates with other Alibaba Cloud products.
Learn More Container Registry
A secure image hosting platform providing containerized image lifecycle management
Learn MoreMore Posts by Alibaba Clouder