With the booming development of mobile smart devices, a mobile multi-terminal development framework has become a general trend. Download the Flutter Analysis and Practice: Evolution and Innovation of Xianyu Technologies eBook for step-by-step analyses based on real-life problems, as well as clear explanations of the important concepts of Flutter.
The project development system focuses on the following points:
flutter_tools and the Flutter plug-in for IntelliJ IDEA.)flutter_tools operations and improve the stability and flexibility of debugging.As shown in Figure 1-1, in this project development system, developers can obtain engine dependencies and make appropriate modifications based on the official Flutter repository to meet the customization requirements. After developing each module, publish it to a private pub repository, which can be depended and integrated in business code though pubspec.yaml. During building, compile Dart code into a product (App.framework or Snapshot) and integrate it into an iOS App Store Package (IPA) as a standard iOS pod dependency or as an Android Package Kit (APK) as an Android Gradle dependency. Native developers do not need to focus on Flutter details. Flutter developers can start the Flutter project for debugging or access the Flutter page and use Dart remote connection for debugging after the native project is started (Observatory monitoring starts.)
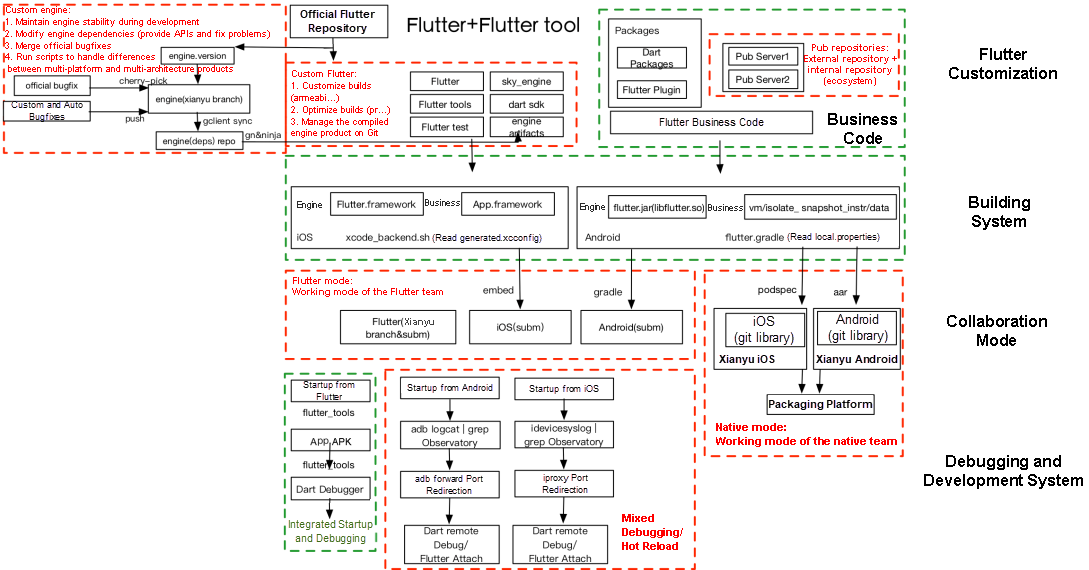
Figure 1-1
The core logic is how to run Flutter with minimal changes to the existing iOS or Android projects. As shown in Figure 1-2, Flutter can serve as a module. It can be embedded into the main project of your existing Android app piecemeal, as a source code Gradle subproject or as an AAR. For the main project of your existing iOS app, Flutter can be embedded as a CocoaPods dependency or iOS pod library.
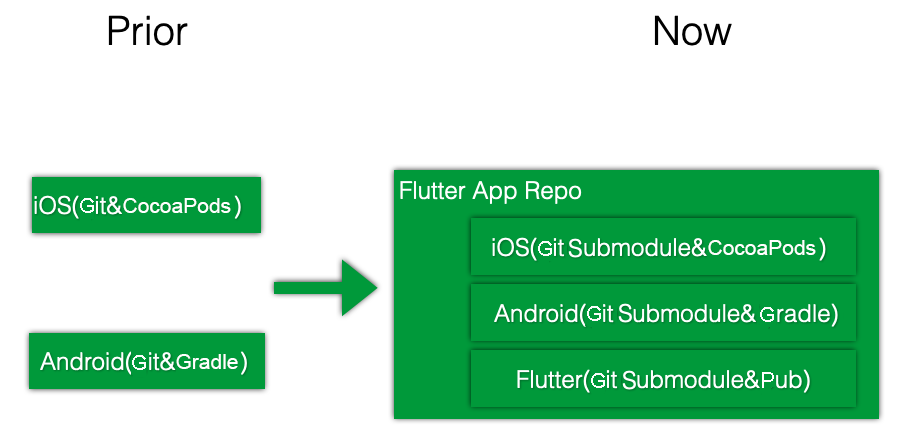
Figure 1-2
Problem: The Android project is slowly built when it is started in Flutter.
Cause: In the logic of flutter_tools, when android/app/build.gradle is not found, gradle builds other than gradle assembleDebug is run to build multiple configurations.
Solution: Rebuild the Android project so that build.gradle of the project module is in the android/app directory, to match the logic of flutter_tools.
The debugging method of flutter_tools is:
1) Modify flutter_tools.dart to enable parameter printing.
import 'package:flutter_tools/executable.dart' as executable;

void main(List<String> args) {
  print('[KWLM]:${args.join(' ')}');
  executable.main(args);
}
2) Delete flutter/bin/cache/fluttertools.stamp so flutter_tools can be rebuilt.
  # Invalidate cache if:
  #  * SNAPSHOT_PATH is not a file, or
  #  * STAMP_PATH is not a file with nonzero size, or
  #  * Contents of STAMP_PATH is not our local git HEAD revision, or
  #  * pubspec.yaml last modified after pubspec.lock
  if [[ ! -f "$SNAPSHOT_PATH" || ! -s "$STAMP_PATH" || "$(cat "$STAMP_PATH")" != "$revision" || "$FLUTTER_TOOLS_DIR/pubspec.yaml" -nt "$FLUTTER_TOOLS_DIR/ pubspec.lock" ]]; then
    rm -f "$FLUTTER_ROOT/version"
    touch "$FLUTTER_ROOT/bin/cache/.dartignore"
    "$FLUTTER_ROOT/bin/internal/update_dart_sdk.sh"
    VERBOSITY="--verbosity=error"

    echo Building flutter tool...
    if [[ "$CI" == "true" || "$BOT" == "true" || "$CONTINUOUS_INTEGRATION" == "true" || "$CHROME_HEADLESS" == "1" ]]; then
      PUB_ENVIRONMENT="$PUB_ENVIRONMENT:flutter_bot"
      VERBOSITY="--verbosity=normal"
    fi
    export PUB_ENVIRONMENT="$PUB_ENVIRONMENT:flutter_install"

    if [[ -d "$FLUTTER_ROOT/.pub-cache" ]]; then
      export PUB_CACHE="${PUB_CACHE:-"$FLUTTER_ROOT/.pub-cache"}"
    fi

    retry_upgrade

    "$DART" $FLUTTER_TOOL_ARGS --snapshot="$SNAPSHOT_PATH" --packages= "$FLUTTER_TOOLS_DIR/.packages" "$SCRIPT_PATH"
    echo "$revision" > "$STAMP_PATH"
  fi
3) Build a flutter_tools project in Flutter and obtain its input parameters.
Building flutter tool...
[KWLM]:--no-color run --machine --track-widget-creation --device-id= GWY7N16A31002764 --start-paused lib/main.dart
Running "flutter packages get" in hello_world...                    0.4s
Launching lib/main.dart on MHA AL00 in debug mode...
Initializing gradle...
Resolving dependencies...
4) Use IntelliJ IDEA (or Android Studio) to start the flutter_tools project, create the Dart Command Line App, and configure Program arguments based on the input parameters obtained in Step (3), as shown in Figure 1-3.
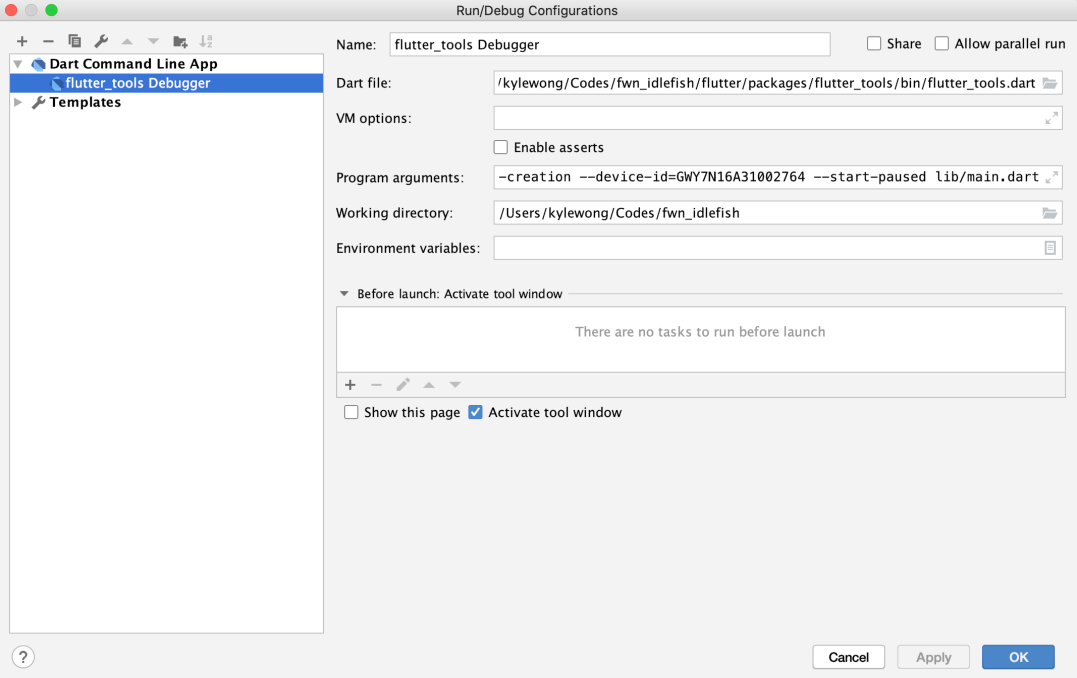
Figure 1-3
5) Start to debug the flutter_tools project, as shown in Figure 1-4.
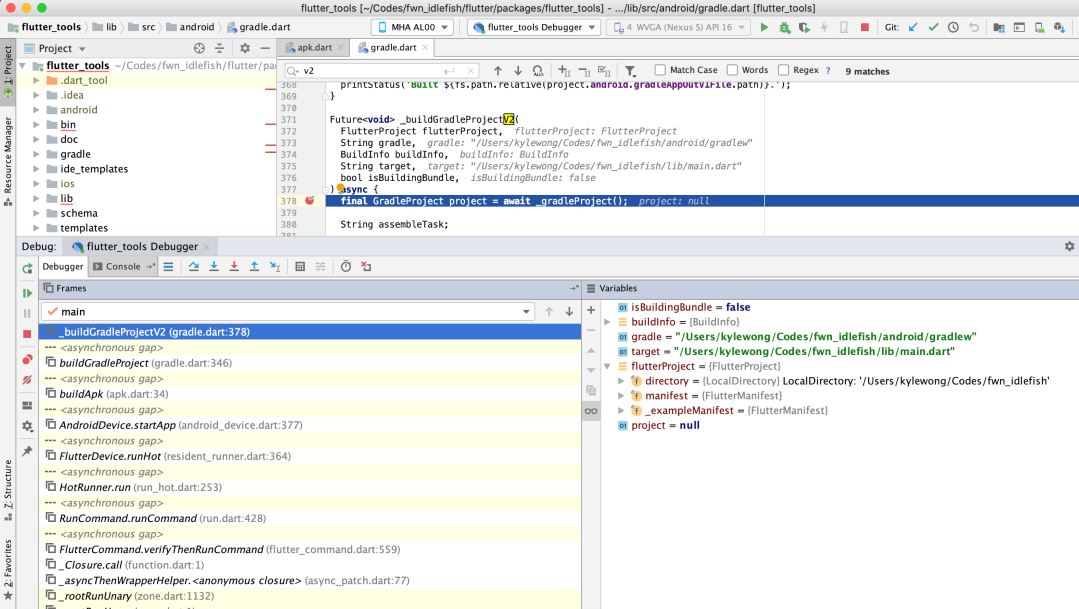
Figure 1-4
In Flutter mode, the Flutter plug-in runs the xcodebuild command to build an iOS project or the Gradle script to build an Android project. For developers with the native background, this method is not suitable and causes repeated compilation due to parameters problems of commands, such as xcodebuild. This is especially complicated for a large native project. To solve this problem, we can debug and hot reload the project in Flutter either when it is started in Flutter or the native environment, as shown in Figure 1-5.
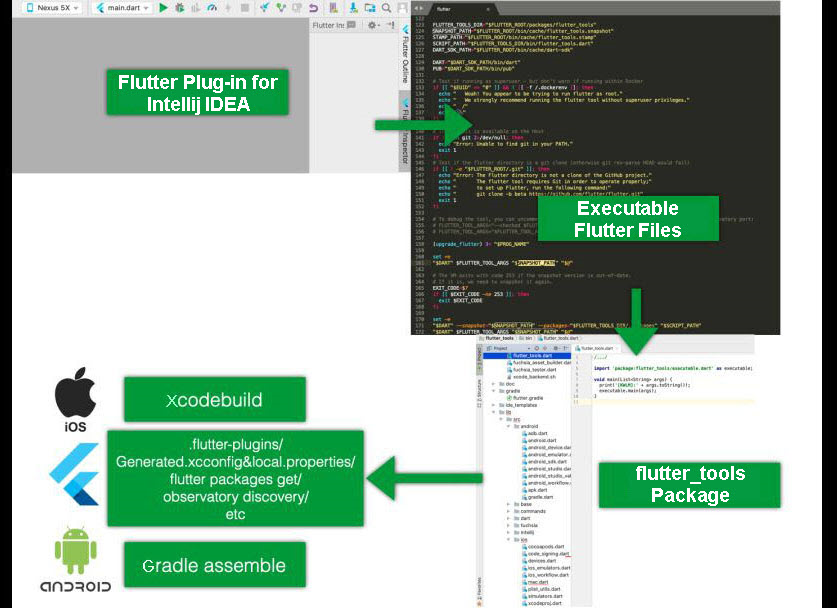
Figure 1-5
In fact, when the native project is configured with Flutter support and is started in Flutter, the main work to be done is:
flutter_tools.snapshot needs to be regenerated.pubspec.yaml and generate the plug-in description files flutter-plugins and pubspec.lock.Generated.xcconfig file for iOS and the local.properties file for Android based on Flutter configurations, such as the framework path, debug. or release mode, and whether to enable Dart 2.xcodebuild.If Dart debugging and hot reload upon native startup can be implemented, the slow compilation caused by flutter_tools and the unstability of the debugging environment can be solved. When starting an iOS app that contains Flutter content in debug mode in Xcode (or the Android app in Android Studio), follow steps (1), (2), (3), (6), and (7). Repeat steps (1), (2), and (3) only when the configurations of flutter_tools, pubspec.yaml, or Flutter are modified. Steps (6) and (7) are required for development personnel to complete the debugging and hot reload. We need to consider how to support them in this mode.
Locate the Observatory port on an iOS device. Run the idevicesyslog command to obtain the required command line. This involves the libimobiledevice library, including the idevicesyslog and iproxy commands.
kylewong@KyleWongdeMacBook-Pro ios % idevicesyslog | grep listening
Aug 26 14:07:18 KyleWongs-iPhone Runner(Flutter)[686] <Notice>: flutter: Observatory listening on http://127.0.0.1:56486/oB7rB0DQ3vU=/
The Observatory on the iOS device starts port x (with a random port number) and the authentication code is y.
Run the iproxy command to map port x on the iOS device to the local port z.
kylewong@KyleWongdeMacBook-Pro ios % iproxy 8101 56486 your-ios-device-uuidThe "waiting for connection" message is displayed. Then, you can visit http://127.0.0.1:z/ y/#/vm and access the Observatory, as shown in Figure 1-6.
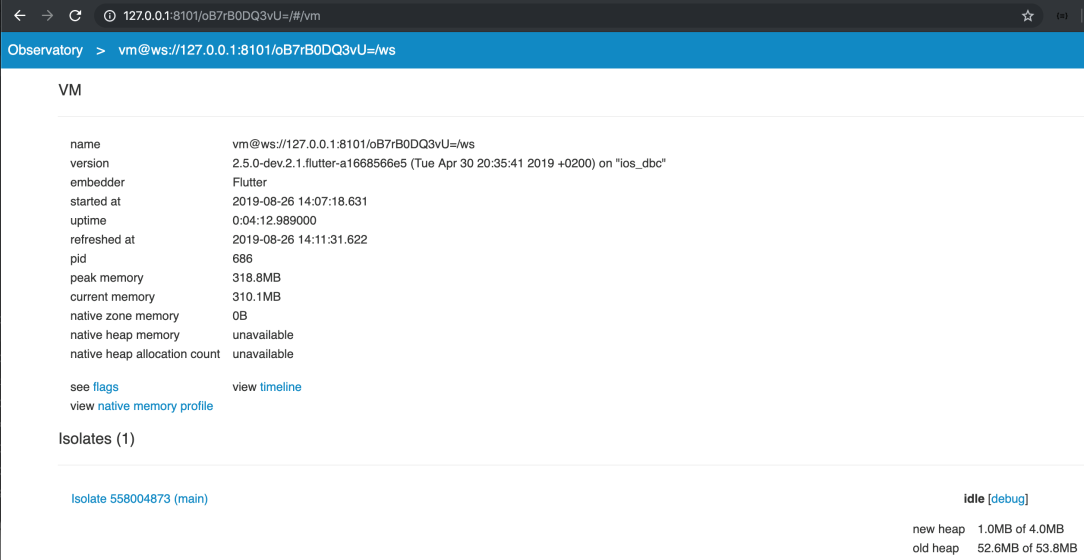
Figure 1-6
You can use the Observatory to check Dart-related memory and debugging information.
You can also use the IDE link to debug and configure Dart Remote Debug, as shown in Figure 1-7.
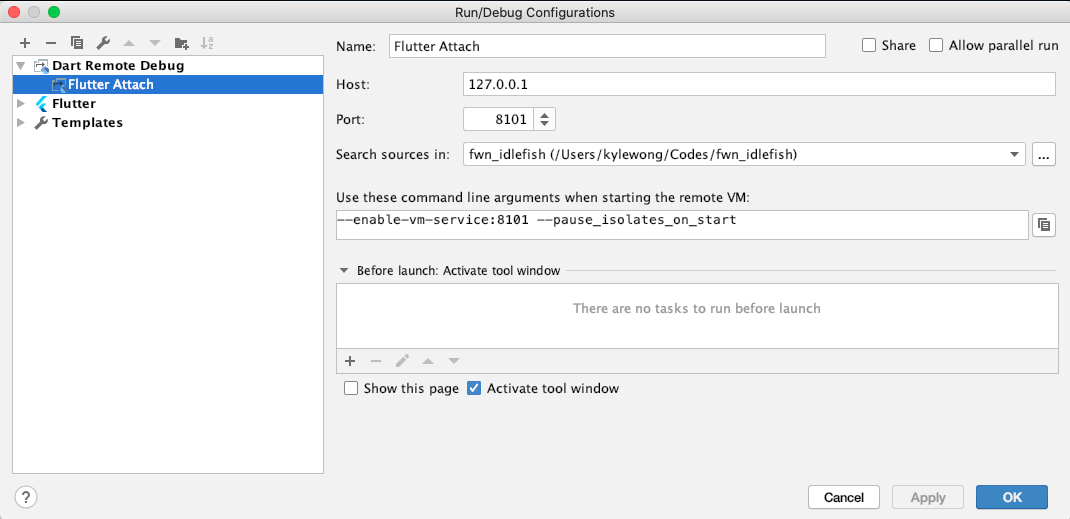
Figure 1-7
Be sure to use port z that was just forwarded to the device and search the root directory of the Flutter project for source code.
To avoid a connection failure due to the authentication code, '--disable-service-auth-codes' must be passed during app startup.
After Dart Remote Debug is configured, click the debug button to connect to the debug port, as shown in Figure 1-8.

Figure 1-8
After the operation succeeds, "Connected" is displayed on the Debugger tab. If it is not displayed, click the debug button again, as shown in Figure 1-9.
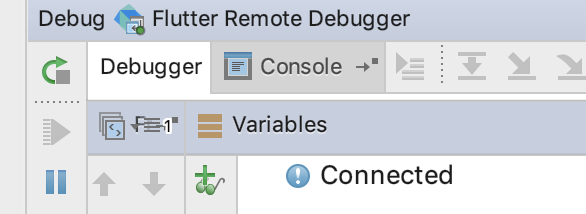
Figure 1-9
Then, you can use the IDE to set breakpoints and debug Dart (Flutter) code, as shown in Figure 1-10.
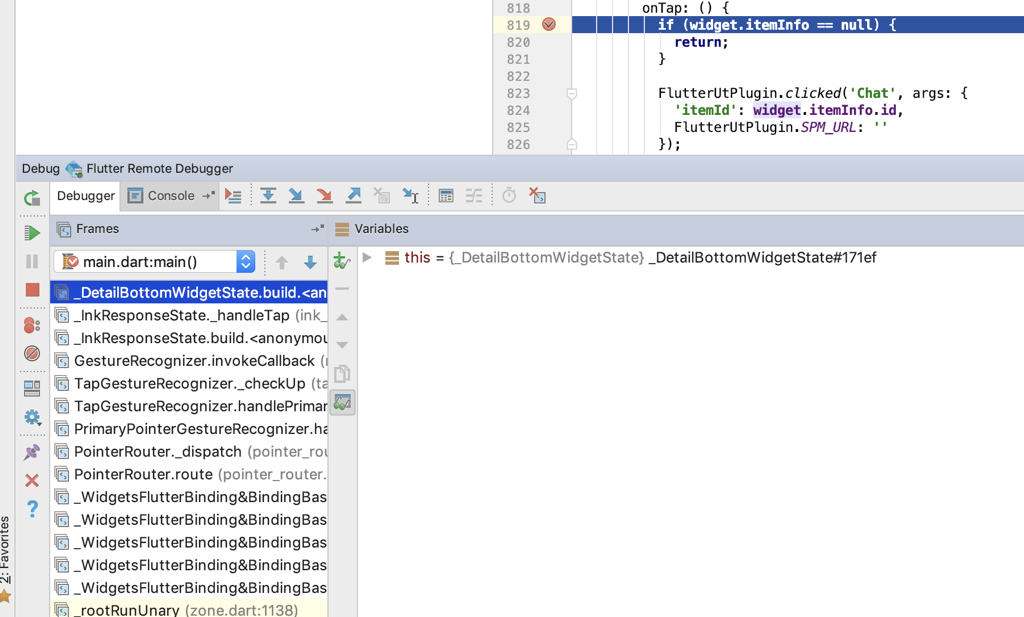
Figure 1-10
Start the app. On the Flutter page, locate the Observatory port x and authentication code y.
In the directory of the Flutter project, run the flutter attach --debug-uri=http:// 127.0.0.1:x/y/ command.
kylewong@KyleWongdeMacBook-Pro fwn_idlefish % flutter/bin/flutter attach --debug-uri=http://127.0.0.1:63515/2T0iU5TV0As=/
[KWLM]: [attach, --debug-uri=http://127.0.0.1:63515/2T0iU5TV0As=/]
Syncing files to device KyleWong's iPhone...

🔥 To hot reload changes while running, press "r". To hot restart (and rebuild state), press "R".
An Observatory debugger and profiler on KyleWong's iPhone is available at: http://127.0.0.1:63515/2T0iU5TV0As=/
For a more detailed help message, press "h", To detach, press "d"; to quit, press "q".
Modify Dart source code, and enter r on the device (following 'to quit,press"q"').
      new Padding(
        padding: new EdgeInsets.only(left: 22.0),
        child: createButton(
            videoIsFullScreen,
            {
              'foreground': 'fundetail_superfavor_white',
              'background': 'super_favor_unhighlight'
            },
            'super_favor_highlight',
            '赞',
            buttonSelectedStatus['superfavor'], () {
          superLikeComponent.clickV2(widget.itemInfo.itemId, widget.itemInfo.userId, widget.itemInfo.fishPoolId,
              widget.itemInfo.superFavorInfo.superFavored, widget.itemInfo.trackParams);
        }),
      )
Here, "Superb" is changed to "Like." "Initializing hot reload...Reloaded..." is displayed on the device. After the operation is completed, modification on the device takes effect and the text in the lower-left corner becomes "Like," as shown in Figure 1-11.
The debugging and hot reload of Android projects in Flutter are similar, but for Android, you can run IDE Logcat or ADB Logcat | grep Observatory to obtain the port number and run ADB forward to forward the port.

Figure 1-11
Your app can be debugged in Flutter at any time after startup. You can also run the Attach Debugger to the Android Process of Android Studio to debug an Android app, implementing the joint debugging of Android and Flutter. Similarly, you can run the Attach to Process of Xcode to implement joint debugging of iOS and Flutter.
The Xianyu team has native developers and Flutter developers, so they make development separately in Flutter mode and native mode. The Flutter environment has been installed on a public device (Mac Mini) for Flutter-related building. The compiled Flutter projects are integrated into a native project (Flutter-related code is considered as a module) as an AAR or a pod library. The Continuous Integration (CI) platform used to build the final APK or IPA also integrates and packages Flutter as a compiled product.
Xianyu's Flutter Image Optimization: From Native Code to Advanced Technology
Flutter Analysis and Practice: Hybrid Project Transformation

56 posts | 4 followers
FollowXianYu Tech - September 11, 2020
XianYu Tech - September 11, 2020
XianYu Tech - September 2, 2020
XianYu Tech - September 9, 2020
XianYu Tech - September 10, 2020
XianYu Tech - September 7, 2020

56 posts | 4 followers
Follow mPaaS
mPaaS
Help enterprises build high-quality, stable mobile apps
Learn More Mobile Testing
Provides comprehensive quality assurance for the release of your apps.
Learn More Alibaba Cloud Flow
An enterprise-level continuous delivery tool.
Learn More DevOps Solution
Accelerate software development and delivery by integrating DevOps with the cloud
Learn MoreMore Posts by XianYu Tech