By Xiaosheng Song, Senior middleware engineer of Yiqianbao
Apache Dubbo 3 has undergone a significant upgrade in terms of cloud-native observability. To utilize the latest version of Dubbo 3, simply introduce the dubbo-spring-boot-observability-starter dependency. Microservice clusters will possess the following capabilities:
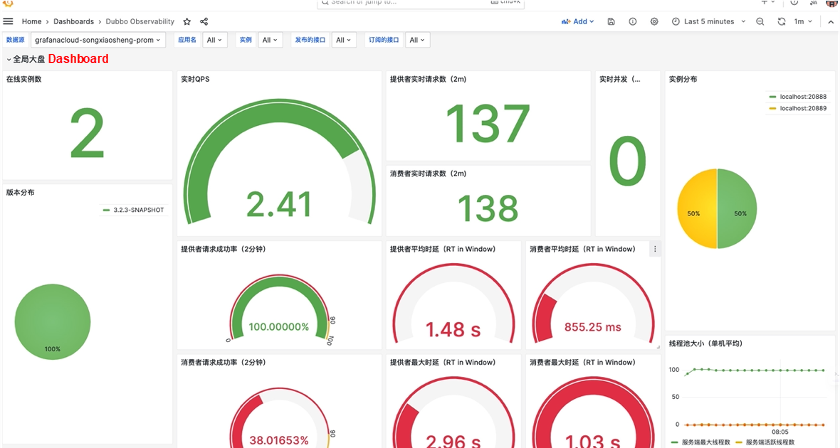
Dubbo 3.2's latest version enables you to observe the operational status of an application, a single server, or a specific service at various granularities. This includes monitoring qps, rt, thread pool, and error classification statistics.
In the latest version of Dubbo 3.2, a built-in link filter is utilized to collect link data from RPC requests. Once collected, the link data is exported to major vendors through the exporter.
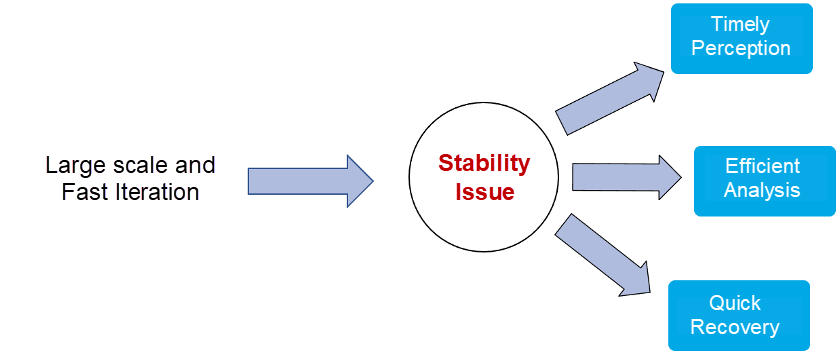
To ensure high-quality delivery, it is essential to utilize DevOps for development and testing efficiency and quality, followed by adopting cloud-native practices for efficient operations and deployment. However, the frequent changes and system stability issues during large-scale and rapid iterations cannot be overlooked. These issues include downtime, network and system exceptions, and various unknown problems. Leveraging observable systems can help timely detect problems, efficiently analyze exceptions, restore systems quickly, proactively address known issues, and uncover unknown problems, thereby significantly improving operational stability. Hence, it becomes imperative to build a comprehensive observable platform to detect both known and unknown exceptions and enhance system stability.
Directly constructing a large and complete observable system contradicts Dubbo's fundamental purpose as a microservice RPC (Remote Procedure Call) framework. However, Dubbo can provide fundamental monitoring data to assist enterprises in building their own observable systems. In contrast to traditional single-dimensional monitoring, observability emphasizes data correlation and holistically analyzes problems from both single-dimensional and multi-dimensional perspectives. Starting with the three key pillar metrics, Dubbo offers multi-dimensional aggregated and non-aggregated metrics to facilitate quick problem identification and diagnosis. These multi-dimensional metrics can be associated with the link system using label information such as applications and hosts. The link system provides performance and exception analysis at the service request level. Dubbo connects with various link manufacturers by providing link facades. After trace analysis, detailed logs can be traced using link data, including TraceId, SpanId, and other custom data. In these logs, Dubbo provides developers and operations personnel with a range of expert suggestions and error codes for rapid problem diagnosis and localization.
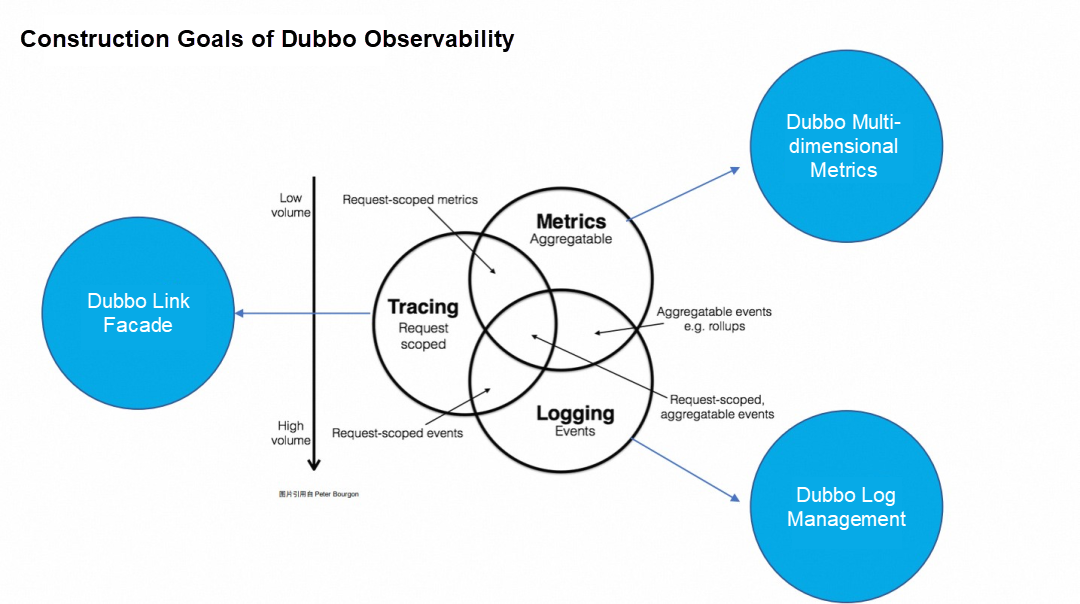
Dubbo's construction of a multi-dimensional metric system can be viewed from both vertical and horizontal perspectives. Vertically, Dubbo provides a simple facade for accessing metrics. It stores the collected metrics in a memory metric container and performs aggregation calculations based on the metric type. Finally, Dubbo exports the metrics to different metric systems. Horizontally, the collection dimension encompasses scenarios prone to problems, such as RPC request links, interactions between the three centers, and thread resource usage.
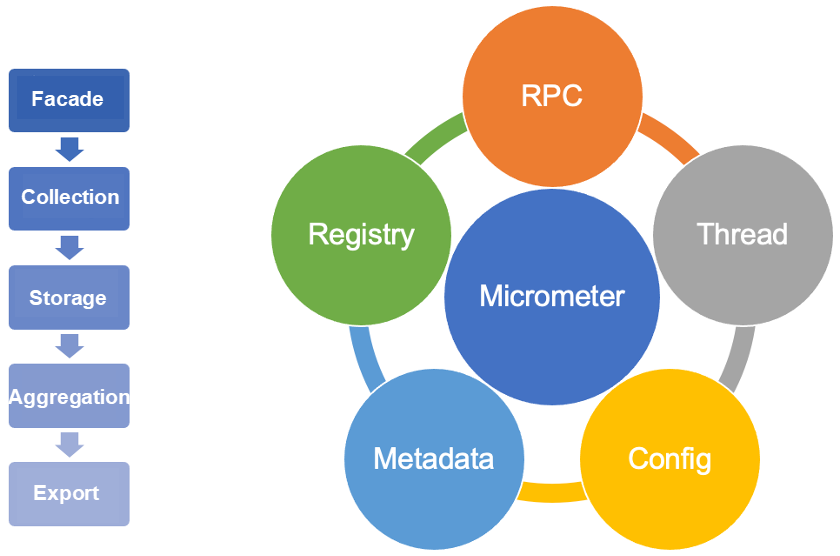
The previous section introduced the general metrics that should be collected, but what specific metrics should Dubbo collect? Below are some methodologies that Dubbo refers to when collecting metrics.
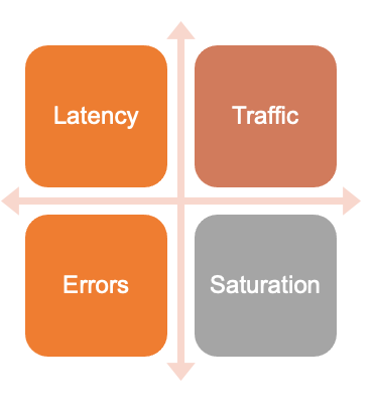
According to Google SRE (Site Reliability Engineering) book: Based on extensive experience in distributed monitoring, Google proposes four golden metrics (latency, traffic, errors, and saturation) that help measure issues at the service level, including end-user experience problems, service interruptions, and business impact.
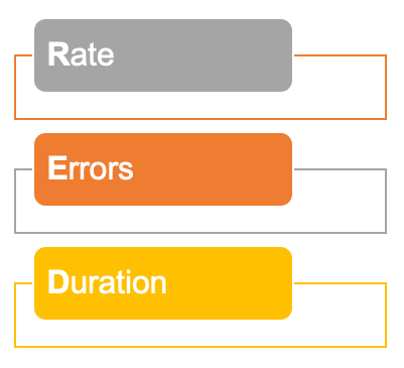
The RED method (from Tom Wilkie) focuses on the request, the actual work, and the external perspective (i.e., the perspective from the service consumer). It includes rate, error, and duration.
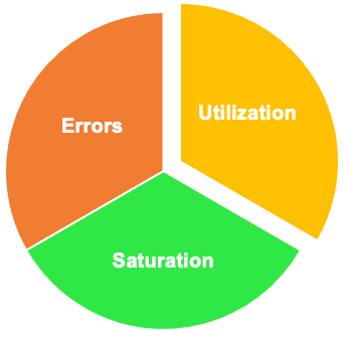
The USE method (from Brendan Gregg) focuses on the internal resource. It includes utilization, saturation, and errors.
Multi-dimensional metric system has been released and kept updating in Dubbo 3.2 and later. Users only need to introduce a dependency:
<dependency>
    <groupId>org.apache.dubbo</groupId>
    <artifactId>dubbo-spring-boot-observability-starter</artifactId>
    <version>3.2.x</version>
</dependency>
After the dependency is introduced, some key metrics are enabled by default. By accessing the service port 22222 and the metrics path of the current service in the command line, you can obtain the metric data. The port 22222 is the service quality provided by Dubbo, and the health management port can be modified through the QOS configuration.

The queried Dubbo metrics are displayed in the following naming format: dubbo_type_action_unit_otherfun.
Users may also directly use the SpringBoot management port. For this scenario, Dubbo has made automatic adaptations to make SpringBoot export metric data in Prometheus format, as shown in the following configuration:

When you access the SpringBoot management port to query metric data, you can see that some built-in metrics of SpringBoot are displayed to users together with some metrics provided by Dubbo.
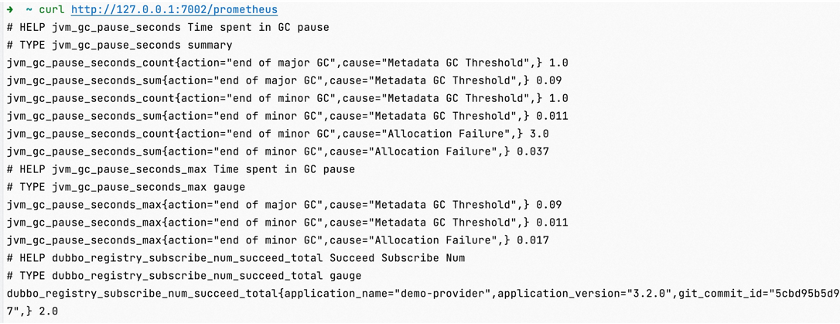
When accessing the metric service through the curl command, only instantaneous metric data is obtained. However, for metric data, we often require time-ordered vector data. In such cases, Prometheus can be used to externally collect and store Dubbo metrics. For services deployed on physical or virtual machines in a traditional manner, static metric discovery services based on files or self-built CMDB (Configuration Management Database) systems can be utilized. Additionally, in the future, the service discovery service provided by Dubbo Admin can also be employed for the metric system. For systems deployed in Kubernetes, the built-in service discovery supported by Kubernetes can be directly used to access Prometheus for automatic collection. The configurations are as follows:
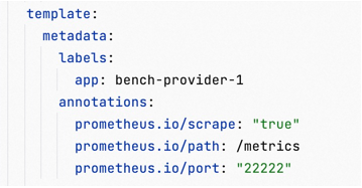
The query metrics in Prometheus are as follows:
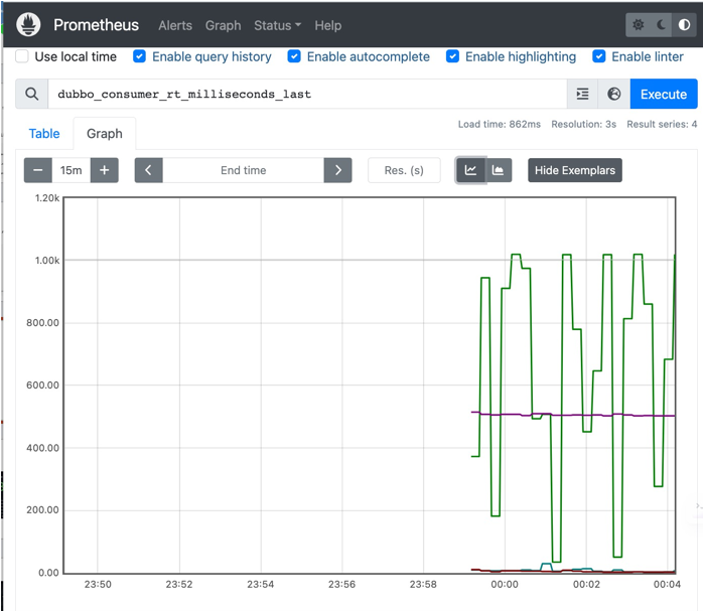
Prometheus primarily focuses on collecting and storing metrics, making its metric display capabilities relatively limited. In contrast, Grafana offers a wide range of metric panels. It is more intuitive and easier to use Grafana for building a comprehensive metric dashboard. The image below demonstrates the capability of applying multi-dimensional filtering, allowing queries on service data at the application, instance, and interface levels. The metric monitoring dashboard includes various dimension metrics based on the previously mentioned metric methodology, such as traffic, request count, latency, errors, and saturation. Additionally, it provides application and instance information, such as distribution of Dubbo versions and instances.

The user access provided by the Agent is simple, but dynamically modifying bytecode to offer support carries certain risks. It may seem excessive for an agent to solely perform the Dubbo layer's linking function. Dubbo, as a microservice RPC framework, is better suited for a more general-purpose linking facade. Each field has its own expertise, and Dubbo simplifies user access by adapting to various full link systems.

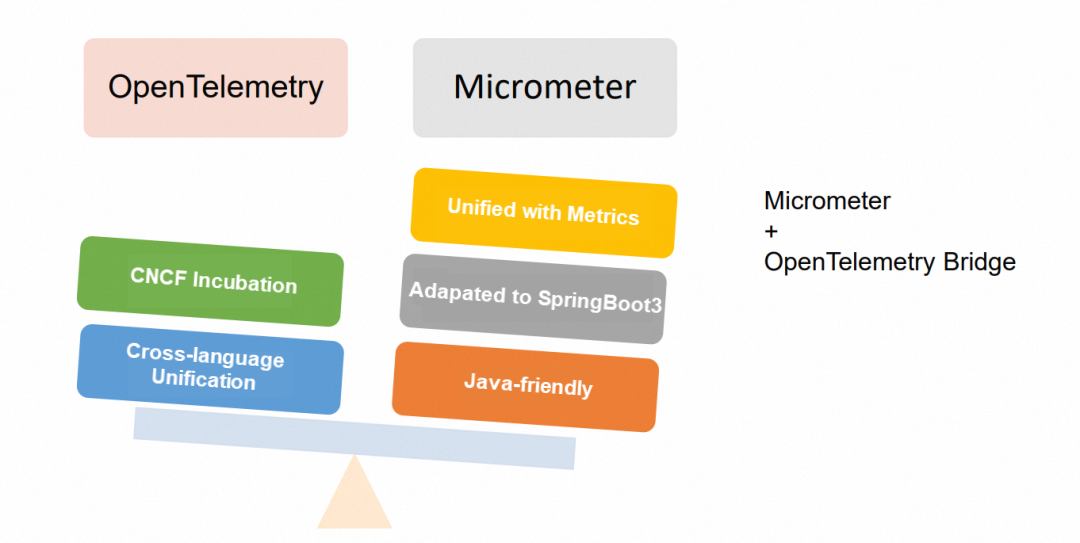
The commonly used OpenTelemetry tracing analysis facade leans towards unified specifications and supports major manufacturers. It is also an incubation project of CNCF (Cloud Native Computing Foundation). Micrometer, on the other hand, has the advantage of sharing the same dependency source as the metric embedding point. It is more convenient to integrate user access by default in SpringBoot3. Additionally, Micrometer aligns with the positioning of the Dubbo link system construction as an observable facade and can serve as a bridge to OpenTelemetry.
| OpenTelemetry / OpenTracing | Micrometer | |
| Language | Heterogeneous. Support for multiple languages. | Only Java is supported, and spring-boot3 is integrated by default. |
| Trace | API with a unified standard | micrometer-tracing-bridge-otel can be converted to OT. |
| Third parties supported | Zipkin, Jaeger, SkyWalking, Prometheus and so on. | Use the bridge to connect to third parties. |
| Background | One of the CNCF incubation projects | An up-rising star |
| Document address | https://opentelemetry.io/docs/ | https://micrometer.io/docs |
Micrometer + OpenTelemetry Bridge:
Dubbo uses a built-in link filter to collect link data in RPC requests and then uses an exporter to export the link data to major manufacturers.

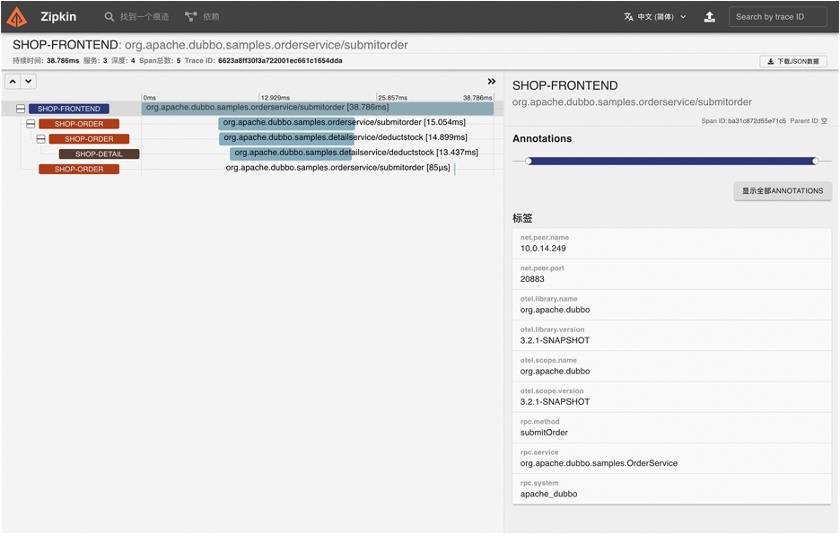
The Dubob tracing analysis facade has been released. To access the tracing analysis system, you only need to introduce the starter integration package of the corresponding tracing analysis and then configure it in a single piece. For more detailed access manuals, please refer to the documents and cases. [1]
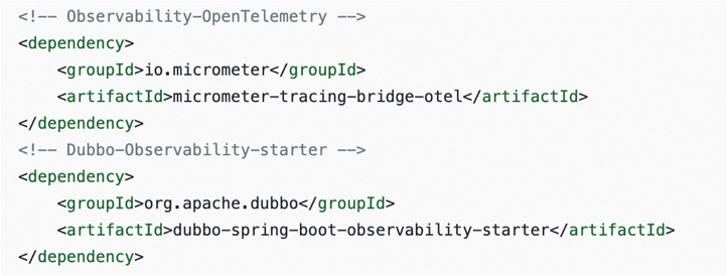
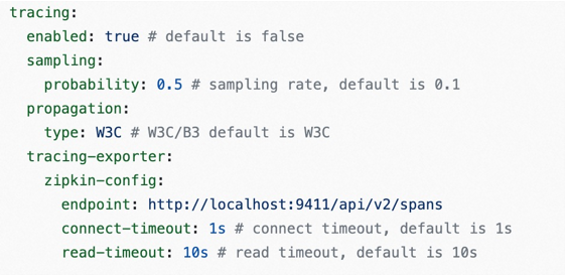
You can configure switches, sample rates, exporters, and other configurations in the tracing analysis configuration.
Finally, tracing analysis systems often need to associate link id with logs to analyze more detailed root causes. At this time, it is necessary to add log MDC printing configuration to the log configuration in advance, such as the acquisition of traceId and spanId.

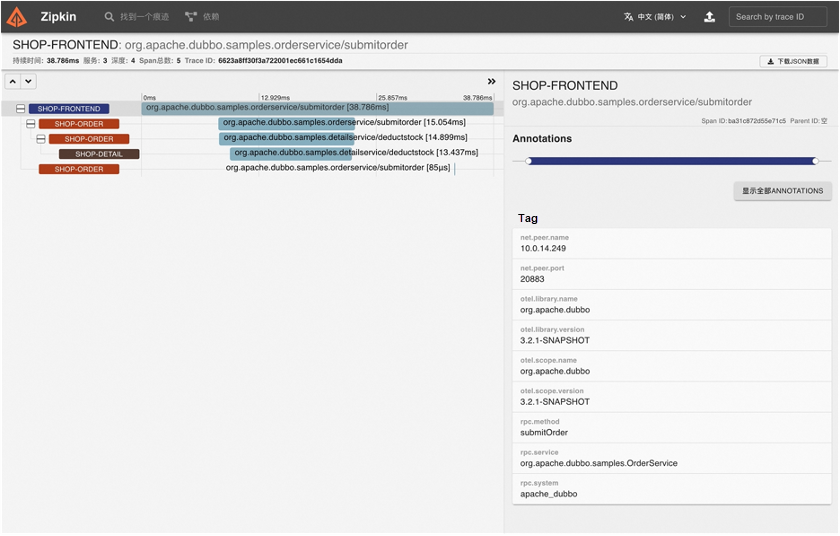
This picture shows that Dubbo accesses Zipkin to realize tracing analysis. You can see the performance and metadata of some interfaces.
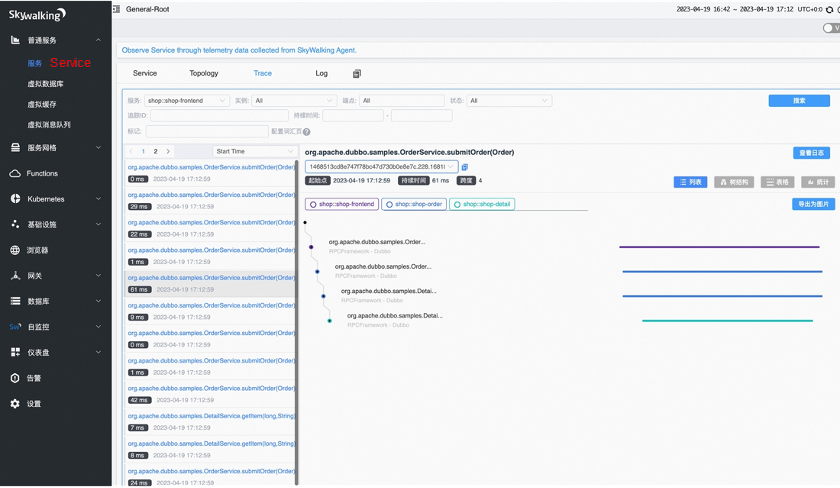
This picture shows that Dubbo accesses Skywalking to realize tracing analysis and the link analysis of the request level retrieved by the link id.
The Dubbo framework has been continuously developed over the years, and its functionality has expanded to include interactions with major centers and between clients and servers. However, these internal and external interactions are prone to exceptions. When encountering problems, relying solely on log observation can be confusing, and analyzing code to locate the root cause can be a daunting task.
The reason for the problem is unknown:

By carefully observing the logs printed by Dubbo 3.x, you will notice the presence of a problem assistance manual within the logs. When an issue arises, copying the provided link and opening it in a browser will display expert advice on troubleshooting steps for the specific abnormal log, as shown in the following example. As Dubbo continues to evolve, the expert recommendations will become increasingly detailed. Active participation from users and developers is crucial to perfecting the process. The Dubbo community encourages users and developers to contribute to its development.

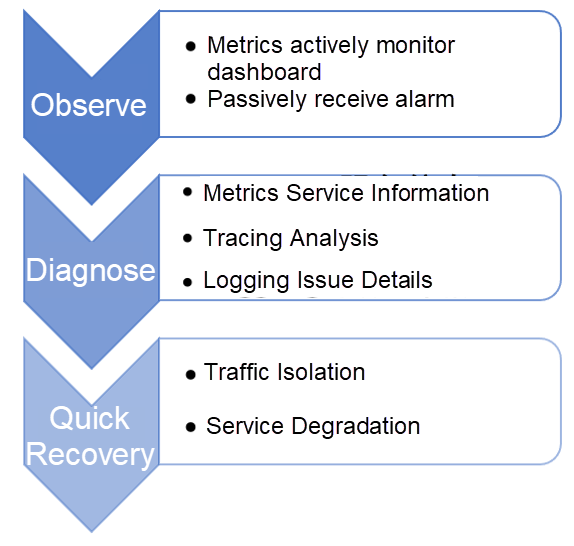
The final step involves implementing stability practices across the entire observability platform. During stability practices, the health status of services is monitored, and system problems are investigated and analyzed to quickly restore the system. On-duty personnel can actively observe the monitoring dashboard, analyze and raise alerts for exceptions, and receive passive notifications through emails, instant messages, SMS, or phone calls to promptly detect any observed system exceptions. When an abnormality is detected, it can be located by analyzing aggregated and non-aggregated service information using metrics. Further analysis can be performed at the service-level using the tracing analysis system. Detailed logs associated with the link information can be used to analyze the root cause of the exceptional context. Throughout the troubleshooting process, the entire observability platform must be utilized to swiftly restore the system, reducing losses through traffic isolation, service degradation, and other policies. Subsequently, the persistent information provided by the observability platform can be used to analyze exceptions and identify patterns in order to locate the root cause.
[1] Documents and Cases (in Chinese)
https://cn.dubbo.apache.org/zh-cn/overview/tasks/observability/tracing/
Resolving "Address not available" Issues in a Container Environment

706 posts | 57 followers
FollowAlibaba Cloud Community - May 12, 2022
Alibaba Container Service - September 13, 2024
Alibaba Developer - October 13, 2020
Alibaba Cloud Native Community - May 23, 2023
Alibaba Cloud Native Community - March 6, 2023
Alibaba Developer - February 4, 2021

706 posts | 57 followers
Follow Managed Service for OpenTelemetry
Allows developers to quickly identify root causes and analyze performance bottlenecks for distributed applications.
Learn More Simple Log Service
An all-in-one service for log-type data
Learn More Message Queue for Apache Kafka
A fully-managed Apache Kafka service to help you quickly build data pipelines for your big data analytics.
Learn More Cloud-Native Applications Management Solution
Accelerate and secure the development, deployment, and management of containerized applications cost-effectively.
Learn MoreMore Posts by Alibaba Cloud Native Community