
With the surge in popularity of distributed service architecture and the application of design architectures, especially the microservices architecture, the chain of service calls is becoming increasingly complicated.

As a common phenomenon, the separation of services produces more and more system modules with the possibility of different teams maintaining the different modules.
A single request may involve the co-processing of dozens of services and service systems from multiple teams. Also, we then come to how to locate online faults in a timely and accurate manner?
Or how to analyze relevant data effectively without a global caller ID?
These problems are particularly challenging for large website systems such as Taobao.
The typical distributed system request call procedure is as follows:
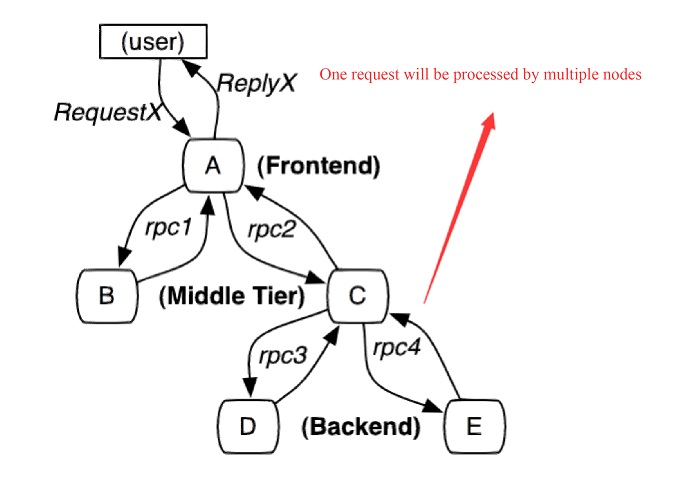
One of the mature solutions is to concatenate the complete request call procedure using the call chain to monitor the request call path.
Business scenarios of the call tracing system
1) Quick fault location
By tracking using the call chain, it is possible to display the logic trace of a single request completely and clearly.
By adding a call chain ID during development, we can quickly locate the fault using the call chain along with service logs.
2) Perform analysis of different call phases
By adding a call delay in different phases of the call chain, we can analyze system performance bottlenecks and perform targeted system optimization.
3) Availability of different call phases and the dependency of the persistent layer
By analyzing the average latency and QPS of different phases, we can find system weaknesses and improve certain modules such as data redundancy.
4) Data analysis
The call chain provides complete service logs. By analyzing these logs, we can learn about users' behavior routes and summarize the performance of user applications in various service scenarios.
(1) Design objectives of the distributed call tracing system
Minimum intrusion and transparency to applications:
As a non-service component, the system should minimize or avoid the intrusion to other service systems. It should be transparent to users to reduce developer workload.
Low-performance loss:
Service call tracking must feature low-performance loss, as applying the function can be the cause of performance loss.
In practice, one may set a sample rate to analyze the request paths of certain requests.
Extensive deployment and high scalability:
As one of the components of a distributed system, an outstanding call tracing system must support distributed deployment and feature high scalability.
(2) Tracking and log generation
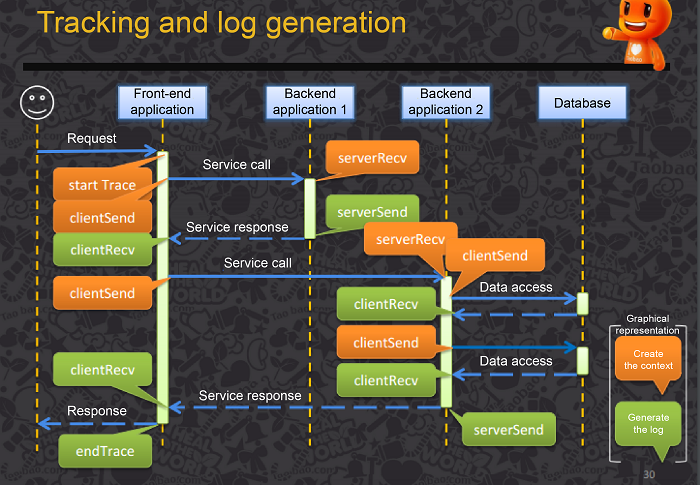
We undertake tracking to collect context information of the current node. Tracking types include client tracking, server tracking and client/server bidirectional tracking.
A tracking log normally contains the following items:
● TraceId, RPCId, call start time, call type, protocol type, caller IP address and port and name of the requested service;
● Call duration, call result, exception information and message text;
● Reserved extensible fields for future extension
(3) Log collection and storage
It is possible to use many open-source tools to collect and store logs. Generally, we store logs in an offline and real-time mode, which is a distributed log collection method.
One typical solution is to use Flume and Kafka together or other MQs.
(4) Analysis and summarization of call chain data
Dispersal of call chain logs occurs through the different servers that handle the call.
To collect call chain data, we need to summarize those logs by TraceId and organize, in an orderly manner, the call chain by RpcId.
It is not necessary that the call chain data is 100% accurate and part of intermediate logs can be missing.
(5) Calculation and display
After collecting the call chain logs from different application nodes, we can analyze these logs by service line. Then, specific logs need to be organized and stored in HBase or relational databases for visualized query.
Large Internet companies have their own distributed tracing systems, such as Dapper for Google, Zipkin for Twitter, Eagle Eye for Taobao, Watchman for Sina and Hydra for Jingdong.
Dapper is the distributed tracing system for Google production environments. Dapper’s design is such that it seeks to meet three objectives:
● Low impact: The impact of the tracing system on online services must be minimal
● Application-level transparency: The tracing system should be transparent to application developers. If the launch of a tracing system depends on developers taking the initiative to cooperate, this tracing system is too invasive.
● Scalability: The tracing system should be able to fully support the service and cluster expansion of Google over the next few years.
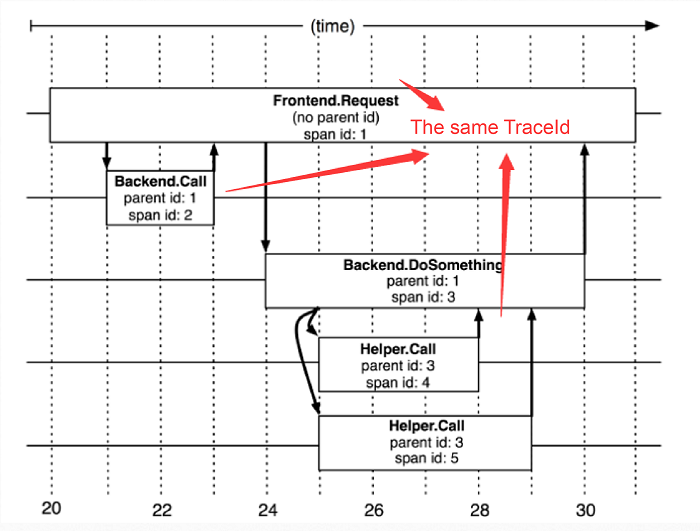
(1) Dapper uses spans to indicate the start and end time of a single service call, namely a time interval.
Dapper records span names and each span's ID and parent ID. If a span has no parent ID, we refer to as a root span. All spans are attached to a specific trace and share the same traceID, which is identified by a global 64-bit integer.
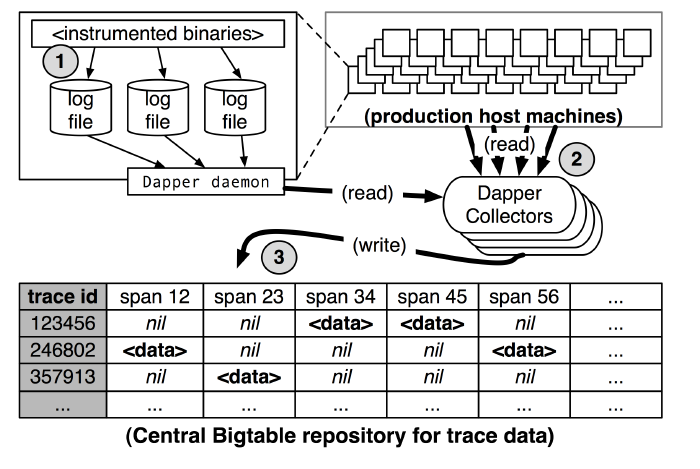
Dapper tracing and collection consist of 3 phases:
1) Each service writes span data to local logs
2) Dapper daemon pulls the data from those logs and stores the data to Dapper collectors
3) Dapper collectors write the data to bigtable where each trace accounts for one line
For the Tracing system for Taobao, refer to the following diagram:
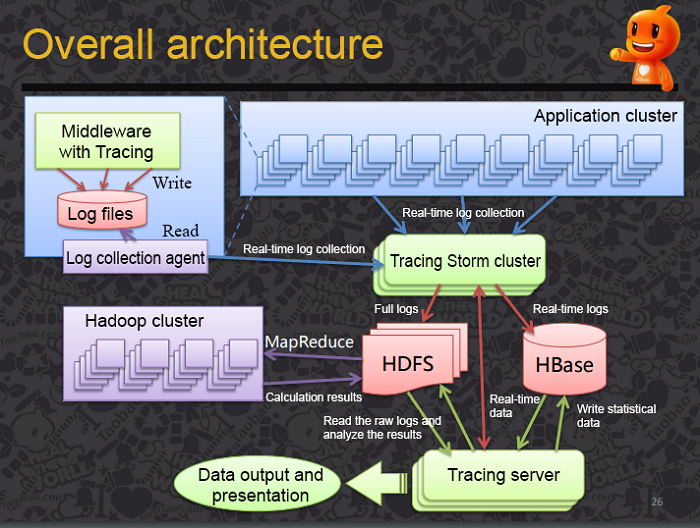
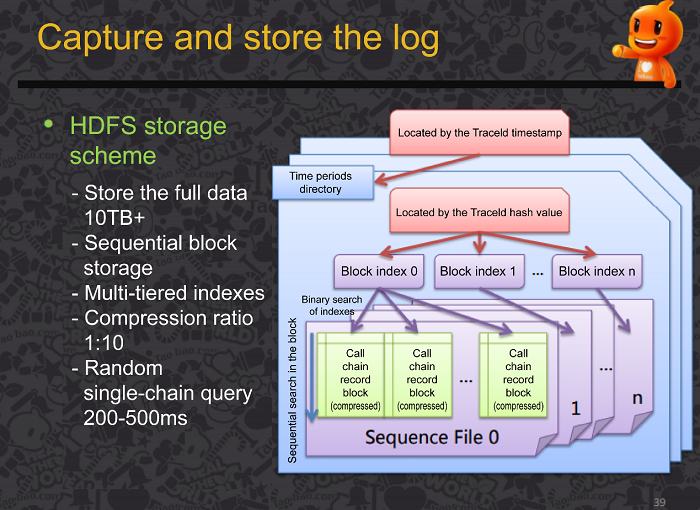
Log collection and storage occurs through the HDFS storage scheme. It stores the full data (with a capacity of more than 10TB) in the form of sequential block storage with multi-tiered indexes. The compression ratio here is 1:10 and the random single-chain query is 200-500ms.
The distributed call tracing system has gained popularity and complexity in today’s time and various business scenarios where it is useful. The enterprise can select the model of the call tracing system, while large Internet companies have their own tracing systems.
In this article, we have explored those of Google and Taobao. Additionally, the tracing implementation first undergoes tracking and log generation which is middleware-based, uses TraceId/RpcId and asynchronous write and sampling. Then it captures the logs via real-time log capturing and stores them using a combination of real-time and offline storage. Post that it summarizes the call chains by the TraceId and reorganizes them by the RpcId. As the last step, it analyzes then generates statistics of calls with standardized entries and context to complete the implementation.

2,593 posts | 793 followers
FollowAlibaba Clouder - November 23, 2020
Alibaba Cloud Native Community - March 14, 2023
Alibaba Cloud Native Community - November 27, 2025
Alibaba Cloud Storage - June 19, 2019
Alibaba Cloud Native Community - February 2, 2026
Xi Ning Wang(王夕宁) - July 21, 2023

2,593 posts | 793 followers
Follow Managed Service for OpenTelemetry
Allows developers to quickly identify root causes and analyze performance bottlenecks for distributed applications.
Learn MoreMore Posts by Alibaba Clouder