By Yanxun
In the past year, ARMS built Kubernetes monitoring based on the eBPF technology to provide multi-language non-intrusive application performance, system performance, and network performance observability capabilities. The technological and ecological development of eBPF is promising. As a practitioner of this technology, this article introduces the eBPF technology by answering seven core questions, helping readers understand eBPF.
eBPF is a technology that can run sandboxed programs in the kernel. It provides a mechanism to safely inject code when kernel and user program events occur so non-kernel developers can control the kernel. With the development of the kernel, eBPF has expanded from the initial packet filtering to the network, kernel, security, tracking, etc. Its functional characteristics are still developing. The early BPF is called classic BPF (cBPF). It is this function extension that makes the current BPF called extended BPF (eBPF).
eBPF has high performance and high scalability, making it the preferred solution for network packet processing in network solutions.
The JIT compiler provides near-kernel native code execution efficiency.
In the context of the kernel, protocol resolution and routing policy can be quickly added.
eBPF uses the kprobe and tracepoints tracking mechanism to provide kernel and user tracking capabilities. This end-to-end tracking capability can quickly diagnose faults. eBPF supports the distribution of profiling statistics in a more efficient manner without the need to transmit a large amount of sampled data like traditional systems, making continuous real-time profiling possible.

eBPF can see all system calls, network packets, and socket network operations. The integration combines process context tracking, network operation-level filtering, and system call filtering to provide better security control.
Compared with traditional system monitoring components that can only provide static counters and gauges(such as sar), eBPF supports customized metrics and events about dynamic collection and edge computing aggregation in a programmable way, improving the efficiency and imagination of performance monitoring.
The emergence of eBPF aims to solve the contradiction between slow kernel iteration and rapid changes in system requirements. An example commonly used in the eBPF field is that the relationship between eBPF and Linux Kernel is similar to Javascript and HTML, highlighting programmability. Generally speaking, the support of programmability usually brings some new problems. For example, the kernel module aims to solve this problem but does not provide a good boundary. As a result, the kernel module will affect the stability of the kernel and needs to be adapted to different kernel versions. eBPF uses the following strategies to make it a secure and efficient core programmable technology.
The eBPF program can only be executed after being verified by the validator and cannot contain unreachable instructions. The eBPF program cannot call kernel functions at will and can only call auxiliary functions defined in the API. The eBPF program stack space is only 512 bytes at most. Mapping storage must be used for larger storage.
With the help of the just-in-time compiler (JIT), there is no need to copy data to the user state since the eBPF instructions are still running in the kernel, which improves the efficiency of event processing.
It provides standard interfaces and data models for developers through BPF Helpers, BTF, and PERF MAP.
eBPF expands the number of registers and introduces a new BPF mapping storage but also extends the original single packet filtering event to kernel state functions, user state functions, trace points, performance events (perf_events), security control, and other fields in the 4.x kernel.

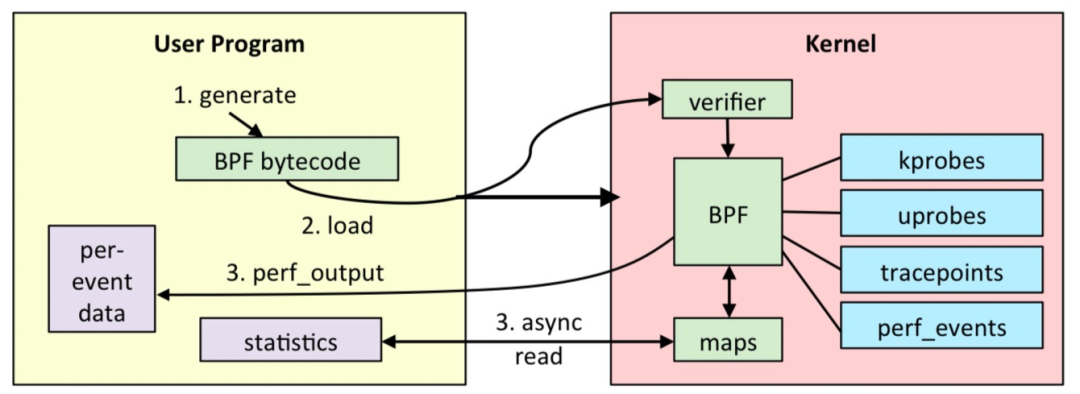
1. Develop an eBPF program with the C language
This is the eBPF sandbox program to be called when the insertion point triggers the event, which will run in the kernel state.
2. Compile eBPF programs into BPF bytecode with LLVM
The eBPF program is compiled into the BPF bytecode for verification later and running within the eBPF virtual machine.
3. Submit the BPF bytecode to the kernel through the bpf system call
In the user state, the BPF bytecode is loaded into the kernel through the bpf system.
4. The kernel verifies and runs the BPF bytecode and saves the corresponding state to the BPF map.
The kernel verifies that the BPF bytecode is safe and ensures the correct eBPF program is called when the corresponding event occurs. If a state is to be saved, it is written to the corresponding BPF map. For example, monitoring data can be written to the BPF mapping.
5. The user program queries the running status of BPF bytecode through BPF mapping.
The user state queries the content of the BPF mapping to obtain the status of the bytecode operation, such as obtaining the captured monitoring data.
A complete eBPF program includes the user state and kernel state. User state programs need to interact with the kernel through BPF system calls to complete eBPF program loading, event mounting, mapping creation and update, etc. In the kernel state, eBPF programs cannot call kernel functions arbitrarily but need to complete the required tasks through BPF auxiliary functions. In particular, when accessing memory addresses, you must use bpf_probe_read series functions to read memory data to ensure secure and efficient memory access. When eBPF programs need large blocks of storage, we need to introduce a specific type of BPF mapping according to the application scenario and use it to provide running state data to programs in user space.
bpftool feature probe | grep program_typeYou can run the preceding command to view the eBPF program types supported by the system. Generally, the following types are available:
eBPF program_type socket_filter is available
eBPF program_type kprobe is available
eBPF program_type sched_cls is available
eBPF program_type sched_act is available
eBPF program_type tracepoint is available
eBPF program_type xdp is available
eBPF program_type perf_event is available
eBPF program_type cgroup_skb is available
eBPF program_type cgroup_sock is available
eBPF program_type lwt_in is available
eBPF program_type lwt_out is available
eBPF program_type lwt_xmit is available
eBPF program_type sock_ops is available
eBPF program_type sk_skb is available
eBPF program_type cgroup_device is available
eBPF program_type sk_msg is available
eBPF program_type raw_tracepoint is available
eBPF program_type cgroup_sock_addr is available
eBPF program_type lwt_seg6local is available
eBPF program_type lirc_mode2 is NOT available
eBPF program_type sk_reuseport is available
eBPF program_type flow_dissector is available
eBPF program_type cgroup_sysctl is available
eBPF program_type raw_tracepoint_writable is available
eBPF program_type cgroup_sockopt is available
eBPF program_type tracing is available
eBPF program_type struct_ops is available
eBPF program_type ext is available
eBPF program_type lsm is available
Please visit this link for more information.
There are mainly three scenarios:
Tracepoint, kprobe, perf_event, etc., are mainly used to extract tracking information from the system and provide data support for monitoring, troubleshooting, and performance optimization.
Xdp, sock_ops, cgroup_sock_addr , sk_msg, etc., are mainly used to filter and process network data packets and realize various functions (such as network observation, filtering, traffic control, and performance optimization). Here, packet loss and redirection can be used.

Cilium uses all hook points.
Lsm is used for security, and others include flow_deptor and lwt_in, which are not commonly used and will not be described here.
The eBPF program is not difficult, but it is difficult to find a suitable event source for it to trigger the operation. The event sources of trace-like eBPF programs include three types in the field of monitoring and diagnosis: kernel function (kprobe), kernel trace point (tracepoint), or performance event (perf_event). There are two questions to answer:
1. What kernel functions, kernel trace points, or performance events are available in the kernel?
sudo ls /sys/kernel/debug/tracing/events# Query all kernel insertions and tracking points.
sudo bpftrace -l
# Use wildcards to query all system call tracking points.
sudo bpftrace -l 'tracepoint:syscalls:*'
# Use wildcards to query all trace points whose names contain "open".
sudo bpftrace -l '*open*'sudo perf list tracepoint2. How can they query the definition format of data structures of kernel functions and tracking points when they need to track their incoming parameters and return values?
sudo cat /sys/kernel/debug/tracing/events/syscalls/sys_enter_openat/formatUse bpftrace to obtain
sudo bpftrace -lv tracepoint:syscalls:sys_enter_openatPlease see bcc for more information.
1. How to query the tracking point of the user process
# Query the symbol table.
readelf -Ws /usr/lib/x86_64-linux-gnu/libc.so.6

# Query the USDT information.
readelf -n /usr/lib/x86_64-linux-gnu/libc.so.6# Query uprobe.
bpftrace -l 'uprobe:/usr/lib/x86_64-linux-gnu/libc.so.6:*'
# Query USDT.
bpftrace -l 'usdt:/usr/lib/x86_64-linux-gnu/libc.so.6:*'Uprobe is file-based. When a function in a file is tracked, unless the process PID is filtered, all processes that use this file will be inserted by default.
The preceding is a static compilation language, which is similar to the tracking of the kernel. The symbolic information of the application program can be stored in the ELF binary file or put into the debugging file in the form of a separate file. In addition to storing the kernel binary file, the symbolic information of the kernel will also be exposed to user space in the form of /proc/kallsyms and /sys/kernel/debug.
There are two main types of non-statically compiled languages:
1. Interpretive Language
Use the trace point query method similar to compiled language applications to query their uprobe and USDT trace points at the interpreter level. How to associate the behavior at the interpreter level with the application behavior needs to be analyzed by experts in relevant languages.
2. Instant Compilation Language
The application source code of this language will be compiled into bytecode and compiled into machine code by the just-in-time compiler (JIT) for execution. There will be a lot of optimization, and tracking is difficult. Similar to interpreted programming languages, uprobe and USDT tracking can only be used on the just-in-time compiler to obtain the function information of the final application from the trace point parameters of the just-in-time compiler. The relationship between the tracking point of the real-time compiler and the operation of the application requires an expert in the relevant language to analyze.
You can refer to BCC's application tracking and user process tracking, essentially executing the uprobe handler through breakpoints. Although the kernel community has done a lot of performance tuning for BPF, tracking user state functions (especially high-frequency functions, such as lock contention and memory allocation) may still cause massive performance overhead. Therefore, we should try to avoid tracking high-frequency functions when using uprobe.
Please see this link for more information.
An ideal state is that all problems are clear, and those insertion points should be observed, but this requires technical support personnel to have a thorough understanding of the end-to-end software stack details. A more reasonable method is the Pareto principle, which grasps the core 80% context of the software stack data flow to ensure that problems will be found in this context. At this time, we can use the kernel stack and user stack to check the specific call stack to find the core problem. For example, we find that the network is losing packets, but we do not know why it is lost. We know the kfree_skb kernel function will be called if the network packet is lost. Then, we can pass:
sudo bpftrace -e 'kprobe:kfree_skb /comm=="<your comm>"/ {printf("kstack: %s\n", kstack);}'Find the call stack of this function:
kstack: kfree_skb+1 udpv6_destroy_sock+66 sk_common_release+34 udp_lib_close+9 inet_release+75 inet6_release+49 __sock_release+66 sock_close+21 __fput+159 ____fput+14 task_work_run+103 exit_to_user_mode_loop+411 exit_to_user_mode_prepare+187 syscall_exit_to_user_mode+23 do_syscall_64+110 entry_SYSCALL_64_after_hwframe+68Then, you can trace back the preceding functions to see which line they are called under what conditions to locate the problem. This method can locate the problem and deepen the understanding of kernel calls, such as:
bpftrace -e 'tracepoint:net:* { printf("%s(%d): %s %s\n", comm, pid, probe, kstack()); }'You can view all network-related trace points and their call stacks.

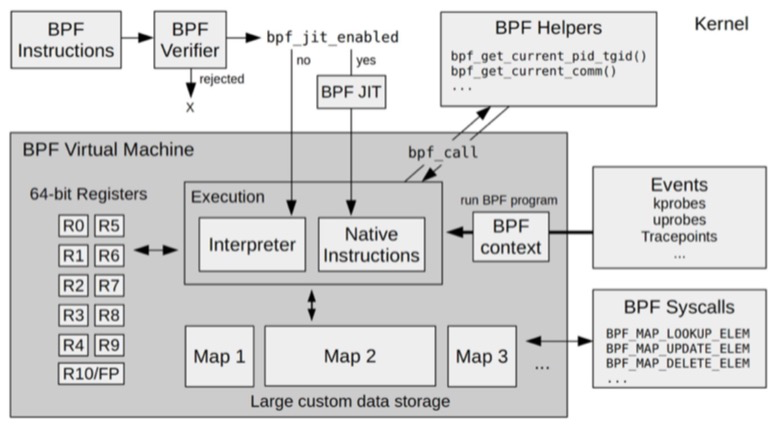
The eBPF is mainly composed of five modules in the kernel:
1. BPF Verifier
It ensures the security of eBPF programs. The verifier will create the instruction to be executed as a directed acyclic graph (DAG) to ensure the program does not contain unreachable instructions. Then, simulate the execution process of the instruction to ensure that invalid instructions will not be executed. Some students taught me that the verifier cannot guarantee 100% security here, so all BPF programs need strict monitoring and review.
2. BPF JIT
Compile eBPF bytecode into local machine instructions for efficient execution in the kernel.
3. A memory module consisting of multiple 64-bit registers, a program counter, and a 512-byte stack
It is used to control the running of eBPF programs, save stack data, and participate in output parameters.
4. BPF Helpers (Auxiliary Function)
It provides a series of functions for eBPF programs to interact with other kernel modules. These functions cannot be called by any eBPF program. The available functions set is determined by the BPF program type. Note: All changes to input and output parameters in eBPF must comply with BPF specifications. Except for changes to local variables, other changes should be completed using BPF Helpers. If BPF Helpers does not support it, it cannot be modified.
bpftool feature probeRun the preceding command to see which BPF Helpers different types of eBPF programs can run
5. BPF Map and Context
It is used to provide large blocks of storage that can be accessed by user-space programs to control the running status of eBPF programs.
bpftool feature probe | grep map_typeRun the command above to see which types of maps the system supports
First, let's talk about the important system call bpf:
int bpf(int cmd, union bpf_attr *attr, unsigned int size);Here cmd is the key, attr is the parameter of cmd, and size is the parameter size, so the key is to see what cmd has:
// 5.11 kernel
enum bpf_cmd {
BPF_MAP_CREATE,
BPF_MAP_LOOKUP_ELEM,
BPF_MAP_UPDATE_ELEM,
BPF_MAP_DELETE_ELEM,
BPF_MAP_GET_NEXT_KEY,
BPF_PROG_LOAD,
BPF_OBJ_PIN,
BPF_OBJ_GET,
BPF_PROG_ATTACH,
BPF_PROG_DETACH,
BPF_PROG_TEST_RUN,
BPF_PROG_GET_NEXT_ID,
BPF_MAP_GET_NEXT_ID,
BPF_PROG_GET_FD_BY_ID,
BPF_MAP_GET_FD_BY_ID,
BPF_OBJ_GET_INFO_BY_FD,
BPF_PROG_QUERY,
BPF_RAW_TRACEPOINT_OPEN,
BPF_BTF_LOAD,
BPF_BTF_GET_FD_BY_ID,
BPF_TASK_FD_QUERY,
BPF_MAP_LOOKUP_AND_DELETE_ELEM,
BPF_MAP_FREEZE,
BPF_BTF_GET_NEXT_ID,
BPF_MAP_LOOKUP_BATCH,
BPF_MAP_LOOKUP_AND_DELETE_BATCH,
BPF_MAP_UPDATE_BATCH,
BPF_MAP_DELETE_BATCH,
BPF_LINK_CREATE,
BPF_LINK_UPDATE,
BPF_LINK_GET_FD_BY_ID,
BPF_LINK_GET_NEXT_ID,
BPF_ENABLE_STATS,
BPF_ITER_CREATE,
BPF_LINK_DETACH,
BPF_PROG_BIND_MAP,
};
The core is PROG and MAP-related cmd, which is program loading and mapping processing.
1. Program Loading
The BPF_PROG_LOAD cmd call loads the BPF program into the kernel, but the eBPF program is not like a regular thread. It runs there all the time after it is started and needs an event to trigger before it is executed. These events include system calls, kernel trace points, call exits of kernel functions and user state functions, network events, etc. The second action is required.
2. Binding Events
b.attach_kprobe(event="xxx", fn_name="yyy")The preceding aims to bind a specific event to a specific BPF function. The actual implementation principle is listed below:
(1) With the help of bpf system calls, after loading the BPF program, the returned file descriptor will be remembered.
(2) Know the event number of the corresponding function type through the attach operation
(3) Call perf_event_open to create performance monitoring events according to the return value of attaching
(4) Bind the BPF program to the performance monitoring event using the PERF_EVENT_IOC_SET_BPF command of ioctl
3. Mapping Processing
The MAP-related cmd is used to control the addition and deletion of the MAP. Then, the user state interacts with the kernel state based on the MAP.
Suggestion: Kernel version >=4.14
The following is the bottom-up ecosystem of eBPF:
1. Infrastructure
It supports the development of basic eBPF capabilities.
2. Development Tool Set
It is mainly used to load, compile, and debug eBPF programs. Different languages have different development tool sets:
https://github.com/cilium/ebpf
https://github.com/aquasecurity/libbpfgo
https://github.com/libbpf/libbpf
3. eBPF Application
It provides a set of development tools and scripts.
Based on bcc, a script language is provided.
Network Optimization and Security
Network Security
High-Performance Four-Layer Load Balancing
Observability
Observability
Observability
Schedule the bpftrace script
The Platform for Starting and Managing eBPF Programs in a Distributed Environment
Dynamic Linux Trace
Monitoring Linux Runtime Security
4. Websites Tracking Ecology
I believe everyone should have a sufficient understanding of eBPF after reading the preceding article. eBPF only provides a framework and mechanism. It is important for people that use eBPF to understand the software stack, find the right insertion point, and be able to relate to application problems.
1. Full Coverage
Fully cover kernel and application insertion point
2. No Intrusion
You do not need to modify any hooked code.
3. Programmability
Dynamically issue eBPF programs, dynamically execute instructions at the edge, and aggregate analysis
The Alibaba Cloud Observability Team works on a variety of technical fields and products (such as frontend monitoring, application monitoring, container monitoring, Prometheus, Tracing Analysis, intelligent alerting, and O&M visualization). It aims to improve observable solutions and best practices in different industries and different technical scenarios.
Alibaba Cloud Kubernetes Monitoring is a comprehensive non-intrusive observability product developed for Kubernetes clusters based on the eBPF technology. It aims to provide an overall observability solution for IT developers and O&M personnel based on the metrics, application processes, logs, and events in Kubernetes clusters.
Introduction:
https://www.alibabacloud.com/help/en/application-real-time-monitoring-service/latest/what-is-kubernetes-monitoring
How Does an Open-Source Workflow Engine Support an Enterprise-Level Serverless Architecture
RocketMQ Message Integration: Multi-Type Business Message - Normal Message

703 posts | 57 followers
FollowXi Ning Wang(王夕宁) - July 21, 2023
Alibaba Cloud Native - April 7, 2023
Alibaba Cloud Native - March 6, 2024
OpenAnolis - October 26, 2022
Alibaba Cloud Native Community - December 13, 2023
OpenAnolis - February 2, 2023

703 posts | 57 followers
Follow Container Service for Kubernetes
Alibaba Cloud Container Service for Kubernetes is a fully managed cloud container management service that supports native Kubernetes and integrates with other Alibaba Cloud products.
Learn More ACK One
Provides a control plane to allow users to manage Kubernetes clusters that run based on different infrastructure resources
Learn More Container Compute Service (ACS)
A cloud computing service that provides container compute resources that comply with the container specifications of Kubernetes
Learn More Cloud-Native Applications Management Solution
Accelerate and secure the development, deployment, and management of containerized applications cost-effectively.
Learn MoreMore Posts by Alibaba Cloud Native Community
Dikky Ryan Pratama May 8, 2023 at 7:02 am
finally I know what eBPF is