In many cases, when overall CPU usage is low but performance is poor, it is usually the CPU core specified to handle interrupts is fully occupied. In this blog, we will be exploring in detail about interrupt settings and several case studies.
When a hardware component (such as a disk controller or an Ethernet NIC) needs to interrupt the work of the CPU, it triggers an interrupt. The interrupt notifies the CPU that an event occurred and the CPU should suspend its current work to deal with the event. To prevent multiple devices from sending the same interrupt, Linux provides an interrupt request system so that each device in the computer system is assigned an interrupt number to ensure the uniqueness of its interrupt request.
In kernel 2.4 and later, Linux improves the capability of assigning specific interrupts to the specified processors (or processor groups). This is called the SMP IRQ affinity, which controls how the system responds to various hardware events. You can limit or redistribute the server workload so that the server can work more efficiently.
Let's take NIC interrupts as an example. Without the SMP IRQ affinity, all NIC interrupts are associated with CPU 0. As a result, CPU 0 is overloaded and cannot efficiently process network packets, causing a bottleneck in performance.
After you configure the SMP IRQ affinity, multiple NIC interrupts are allocated to multiple CPUs to distribute the CPU workload and speed up data processing. The SMP IRQ affinity requires NICs to support multiple queues. A NIC supporting multiple queues has multiple interrupt numbers, which can be evenly allocated to different CPUs.
You can simulate a multi-queue mode for a single-queue NIC by means of receive packet steering (RPS) or receive flow steering (RFS), but the effect is poorer than that of a multi-queue NIC with RPS/RFS enabled.
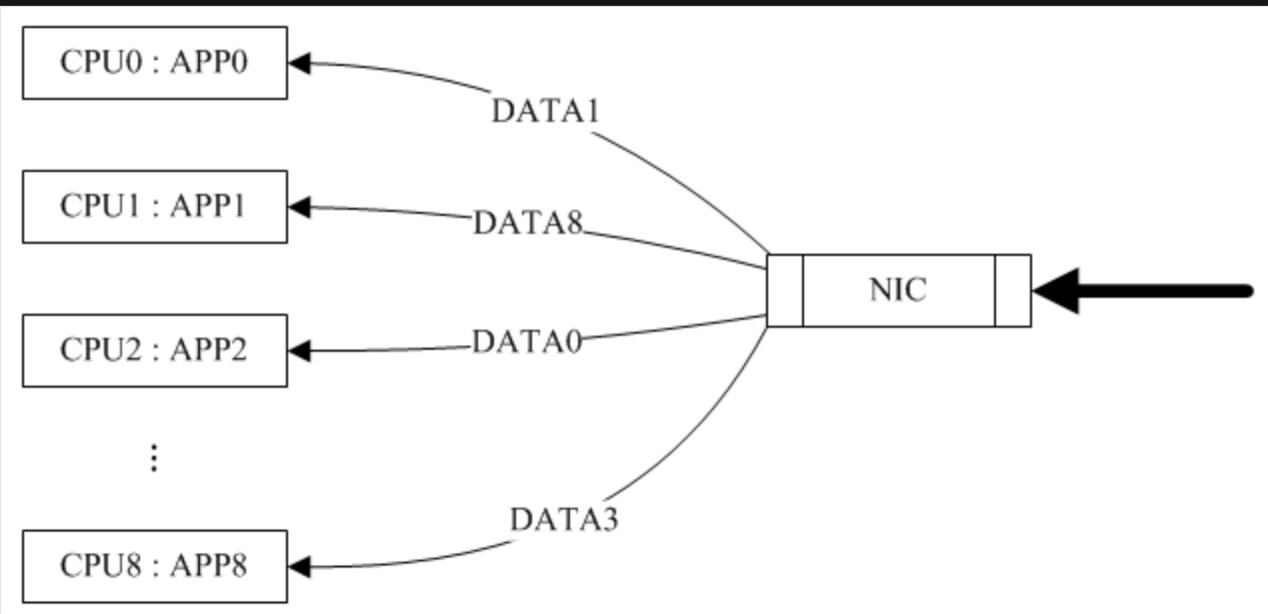
Receive packet steering (RPS) balances the load of soft interrupts among CPUs. In short, the NIC driver calculates a hash ID for each stream by using a quadruplet (SIP, SPORT, DIP, and DPORT), and the interrupt handler allocates the hash ID to the corresponding CPU, thus fully utilizing the multi-core capability. Generally, RPS simulates functions of a multi-queue NIC by using software. If a NIC supports multiple queues, RPS is ineffective. RPS is mainly intended for single-queue NICs in a multi-CPU environment. If a NIC supports multiple queues, you can directly bind hard interrupts to CPUs by configuring the SMP IRQ affinity.

Figure 1 Case with only RPS enabled (sourcing from the Internet)
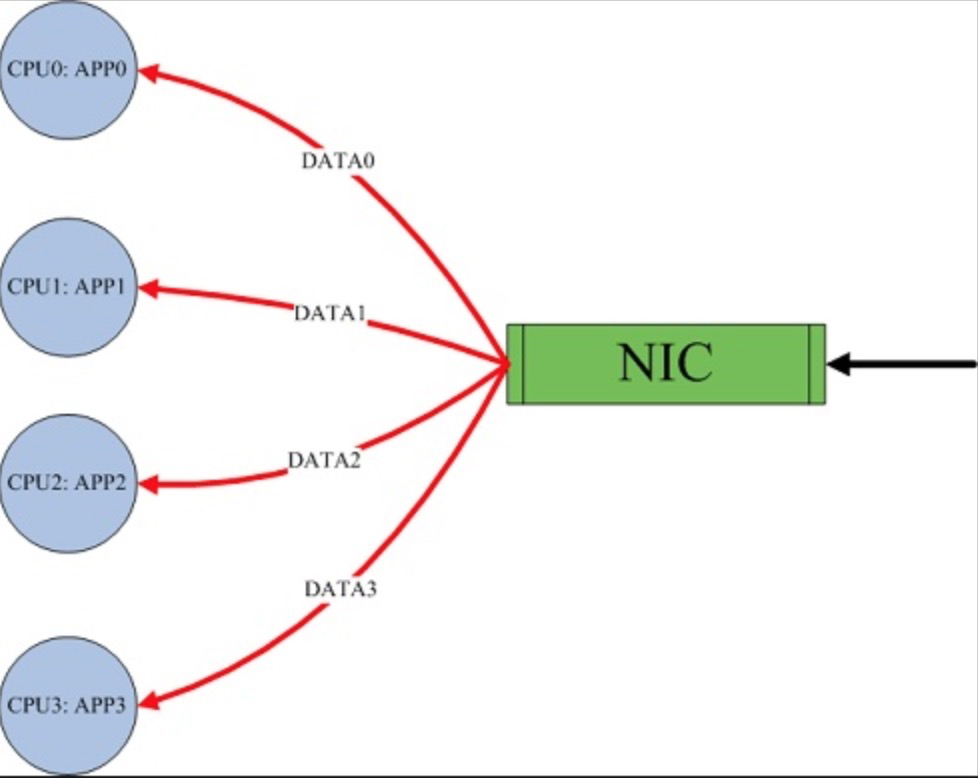
RPS simply distributes data packets to different CPUs. This greatly degrades the utilization of CPU caches when different CPUs are used to run applications and handle soft interrupts. In this case, RFS ensures that one CPU is used to run applications and handle soft interrupts, to fully utilize the CPU caches. RPS and RFS are usually used together to achieve the best results. They are mainly intended for single-queue NICs in a multi-CPU environment.

Figure 2 Case with both RPS and RFS enabled (sourcing from the Internet)
The values of rps_flow_cnt and rps_sock_flow_entries are carried to the nearest power of 2. For a single-queue device, rps_flow_cnt is equal to rps_sock_flow_entries.
Receive flow steering (RFS), together with RPS, inserts data packets into the backlog queue of a specified CPU, and wakes up the CPU for execution.
IRQbalance is applicable to most scenarios. However, in scenarios requiring high network performance, you are recommended to bind interrupts manually.
IRQbalance can cause some issues during operation:
(a) The calculated value is sometimes inappropriate, failing to achieve load balancing among CPUs.
(b) When the system is idle and IRQs are in power-save mode, IRQbalance distributes all interrupts to the first CPU, to make other idle CPUs sleep and reduce energy consumption. When the load suddenly rises, performance may be degraded due to the lag in adjustment.
(c) The CPU specified to handle interrupts frequently changes, resulting in more context switches.
(d) IRQbalance is enabled but does not take effect, that is, does not specify a CPU for handling interrupts.
1. "Combined" indicates the total number of queues. In the following example, the test machine has four queues.
# ethtool -l eth0
Channel parameters for eth0:
Pre-set maximums:
RX:     0
TX:     0
Other:      0
Combined:   4
Current hardware settings:
RX:     0
TX:     0
Other:      0
Combined:   4
2. Let's take ECS CentOs7.6 as an example. System processing interrupts are recorded in the /proc/interrupts file. This file is large by default and difficult to read. If there are many CPU cores, the reading experience is greatly compromised.
# cat /proc/interrupts
           CPU0       CPU1       CPU2       CPU3
  0:        141          0          0          0   IO-APIC-edge      timer
  1:         10          0          0          0   IO-APIC-edge      i8042
  4:        807          0          0          0   IO-APIC-edge      serial
  6:          3          0          0          0   IO-APIC-edge      floppy
  8:          0          0          0          0   IO-APIC-edge      rtc0
  9:          0          0          0          0   IO-APIC-fasteoi   acpi
 10:          0          0          0          0   IO-APIC-fasteoi   virtio3
 11:         22          0          0          0   IO-APIC-fasteoi   uhci_hcd:usb1
 12:         15          0          0          0   IO-APIC-edge      i8042
 14:          0          0          0          0   IO-APIC-edge      ata_piix
 15:          0          0          0          0   IO-APIC-edge      ata_piix
 24:          0          0          0          0   PCI-MSI-edge      virtio1-config
 25:       4522          0          0       4911   PCI-MSI-edge      virtio1-req.0
 26:          0          0          0          0   PCI-MSI-edge      virtio2-config
 27:       1913          0          0          0   PCI-MSI-edge      virtio2-input.0
 28:          3        834          0          0   PCI-MSI-edge      virtio2-output.0
 29:          2          0       1557          0   PCI-MSI-edge      virtio2-input.1
 30:          2          0          0        187   PCI-MSI-edge      virtio2-output.1
 31:          0          0          0          0   PCI-MSI-edge      virtio0-config
 32:       1960          0          0          0   PCI-MSI-edge      virtio2-input.2
 33:          2        798          0          0   PCI-MSI-edge      virtio2-output.2
 34:         30          0          0          0   PCI-MSI-edge      virtio0-virtqueues
 35:          3          0        272          0   PCI-MSI-edge      virtio2-input.3
 36:          2          0          0        106   PCI-MSI-edge      virtio2-output.3
input0 indicates the network interrupt handled by the first CPU (CPU 0).
If there are multiple Alibaba Cloud ECS network interrupts, input.1, input.2, and input.3 are available.
......
PIW:          0          0          0          0   Posted-interrupt wakeup event
3. If the Alibaba Cloud ECS contains many CPU cores, the file is difficult to read. You can run the following command to find the cores specified to handle interrupts in the Alibaba Cloud ECS.
In the following example, four queues are configured on eight CPUs.
# for i in $(egrep "\-input."  /proc/interrupts |awk -F ":" '{print $1}');do cat /proc/irq/$i/smp_affinity_list;done
5
7
1
3
sar processing for copying:
# for i in $(egrep "\-input."  /proc/interrupts |awk -F ":" '{print $1}');do cat /proc/irq/$i/smp_affinity_list;done |tr -s '\n' ','
5,7,1,3,
#sar -P 5,7,1,3 1 Refresh the usage of CPUs 5, 7, 1, and 3 every second.
# sar -P ALL 1 Refresh the usage of all CPU cores every second when a few CPU cores are being monitored, so that we can determine whether slow processing is caused by insufficient queues.
Linux 3.10.0-957.5.1.el7.x86_64 (iZwz98aynkjcxvtra0f375Z)   05/26/2020  _x86_64_    (4 CPU)
05:10:06 PM     CPU     %user     %nice   %system   %iowait    %steal     %idle
05:10:07 PM     all      5.63      0.00      3.58      1.02      0.00     89.77
05:10:07 PM       0      6.12      0.00      3.06      1.02      0.00     89.80
05:10:07 PM       1      5.10      0.00      5.10      0.00      0.00     89.80
05:10:07 PM       2      5.10      0.00      3.06      2.04      0.00     89.80
05:10:07 PM       3      5.10      0.00      4.08      1.02      0.00     89.80
05:10:07 PM     CPU     %user     %nice   %system   %iowait    %steal     %idle
05:10:08 PM     all      8.78      0.00     15.01      0.69      0.00     75.52
05:10:08 PM       0     10.00      0.00     16.36      0.91      0.00     72.73
05:10:08 PM       1      4.81      0.00     13.46      1.92      0.00     79.81
05:10:08 PM       2     10.91      0.00     15.45      0.91      0.00     72.73
05:10:08 PM       3      9.09      0.00     14.55      0.00      0.00     76.36
sar tips:
Display the cores with the "idle" value less than 10.
sar -P 1,3,5,7 1 |tail -n+3|awk '$NF<10 {print $0}'Check whether a single core is fully occupied. If yes, replace "1,3,5,7" with "ALL".
sar -P ALL 1 |tail -n+3|awk '$NF<10 {print $0}'The following example shows configurations with four cores and a memory capacity of 8 GB (ecs.c6.xlarge):
In this example, four queues are configured on four CPUs, but interrupts are handled by CPUs 0 and 2 by default.
# grep -i "input" /proc/interrupts
 27:       1932          0          0          0   PCI-MSI-edge      virtio2-input.0
 29:          2          0       1627          0   PCI-MSI-edge      virtio2-input.1
 32:       1974          0          0          0   PCI-MSI-edge      virtio2-input.2
 35:          3          0        284          0   PCI-MSI-edge      virtio2-input.3
# for i in $(egrep "\-input."  /proc/interrupts |awk -F ":" '{print $1}');do cat /proc/irq/$i/smp_affinity_list;done
1
3
1
3
This is feasible because hyper-threading is enabled for physical CPUs and each vCPU is bound to a hyper-thread of a physical CPU.
# lscpu
Architecture:          x86_64
CPU op-mode(s):        32-bit, 64-bit
Byte Order:            Little Endian
CPU(s):                4
On-line CPU(s) list:   0-3
Thread(s) per core:    2
Core(s) per socket:    2
Socket(s):             1
NUMA node(s):          1
4. Disable IRQbalance.
# service irqbalance status
Redirecting to /bin/systemctl status irqbalance.service
● irqbalance.service - irqbalance daemon
   Loaded: loaded (/usr/lib/systemd/system/irqbalance.service; enabled; vendor preset: enabled)
   Active: inactive (dead) since Wed 2020-05-27 14:39:28 CST; 2s ago
  Process: 1832 ExecStart=/usr/sbin/irqbalance --foreground $IRQBALANCE_ARGS (code=exited, status=0/SUCCESS)
 Main PID: 1832 (code=exited, status=0/SUCCESS)
May 27 14:11:40 iZbp1ee4vpiy3w4b8y2m8qZ systemd[1]: Started irqbalance daemon.
May 27 14:39:28 iZbp1ee4vpiy3w4b8y2m8qZ systemd[1]: Stopping irqbalance daemon...
May 27 14:39:28 iZbp1ee4vpiy3w4b8y2m8qZ systemd[1]: Stopped irqbalance daemon.
5. Configure RPS manually.
5.1 Understand the following file before you configure RPS manually (IRQ_number is the serial number obtained by the grep input command).
Go to /proc/irq/${IRQ_number}/ and read the smp_affinity and smp_affinity_list files.
The smp_affinity file is in the bitmask and hexadecimal format.
The smp_affinity_list file is in the decimal format and easy to read.
Modification of either file is synchronized to the other file.
For ease of understanding, let's look at the smp_affinity_list file in the decimal format.
If you are not clear about this step, refer to the previous output of /proc/interrupts.
# for i in $(egrep "\-input."  /proc/interrupts |awk -F ":" '{print $1}');do cat /proc/irq/$i/smp_affinity_list;done
1
3
1
3
You can run the echo command to change the CPU specified to handle interrupts. In the following example, interrupt 27 is allocated to CPU 0 for processing. Generally, you are recommended to leave CPU 0 unused.
# echo 0 >> /proc/irq/27/smp_affinity_list
# cat /proc/irq/27/smp_affinity_list
0
Bitmask:
"f" is a hexadecimal value corresponding to the binary value of "1111". (When the bits for four CPUs are set to f, all CPUs are used to handle interrupts.)
Each bit in the binary value represents a CPU on the server. A simple demo is shown below:
  CPU ID  Binary  Hexadecimal
   CPU 0   0001    1
   CPU 1   0010    2
   CPU 2   0100    4
   CPU 3   1000    8
5.2 Configure each queue of a NIC separately. For example, specify queue 0 for eth0:
echo ff > /sys/class/net/eth0/queues/rx-0/rps_cpus

This method is similar to the method used to configure the interrupt affinity. A mask is used, and is set to a value indicating that all CPUs can be used to handle interrupts. For example:
4core, f
8core, ff
16core, ffff
32core, ffffffff
Queue 0 is configured on CPU 0 by default.
# cat /sys/class/net/eth0/queues/rx-0/rps_cpus
0
# echo f >>/sys/class/net/eth0/queues/rx-0/rps_cpus
# cat /sys/class/net/eth0/queues/rx-0/rps_cpus
f
6. Configure RFS.
Configure the following two items:
6.1 Control the number of entries in the global table (rps_sock_flow_table) by using a kernel parameter:
# sysctl -a |grep net.core.rps_sock_flow_entries
net.core.rps_sock_flow_entries = 0
# sysctl -w net.core.rps_sock_flow_entries=1024
net.core.rps_sock_flow_entries = 1024
6.2 Specify the number of entries in the hash table of each NIC queue:
#  cat /sys/class/net/eth0/queues/rx-0/rps_flow_cnt
0
# echo 256 >> /sys/class/net/eth0/queues/rx-0/rps_flow_cnt
#  cat /sys/class/net/eth0/queues/rx-0/rps_flow_cnt
256
To enable RFS, configure both items.
We recommend that the sum of rps_flow_cnt from all NIC queues on the machine be less than or equal to rps_sock_flow_entries. Four queues are available and the number of entries in each queue is set to 256, which can be increased as required.
Background: Iperf3 used five threads, one of which generated 1 GB of traffic. The traffic fluctuated greatly between 4.6x and 5.2x. The interrupt load was unbalanced. In this case, we performed the following settings:
1. Configure RPS where there are 32 cores and 16 queues. Set the mask to ffffffff.
2. RFS 65536 /16 = 4096
3. smp_affinity_list 1,3,5,7,9....31
However, the interrupt load was still unbalanced. Considering the cache hits with RFS enabled, we increased the number of threads on the client to 16. Then interrupt processing tended to be stable, but the traffic still fluctuated.
4. Disable TSO. The traffic fluctuated between 7.9x and 8.0x and tended to be stable.
With the above settings, we can do some fine-tuning tests in stress testing to observe the service, and check whether CPU interrupts of the ongoing instance in the production environment are handled in a balanced manner.
Background: The customer deployed several reverse proxy servers for backend Kubernetes clusters. Two servers were subject to occasional timeout, and no logs were recorded for backend applications.
We performed troubleshooting as follows:
1. Check the captured packet files of the proxy servers provided by the customer. The files showed that the peer end returned no packets after syn packets were retransmitted, indicating a possible anomaly at the peer end.

2. Capture packets on the server. The results showed that the server received no retransmitted packets, indicating a possible anomaly in the source instance.
3. Capture packets on the physical machine. The results showed that the physical machine received no retransmitted packets, indicating a possible anomaly in the system.
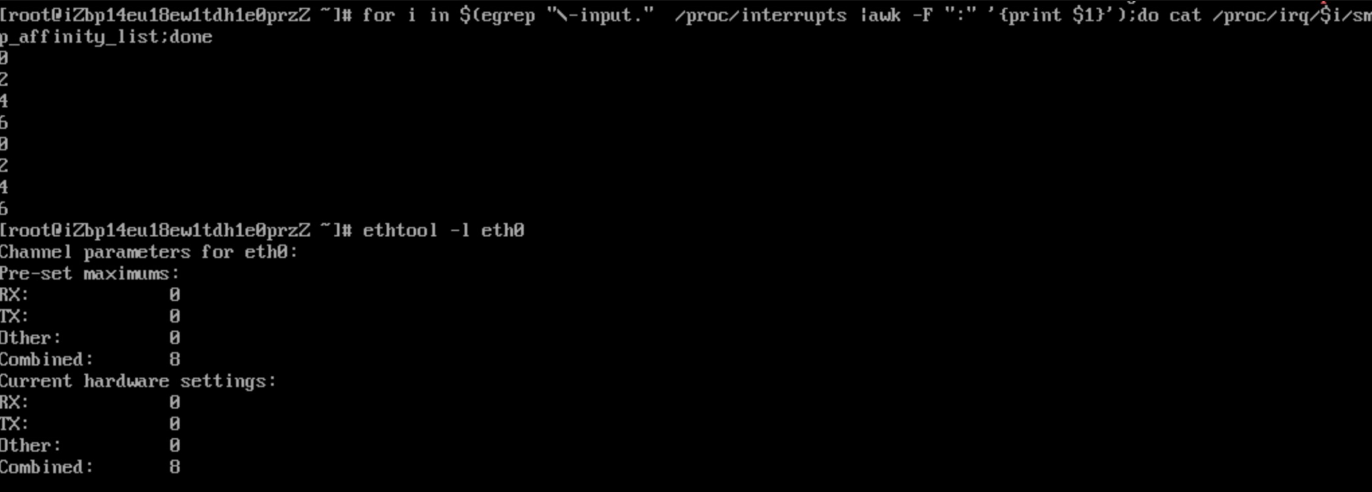
4. Log in to the system to check the interrupt settings. In this instance, eight cores and eight queues were configured. Cores 0, 2, 4, and 6 were enabled to handle the eight interrupts by default.

5. Check the number of interrupts handled on each core. We found a large difference in the numbers and an anomaly with interrupt 6 of input 6, which remained unchanged for a long time under monitoring.

6. Check the system logs for exception logs of input 6. As expected, an exception alert was found, indicating a suspected qemu-kvm bug.

7. Restart and recover the system. Attempt to bind the interrupts to different cores by referring to the preceding settings.
Alibaba Clouder - March 19, 2020
OpenAnolis - July 25, 2022
Alibaba Cloud Community - September 10, 2024
OpenAnolis - August 9, 2022
OpenAnolis - March 25, 2026
OpenAnolis - May 8, 2023
 ECS(Elastic Compute Service)
Elastic and secure virtual cloud servers to cater all your cloud hosting needs.
Learn More Alibaba Cloud Linux
Alibaba Cloud Linux is a free-to-use, native operating system that provides a stable, reliable, and high-performance environment for your applications.
Learn More Elastic High Performance Computing Solution
High Performance Computing (HPC) and AI technology helps scientific research institutions to perform viral gene sequencing, conduct new drug research and development, and shorten the research and development cycle.
Learn More Elastic High Performance Computing
A HPCaaS cloud platform providing an all-in-one high-performance public computing service
Learn More