By Yuebin
As the infrastructure provided at the underlying layer of Alibaba Cloud, the internal physical networks and many networking products are not user-friendly at the data plane and, in a certain sense, constitute a black box. In traditional Internet data centers (IDCs), services are separated from physical networks. Therefore, challenges such as service lagging, latency, and disconnection frequently attribute to network issues. Among these problems, the toughest are those with the extremely occasional occurrence and significantly low reproduction rate. Resolving these challenges is all the more prominent in the network sector, where not all data packets are logged, considering performance and resource consumption control. In the case of occasional time-out logged at the application layer, the network layer usually has no specific log about packet exchange during the involved scheduling process at the application layer. This makes troubleshooting extremely complex.
This article describes a case where a client encounters occasional time-out during the Redis cluster query and subsequently proposes the diagnosis approach, troubleshooting method, and best practices for improving service reliability at the network layer.
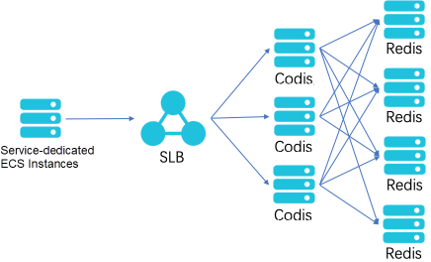
The problem to discuss lies in a submodule of an interactive web application for Redis query. Simply put, the submodule is used to query live comments on a video website with a bullet screen. The submodule has a simple topology, as shown in the following figure.

In this topology, a Redis cluster is built based on Elastic Compute Service (ECS) instances and configured with Redis Proxy through Codis at the front end wherein Proxy is used in description for commonality purposes. Redis Proxy is attached to the backend of a Server Load Balancer (SLB) instance, which provides a single entry for service provisioning.
The client that accesses the on-premises Redis system reports the time-out error from time to time, with a higher probability as compared to the scenario when services are hosted in the original IDC but still within the acceptable range. The time-out error typically occurs in the following situations:
1) The number of time-out errors is proportional to the service volume. The resource usage of SLB and ECS instances is low even outside the service peak period.
2) A burst of time-out errors may occur.
To solve this problem, we must first understand the context and environment of the problem. Let's divide the information required during the diagnosis process into the following two types to ensure collecting complete information in an ordered way.
After understanding the resource information and environmental information, it's easy to pinpoint the problem in specific resources, collect related information based on the problem definition, and identify the root cause by using a data-oriented method of exclusion during problem interpretation and analysis. This enables efficient and accurate troubleshooting.
Previously, we have discussed resource information as related to the topology of the problematic system. Now, let's explore environmental information, which includes the configured time-out period (50 ms), client-reported error ("read timeout", excluding TCP three-way handshake time-out), and error reporting frequency (10 errors per hour during non-service peak hours and hundreds of errors per hour during service peak hours). In occasional cases (one to two times of occurrence per week), hundreds of "read timeout" and "connect timeout" errors are reported during service peak hours and non-service peak hours. According to the customer's Redis check results, the query time was always less than 10 ms, and Redis Proxy recorded no forwarding logs.
Further information needs to be collected as all available logs are only related to both ends (client and Redis) of the system. Packet capture is the most direct and effective approach to handle time-out errors. Disk storage space may quickly run out if packet capture is always on, considering the relatively low frequency of problem occurrence and the heavy traffic of the entire system. To address this, run the following command to capture packets cyclically:
tcpdump -i <接口|any> -C <每文件大小> -W <文件个数> -w <保存文件名> 抓包过滤条件The preceding command is used to capture packets on a specific interface based on filter conditions. The captured packets are saved to files whose filenames contain the specified prefix. The maximum occupied disk space is equal to the size of each file multiplied by the number of files, which are cyclically overwritten. By enabling cyclic packet capture, exchanged packets are captured when the client reports an error.
The captured packet files are opened in Wireshark. The following snippet shows how to filter numerous large-sized packet files captured during cyclic packet capture.
//在安装了wireshark的电脑上都会有capinfos和tshark两个命令,以笔者使用的macOS为例
~$ capinfos -a -e *cap //使用capinfos查看抓包文件的其实时间和结束时间,选取包含报错时间+-超时时间的文件,其他文件就不需要了
File name:           colasoft_packets.cap
Packet size limit:   inferred: 66 bytes - 1518 bytes (range)
First packet time:   2019-06-12 09:00:00.005519934
Last packet time:    2019-06-12 09:59:59.998942048

File name:           colasoft_packets1.cap
Packet size limit:   inferred: 60 bytes - 1518 bytes (range)
First packet time:   2019-06-12 09:00:00.003709451
Last packet time:    2019-06-12 09:59:59.983532957

//如果依然有较多文件,则可以使用tshark命令进行筛选。比如报错中提到Redis查询一个key超时,则可以用以下脚本找到这次查询请求具体在哪个文件中:
~$ for f in ./*; do echo $f; tshark -r $f 'tcp.payload contains "keyname"'; done
Identify the request, open the file in Wireshark, locate the data packets, and track the stream to identify 5-tuple information and context interaction of the entire stream.
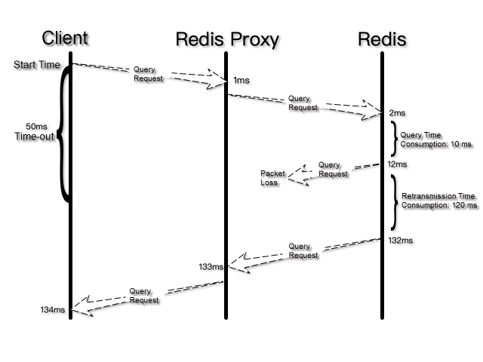
A comparison of the packets captured on the client, Redis Proxy, and Redis shows a period of more than 100 ms from when the client sends a request to when it receives a response. Much of that period is consumed by Redis resending a response packet to Redis Proxy due to packet loss. The following figure shows the request-response flowchart.

The packet loss indicated by captured packets does not occur on physical links based on the internal monitoring results of Alibaba Cloud. However, on the ECS instance that hosts Redis Proxy, the number of lost packets of the front-end and back-end queues increases in proportion to the service time-out frequency when the back-end drive sends packets to the front-end drive at the virtualized layer. Further troubleshooting indicates that the operating system of the ECS instance does not enable the multi-queue network interface controller (NIC) feature, and therefore only one CPU is responsible for processing NIC interrupts. As a result, the CPU fails to promptly process NIC interrupts in the case of traffic bursts, causing front-end and back-end queue accumulation and packet loss due to queue overflow.
To solve this problem, we recommend that the customer enable the multi-queue NIC feature and bind the CPU affinities of various NIC queue interrupts to different CPUs. For Alibaba Cloud ECS, the available NIC queues are bound to the instance type. For more information, refer to the ECS instance type document. For more information about how to enable the multi-queue NIC feature and automatically schedule the CPU affinities of NIC queue interrupts by using irqbalance, see the Alibaba Cloud documentation.
Enabling the multi-queue NIC feature and irqbalance service resolves the problem of hourly access time-out. However, many time-out errors still occur in bursts every few days. According to the customer-collected error messages and the underlying network monitoring results of Alibaba Cloud, the problem of time-out error bursts is due to cross-zone link jitters at the underlying layer of Alibaba Cloud.
Each zone of Alibaba Cloud can be regarded as a data center, and different zones can provide local disaster recovery for each other. Zones must be physically isolated from each other to prevent cross-zone fault spreading, and must be interconnected through local optical cables for mutual access.
The local optical cables that connect zones are much less reliable than fiber jumpers used inside data centers and are prone to link interruption due to road construction and quality degradation. Considering service continuity, Alibaba Cloud provides sufficient redundant links and uses technologies such as transmission failover and route switching to ensure that some cross-zone links automatically converge upon faults. However, packet loss persists during the switching process. According to the underlying monitoring results of Alibaba Cloud, about 1% of packets are lost over a period of 3 to 5 seconds when a cross-zone link is interrupted. The packet loss rate depends on the proportion of interrupted links to the total links. This may cause time-out errors reported for some latency-sensitive services for nearly 1 minute. The time-out error bursts mentioned previously are attributed to these latency-sensitive services.
If zones that host useful resources are highly scattered, cross-zone link jitters are more likely to affect services. For example, if the ECS instances at the client's end are located in Zones A and B, the SLB instance in Zone C, Redis Proxy in Zone D, and Redis in Zone E, then jitters of the links from A to C, from B to C, from C to D, and from D to E may affect the entire system.
Through the preceding case study, we can extrapolate two best practices related to networks hosts and network deployment:
Best Practice for Host Networks
Enable the multi-queue NIC feature and scatter NIC software interrupts for optimal network performance. The following general recommendations are available for ensuring stable network performance:
//绑定网卡软中断的方法:
//1. 首先看cat /proc/interrupts | grep virtio,在阿里云提供的标准操作系统中,virtio0是网卡队列
~$cat /proc/interrupts  | grep virtio
//omit outputs
 31:  310437168          0          0          0   PCI-MSI-edge      virtio0-input.0
 32:  346644209          0          0          0   PCI-MSI-edge      virtio0-output.0
//将第一列的中断号记录下来,修改下面的文件绑定CPU亲和性
echo <cpu affinity mask> /proc/irq/{irq number}/smp_affinity
//具体CPU affinity mask可以参考manpage https://linux.die.net/man/1/taskset,这里不再说明。
Best Practice for Physical Networks
Take service tolerance and latency sensitivity into account for deploying services.
The preceding case study and best practices show that we have to make "trade-offs" when designing and deploying service system architectures. Resource optimization is critical for achieving service objectives in a given environment. Many customers may not deploy several data centers in their system architectures before cloud migration due to factors such as the costs and locations of data centers. These customers will benefit from cloud computing for cross-generation infrastructure upgrade and inherent disaster recovery capabilities. It is significant to consider the complex networking that results from disaster recovery while designing and deploying service system architectures.
The views expressed herein are for reference only and don't necessarily represent the official views of Alibaba Cloud.
Jack Ma Foundation and Alibaba Foundation Ramp up Coronavirus Aid to Europe

2,593 posts | 793 followers
FollowNeel_Shah - February 26, 2026
Kidd Ip - May 29, 2025
Alibaba Cloud Community - September 3, 2024
Alibaba Clouder - September 4, 2020
Alibaba Clouder - August 24, 2020
Apache Flink Community - January 9, 2025

2,593 posts | 793 followers
Follow Networking Overview
Connect your business globally with our stable network anytime anywhere.
Learn More Edge Network Acceleration
Establish high-speed dedicated networks for enterprises quickly
Learn More Global Network Solution
Alibaba Cloud's global infrastructure and cloud-native SD-WAN technology-based solution can help you build a dedicated global network
Learn More CloudAP
A new-generation wireless network access product based on cloud and big data platforms.
Learn MoreMore Posts by Alibaba Clouder