![]()
Today, more and more enterprises are focusing on establishing log-based security analysis and protection systems. We will show you how to use the Log Service to collect massive logs from the ground up, and how to filter and identify suspicious operations and analyze them in real time to further enable security dashboard and visualization. The practices cover several typical security analysis scenarios.
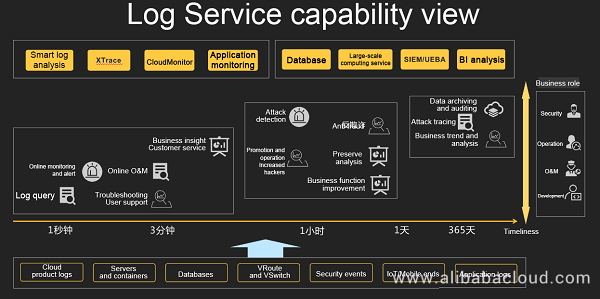
By following this article, you should be able to understand how to use the Log Service for threat identification and analysis in typical security scenarios, including:
We will then briefly talk about how you can build a security dashboard to help you visualize the threat analysis.
You will need to have a valid Alibaba Cloud account.
Head to the Log Service Console, and create a project. For our example, we have created a project called "yq201809". You should be able to visit your project directly using the URL https://sls.console.aliyun.com/#/project/yq201809/categoryList
You will need to create a Logstore for Log Service to work. We have called this "yq-demo". To query the page of the prepared logstore yq-demo, click "Search":
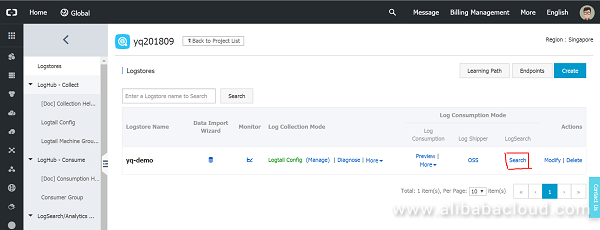
Enter the following command on the query page to see the host logon logs:
__topic__ : winloginThe log structure is as follows:
__topic__:  winlogin         // log topic: the logon log is winlogin
client_ip:  197.210.226.56   // the IP address of the logon client
result:  success             // logon result: success/fail
target:  host4.test.com      // the host being logged on to
target_type:  server         // machine type: server/normal
type:  ssh                   // logon method:ssh/rdp
user: admin // logon accountTask: Identify brute-force attacks through SQL correlation analysis
Logic: There is a successful logon to a specific server after consecutive failed logon attempts
Key steps:
Enter the following query analysis statement:
__topic__: winlogin and target_type: server | select date_format(max_by(__time__, __time__), '%m-%d %H:%i:%s') as "×î½üʱ¼ä", target as "·þÎñÆ÷", 4 as "Æƽâ´ÎÊý", count(1) as "ʼþ´ÎÊý" FROM (select __time__, target, result, lag(result, 1, 'δ֪') over ( PARTITION by target order by __time__) as pre1, lag(result, 2, 'δ֪') over ( PARTITION by target order by __time__) as pre2 , lag(result, 3, 'δ֪') over ( PARTITION by target order by __time__) as pre3 , lag(result, 4, 'δ֪') over ( PARTITION by target order by __time__) as pre4 from log) where result='success' and pre1='fail' and pre1='fail' and pre2='fail' and pre3='fail' and pre4='fail' group by targetThis statement is roughly divided into three parts:
Filter: select logon logs where the target type is server:
__topic__: winlogin and target_type: serverAdd context to each log via the window function lag: whether previous logon attempts succeeded:
__topic__: winlogin and target_type: server | select __time__, target, result, lag(result, 1, 'δ֪') over ( PARTITION by target order by __time__) as pre1, lag(result, 2, 'δ֪') over ( PARTITION by target order by __time__) as pre2 , lag(result, 3, 'δ֪') over ( PARTITION by target order by __time__) as pre3 , lag(result, 4, 'δ֪') over ( PARTITION by target order by __time__) as pre4 from logThrough subqueries and grouping, find all logon logs where current logon attempt succeeded after previous attempts failed, and use the window functions max_by, etc., to record the most and the least recent times:
__topic__: winlogin and target_type: server | select date_format(max_by(__time__, __time__), '%m-%d %H:%i:%s') as "×î½üʱ¼ä", target as "·þÎñÆ÷", 4 as "Æƽâ´ÎÊý", count(1) as "ʼþ´ÎÊý" FROM (select __time__, target, result, lag(result, 1, 'δ֪') over ( PARTITION by target order by __time__) as pre1, lag(result, 2, 'δ֪') over ( PARTITION by target order by __time__) as pre2 , lag(result, 3, 'δ֪') over ( PARTITION by target order by __time__) as pre3 , lag(result, 4, 'δ֪') over ( PARTITION by target order by __time__) as pre4 from log) where result='success' and pre1='fail' and pre1='fail' and pre2='fail' and pre3='fail' and pre4='fail' group by targetSelect "1 hour" for the "Time" to see a list of brute-force attack events:
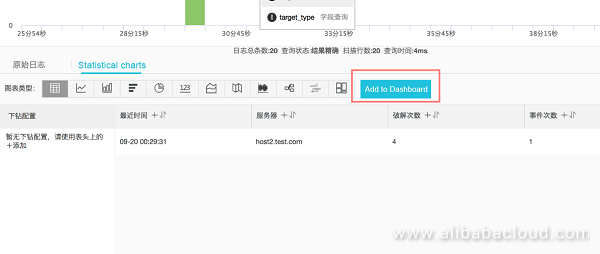
Select the form and click "Add to Dashboard": select the existing dashboard My security dashboard and name it "Brute-force attack events".
Reference: See the pre-configured "quick query": brute-force attacks.
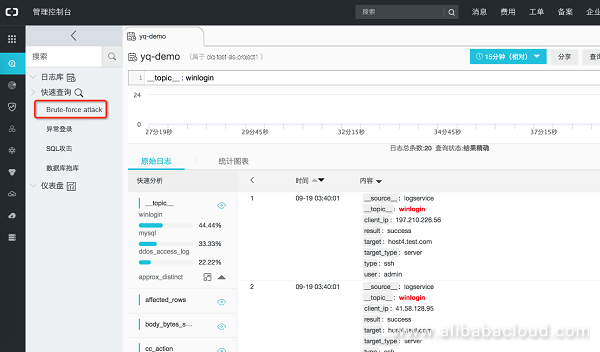
Task: Analyze the logon addresses through the SQL geographic functions and the security functions to identify abnormal logons. In addition, configure the drill down to further view the logon IP addresses.
Logic: In general, the server has been logged into from China or the United States (through VPN). There are some logons with IP addresses from other countries, and the IP addresses are infected.
Key steps:
Enter the following query analysis statement:
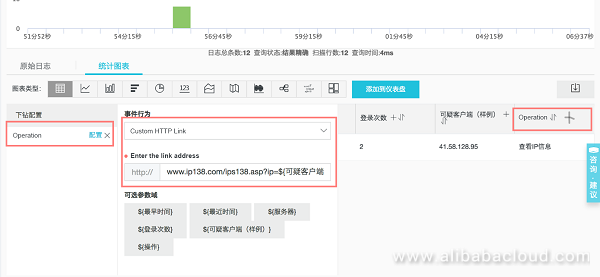
__topic__: winlogin and result: success and target_type: server | select date_format(min_by(__time__, __time__), '%m-%d %H:%i:%s') as "×îÔçʱ¼ä", date_format(max_by(__time__, __time__), '%m-%d %H:%i:%s') as "×î½üʱ¼ä", target as "·þÎñÆ÷", count(1) as "µÇ¼´ÎÊý", arbitrary(client_ip) as "¿ÉÒÉ¿Í»§¶Ë£¨ÑùÀý£©" , '²é¿´IPÐÅÏ¢' as "²Ù×÷" where ip_to_country(client_ip) <> 'Öйú' and security_check_ip(client_ip) = 1 group by target order by "µÇ¼´ÎÊý" DESCSelect "1 hour" for the "Time" to see a list of abnormal logon events:
Configure drill down: Click "+" next to the "Operation" list, open "Drill Down", select "Custom HTTP Link", and configure as www.ip138.com/ips138.asp?ip=${suspicious client (example)}&action=2, as follows:
Select the form and click "Add to Dashboard": select the existing dashboard My security dashboard and name it "Abnormal logon events".
Reference: See the pre-configured "quick query": abnormal logons.
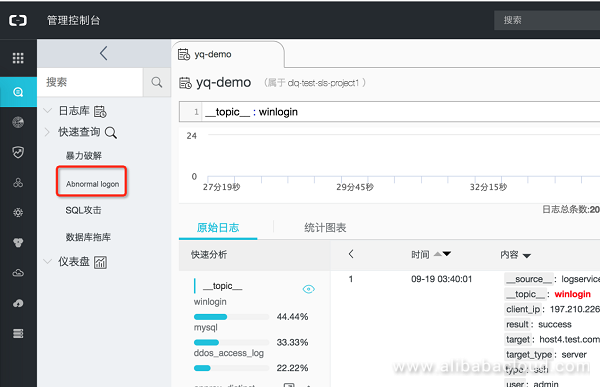
Task: Build a logon dashboard with a map chart, add potential risks to the dashboard, and refine the layout.
Key steps:
Enter the following query analysis statement (double click to select all and copy):
__topic__: winlogin and result: success | select ip_to_country(client_ip) as country, count(1) as "³É¹¦µÇ¼´ÎÊý" group by countrySelect "1 hour" for the "Time" to see the distribution of logon events based on the source country, and select "World Map" under "Map" in "Chart Type":
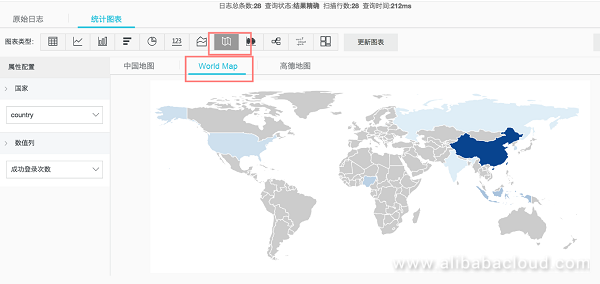
Select the form and click "Add to Dashboard": select the existing dashboard My security dashboard and name it "Logon event distribution".
Go to "My Security Dashboard" in the "View" and click the "Edit" to adjust the layout:
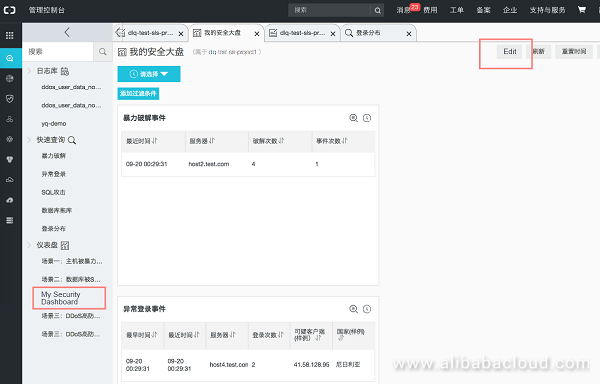
Reference: See the pre-configured "Dashboard": Scenario 1:...
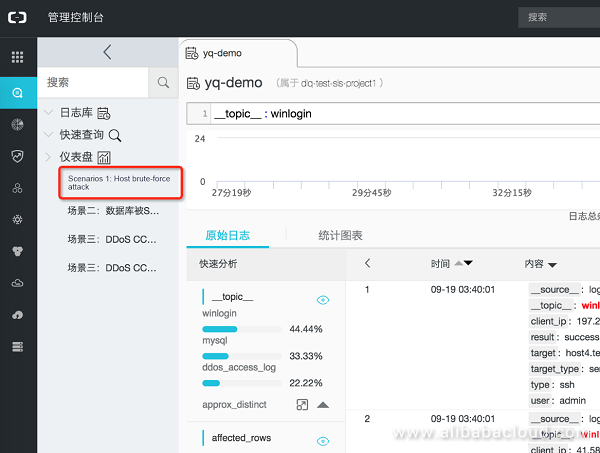
Enter the following command on the query page to see the SQL execution logs in MySQL:
__topic__ : mysqlThe log structure is as follows:
__topic__:  mysql      // log topic: the SQL execution log is for MySQL
sql:  SELECT * FROM accounts WHERE id >= 20000
         and id < 30000 limit 10000   // executed SQL statement
target:  db1.abc.com   // database server
db_name:  crm_system   // database
table_name:  accounts  // table
sql_type:  select      // SQL statement type: select, update, delete, etc.
user:  op_user1        // SQL statement executor
client_ip:  1.2.3.4    // IP address of the client for the execution
affected_rows:  10000  // affected function, for example, the returned rows
response_time: 1210 // response time of the execution (ms)Task: Identify SQL attacks through SQL parsing
Logic: A hacker executes a series of SQL statements through an acquired database account (or through SQL injection) to drop a virus to the server disk. (for example, dumpfile into)
Key steps:
Enter the following query analysis statement (double click to select all and copy):
__topic__: mysql | select date_format(__time__, '%m-%d %H:%i:%s') as "ʱ¼ä", 'ÎļþдÈë' as "¹¥»÷ÀàÐÍ", client_ip as "¿Í»§¶Ë", concat(db_name, table_name) as "Êý¾Ý¿â", target as "·þÎñÆ÷", sql as "¹¥»÷SQL" where regexp_like(sql, '(?i).+into\s+dumpfile\b.+')Select "1 hour" for the "Time" to see a list of SQL attack events:

Select the form and click "Add to Dashboard": select the existing dashboard My security dashboard and name it "SQL attack events".
Reference: See the pre-configured "quick query": SQL attacks.
Task: Identify database export through SQL statistics
Logic: A hacker retrieves important tables (such as account and order information) by acquiring a database account and executing a series of SELECT statements.
Key steps:
Enter the following query analysis statement (double click to select all and copy):
__topic__: mysql and sql_type: select | SELECT date_format(min_by(__time__, __time__), '%m-%d %H:%i:%s') as "ÍϿ⿪ʼʱ¼ä", max_by(__time__, __time__)-min_by(__time__, __time__) as "ÍÏ¿âºÄʱ(Ãë)", db_name as "Êý¾Ý¿â", table_name as "±í¸ñ", sum(affected_rows) as "ÍÏ¿âÐÐÊý", arbitrary(sql) as "ÍÏ¿âSQL(ÑùÀý)", arbitrary(client_ip) as "¿Í»§¶Ë(ÑùÀý)" group by db_name, table_name HAVING "ÍÏ¿âÐÐÊý" > 200Select "1 hour" for the "Time" to see a list of database export events:

Select the form and click "Add to Dashboard": select the existing dashboard My security dashboard and name it "Database export events".
Reference: See the pre-configured "quick query": Database export.
Task: Adjust the layout of [My Security Dashboard] in combination with the previous rules
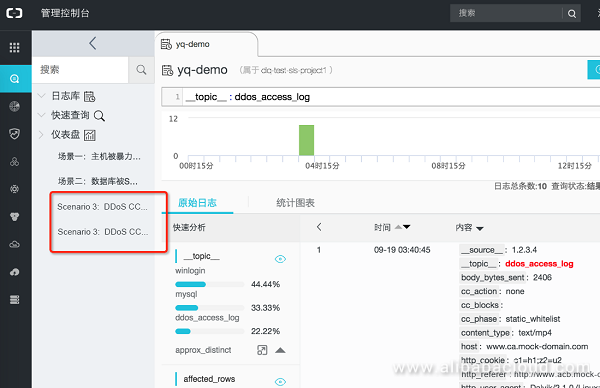
Reference: See the pre-configured dashboard: Scenario 2:...
Enter the following command on the query page to see the Anti-DDoS Pro access and attack logs:
__topic__ : ddos_access_logSee Anti-DDoS Pro Log format.
Task: View CC attack target sites and features
Logic: CC attack logs can be obtained through cc_blocks > 0
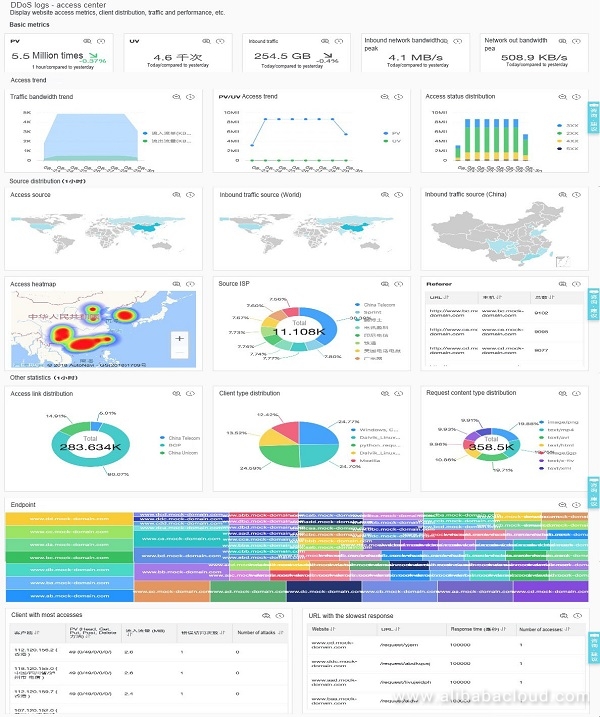
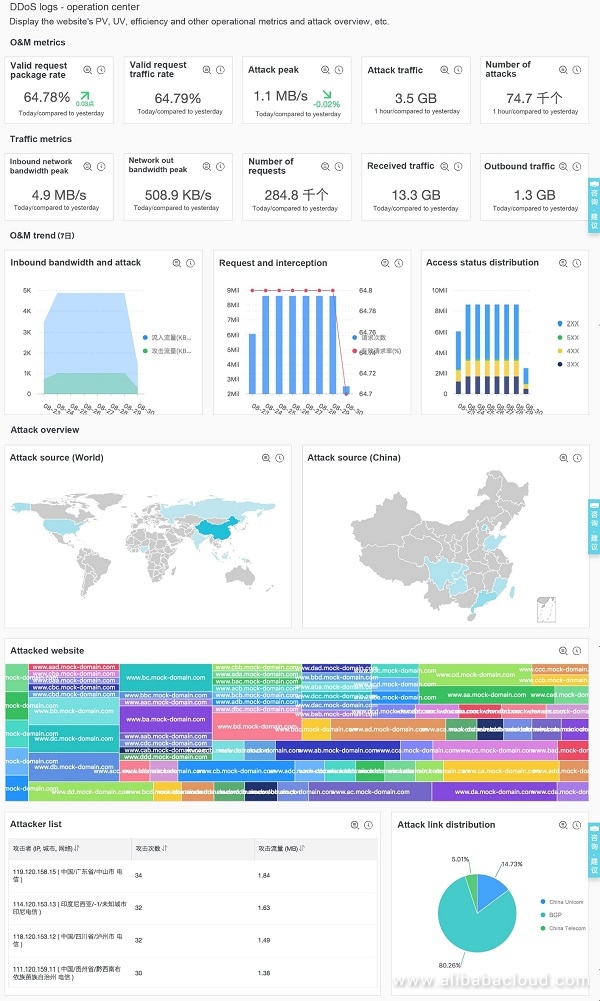
Reference: You can refer to the prepared Scenario 3:... DDoS operation center and Access center dashboard.
View the existing dashboard, modify and adjust the DDoS security dashboard:
Preview:
Alibaba Cloud Storage - December 3, 2018
Alipay Technology - August 21, 2019
ApsaraDB - April 3, 2019
Alibaba Clouder - September 26, 2018
Alibaba Clouder - October 26, 2020
Alibaba Clouder - June 8, 2020
 Anti-DDoS
A comprehensive DDoS protection for enterprise to intelligently defend sophisticated DDoS attacks, reduce business loss risks, and mitigate potential security threats.
Learn More Simple Log Service
An all-in-one service for log-type data
Learn More Anti DDoS Basic
A cloud-based security service that protects your data and application from DDoS attacks
Learn More Security Center
A unified security management system that identifies, analyzes, and notifies you of security threats in real time
Learn MoreMore Posts by wjo1212