Node.js is an ideal language for implementing the Building-a-Backend-for-Frontend (BFF) layer to support development and maintenance for microservices. However, the Node.js runtime is relatively new to most developers. Moreover, no tools in the ecological chain are available to guarantee the stability of the BFF layer. Therefore, you need to consider several issues. For example, you need to consider how to locate and process problems if memory leaks cause some processes to experience intermittent OOM.
To analyze and locate memory leak problems, first we need to obtain the objects and the reference relationship between them in the heap when a Node.js process experiences a memory leak. A heap snapshot is the file where the objects in the heap and the reference relationship are saved. The V8 engine provides an interface that allows you to easily obtain heap snapshots in real time.
In Node.js Performance Platform, the task of obtaining heap snapshots has been integrated into the runtime. After an application is connected to the platform, heap snapshots of processes can be obtained online for analysis, without having to modify business code.
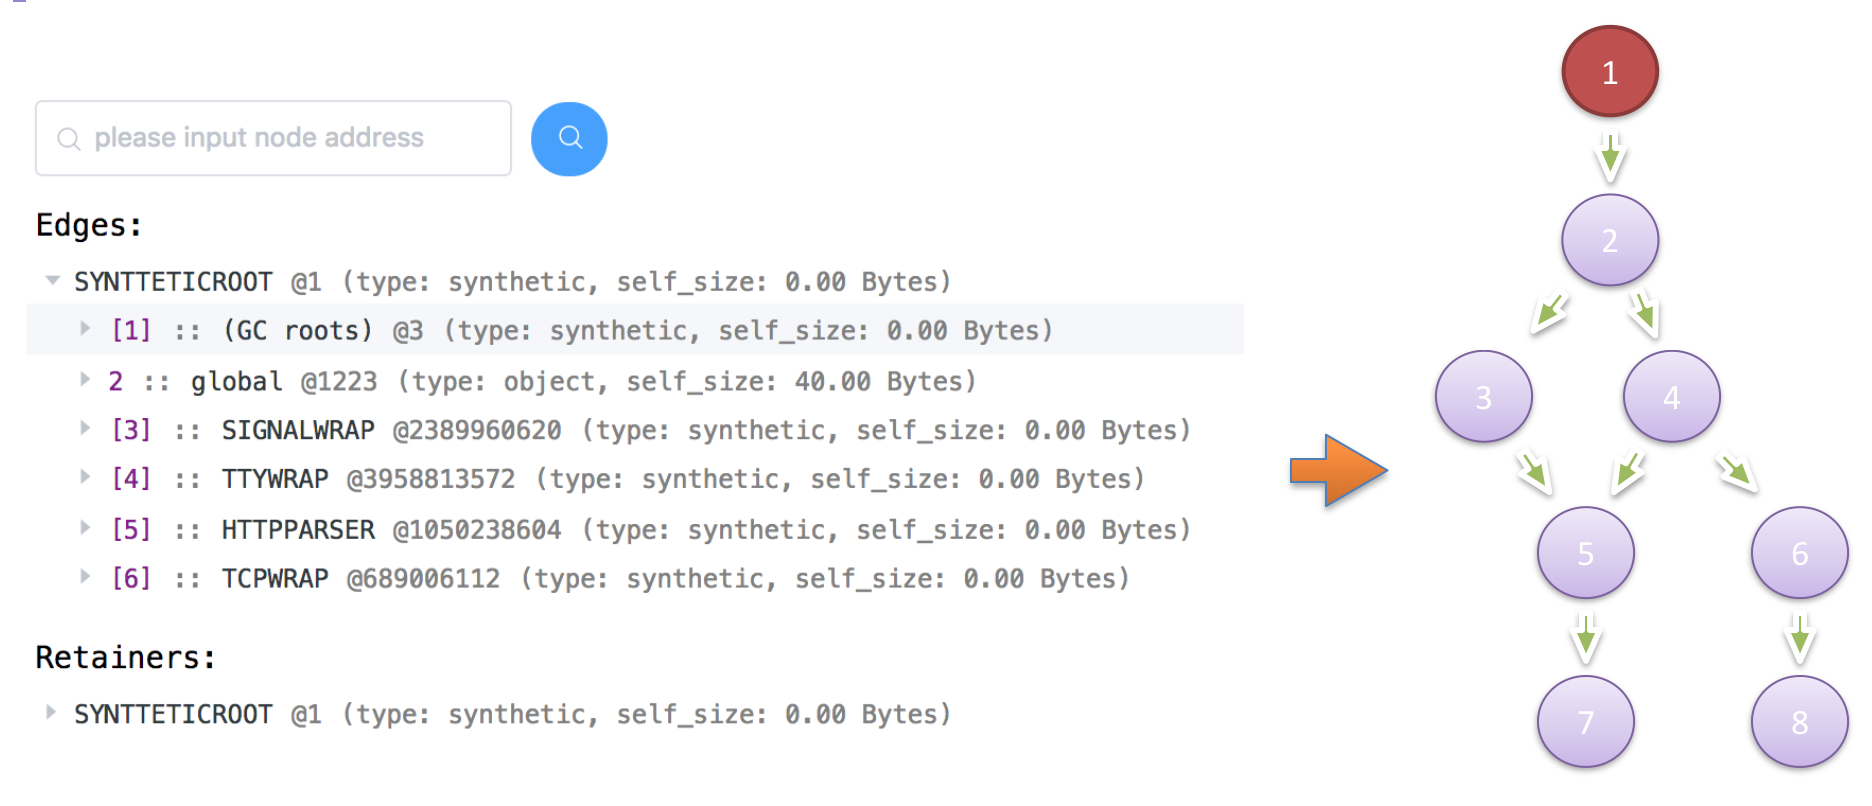
A memory relation graph like this:
Assume that node 5 is where a memory leak happens. Node 5 consumes significant memory and does not release it as expected. If we release parent node 3 of node 5, node 5 can still be reached by following the path 1 -> 2 -> 4 -> 5 from the root node. That is, releasing node 3 alone cannot terminate the reference to node 5. Similarly, releasing node 4 does not work, either.
In this example, we can only release node 5 by stopping the reference to node 2. In other words, node 2 is the node that directly controls node 5, because every path from node 1 to node 5 goes through node 2. This structure is called a dominator tree. It is helpful for analyzing memory leaks.
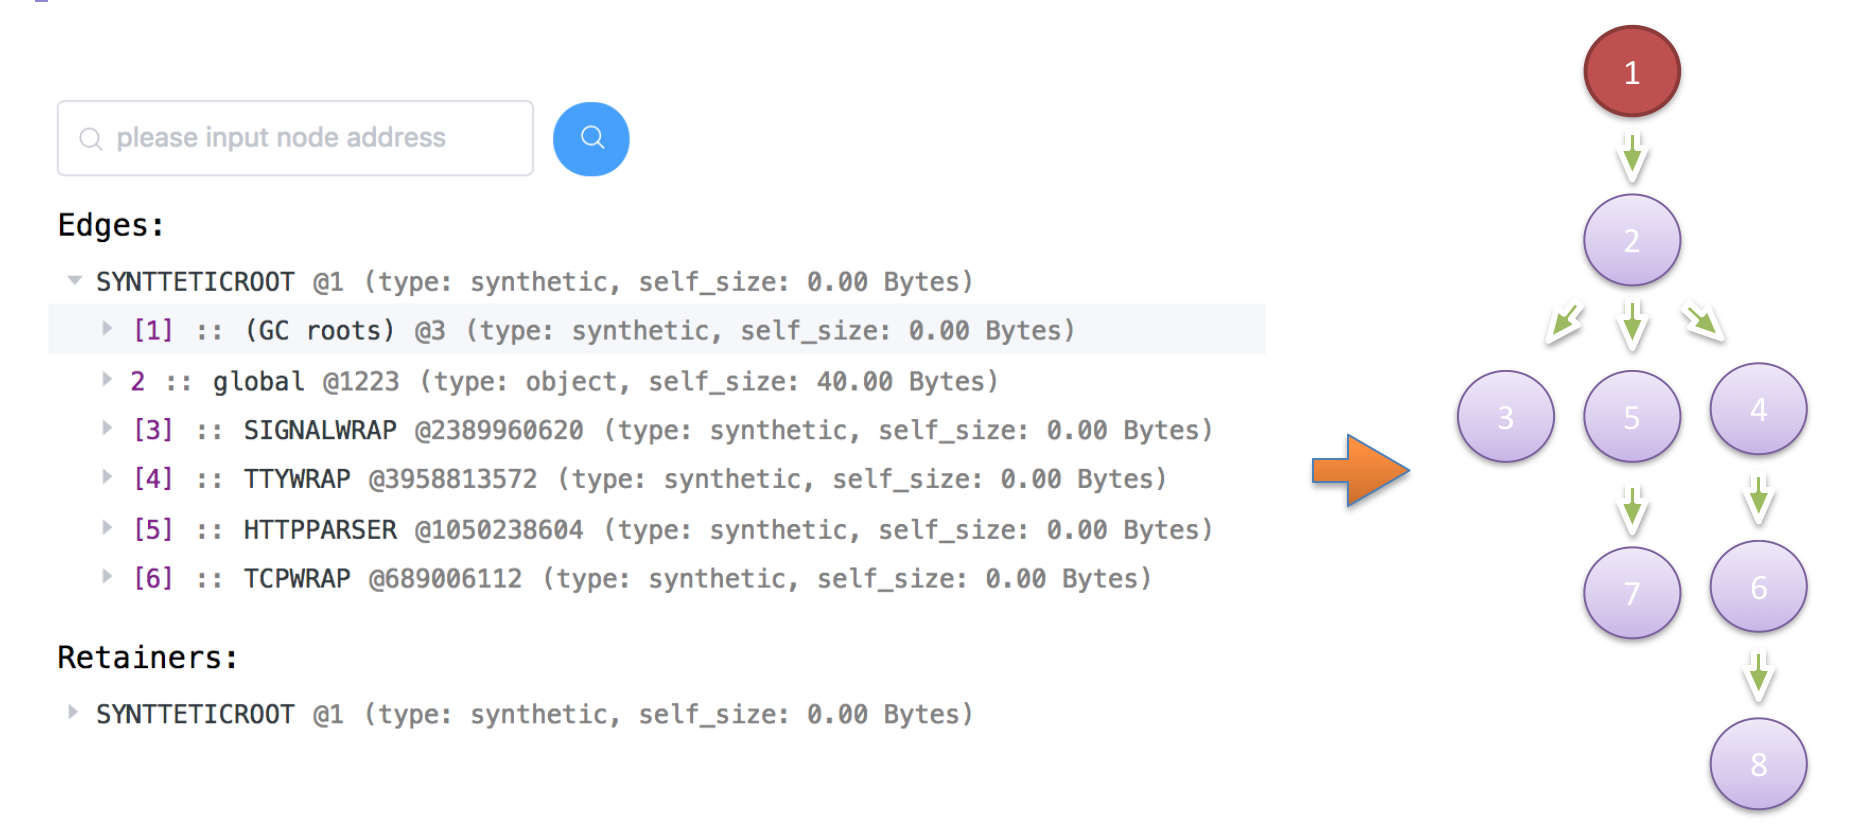
We can convert the preceding memory relation graph to a dominator tree like this:

Now we can calculate the retained size from node 8 up to the root node. The retained size for a node equals the size of that node itself plus the retained size of its child node. Finally, we can see which nodes have memory consumption accumulated. These nodes that have memory consumption accumulated instead of being deallocated are likely candidates for memory leaks.
After we know where memory leaks happen, we can find the corresponding code logic snippet in the memory relation graph to see if these nodes really fail to deallocate memory unexpectedly.
For details, you can go to Locate Online Node.js Memory Leaks.
This article analyzes and looks into how to solve the problem of memory leaks causes by co and recursive calls.
From the successfully generated heap snapshot file, we could roughly see where the memory leak was. However, accurately locating the problem still needed some effort.
Although the heap snapshot analysis didn't go smoothly on the Node.js Performance Platform, we finally located the cause of this problem. Now that we know the cause, let's see how we can solve this problem.
In this Node.js troubleshooting series, we will describe the features and best practices of Node.js Performance Platform for Node.js applications.
Memory Leaks
Like a high CPU usage alert, when you receive an alert saying that a Node.js application process is taking heap memory usage higher than the configured threshold percentage, you also no longer need third-party modules like heapdump to export heap snapshots for analysis. Similarly, you can just click Heap Snapshot for the corresponding instance in the console to generate heap snapshots of the desired Node.js process.
In most cases, you can use the Search view and the Retainers together to find where a specified object is generated in the JavaScript code. In the cluster view, it is easy and convenient to find out which objects are using heap space. You can then further analyze online memory leaks and find the problematic code accordingly.
Alibaba Introduces Brand Databank: Data Can Appreciate and Be Deposited like Monetary Funds
Double 11 with Alibaba Cloud: $1B Gross Merchandise Volume in 68 Seconds with Zero Downtime

2,593 posts | 793 followers
Followhyj1991 - July 22, 2019
hyj1991 - June 20, 2019
hyj1991 - July 22, 2019
hyj1991 - June 20, 2019
Alibaba Clouder - November 25, 2019
hyj1991 - June 20, 2019

2,593 posts | 793 followers
Follow Application Real-Time Monitoring Service
Build business monitoring capabilities with real time response based on frontend monitoring, application monitoring, and custom business monitoring capabilities
Learn More Simple Log Service
An all-in-one service for log-type data
Learn More CloudMonitor
Automate performance monitoring of all your web resources and applications in real-time
Learn MoreMore Posts by Alibaba Clouder