Redis是目前流行的高性能key-value数据库,但如果使用不当,很容易出现慢查询。慢查询过多或者一个时间较长(例如20s)的慢查询会导致操作队列(Redis是单进程)堵塞,可能会导致服务不可用。因此您需要实时收集并分析Redis slowlog,在出现问题时快速定位解决。本文介绍如何通过Elasticsearch和rsbeat实时分析Redis slowlog。
背景信息
通过Elasticsearch和rsbeat实时分析Redis slowlog的原理为:使用rsbeat将Redis slowlog采集到Elasticsearch中,然后在Kibana中进行图形化分析。相关概念说明如下:
-
Elasticsearch:是一个基于Lucene的实时分布式的搜索与分析引擎,是遵从Apache开源条款的一款开源产品,是当前主流的企业级搜索引擎。它提供了一个分布式服务,可以使您快速的近乎于准实时的存储、查询和分析超大数据集,通常被用来作为构建复杂查询特性和需求强大应用的基础引擎或技术。
阿里云Elasticsearch兼容开源Elasticsearch的功能,以及Security、Machine Learning、Graph、APM等商业功能,致力于数据分析、数据搜索等场景服务,支持5.5.3、6.3.2、6.7.0、6.8.0和7.4.0等版本,并提供了商业插件X-Pack服务。在开源Elasticsearch的基础上提供企业级权限管控、安全监控告警、自动报表生成等功能。本文使用阿里云Elasticsearch进行演示,详情请参见什么是阿里云Elasticsearch。
-
rsbeat:用来收集和分析Redis慢日志的采集器,详情请参见rsbeat官方文档。
-
Redis:是一个开源的、基于内存的数据结构存储器,可以用作数据库、缓存和消息中间件,详情请参见Redis官方说明。
云数据库Redis版(ApsaraDB for Redis)是兼容开源Redis协议标准、提供内存加硬盘的混合存储方式的数据库服务,基于高可靠双机热备架构及可平滑扩展的集群架构,满足高读写性能场景及弹性变配的业务需求。本文使用云数据库Redis版进行演示,更多详情请参见什么是云数据库 Tair(兼容 Redis)。
操作流程
-
创建阿里云Elasticsearch实例、云数据库Redis版实例(以下简称Redis实例)和ECS实例,三者在同一专有网络VPC(Virtual Private Cloud)下。
-
根据需求设置Redis slowlog生成的条件,以及可记录的slowlog的最大条数。
-
在ECS中安装rsbeat,并在其配置文件中指定Redis和Elasticsearch服务。
-
通过Kibana查看日志详细信息,并根据需求进行统计分析。
准备工作
-
创建阿里云Elasticsearch实例,并开启自动创建索引功能。
具体操作步骤请参见创建阿里云Elasticsearch实例和配置YML参数。本文使用的实例版本为通用商业版6.7。
-
创建Redis实例。
具体操作步骤请参见步骤1:创建实例。本文使用的实例版本为Redis 5.0社区版,并且与阿里云Elasticsearch实例在同一VPC下,便于内网访问。
-
创建ECS实例。
具体操作步骤请参见自定义购买实例。本文使用的实例镜像为CentOS 7.6 64位,并且与Redis和Elasticsearch实例在同一VPC下。
-
配置Redis实例的访问白名单。
将ECS实例的内网IP地址添加到Redis实例的白名单中,具体操作步骤请参见设置IP白名单。
步骤一:配置Redis慢查询参数
-
登录Redis管理控制台。
-
在顶部菜单栏处,选择地域。
-
在实例列表页面,单击目标实例ID。
-
在左侧导航栏,单击参数设置。
-
在参数设置列表中,找到slowlog-log-slower-than和slowlog-max-len参数,将其修改为您期望的值。
参数
说明
示例
slowlog-log-slower-than
当命令执行时间(不包括排队时间)超过该参数值时,该命令会被定义为慢查询,并记录到slowlog中。单位为微秒,默认为10000,即10毫秒。
重要负数表示关闭慢查询日志功能,0表示记录所有命令操作。
本文将该参数值设置为20000。表示在slowlog中记录执行时长超过20毫秒的命令。
slowlog-max-len
slowlog中可以记录的最大慢查询命令的条数。当slowlog中的记录数超过最大值后,Redis会将最早的slowlog删除。
本文将该参数值设置为100。表示在slowlog中记录最近100条慢查询命令。
步骤二:安装并配置rsbeat
-
连接ECS实例。
具体操作步骤请参见连接实例。
-
下载并且解压rsbeat。
本文使用5.3.2版本。
wget https://github.com/Yourdream/rsbeat/archive/master.zip unzip master.zip -
修改rsbeat配置。
-
执行以下命令打开rsbeat.yml文件。
cd rsbeat-master vim rsbeat.yml -
按照以下说明修改rsbeat和output.elasticsearch参数配置,并保存。
################################ Rsbeat ######################################

rsbeat:
  # Defines how often an event is sent to the output
  period: 1s
  redis: ["r-xxx.redis.rds.aliyuncs.com:6379"]
  slowerThan: 100

#================================ General =====================================

# The name of the shipper that publishes the network data. It can be used to group
# all the transactions sent by a single shipper in the web interface.
#name:

# The tags of the shipper are included in their own field with each
# transaction published.
#tags: ["service-X", "web-tier"]

# Optional fields that you can specify to add additional information to the
# output.
#fields:
#  env: staging

#============================== Outputs =======================================

# Configure what outputs to use when sending the data collected by the beat.
# Multiple outputs may be used.

#-------------------------- Elasticsearch output ------------------------------
output.elasticsearch:
  # Array of hosts to connect to.
  hosts: ["es-cn-xxx.elasticsearch.aliyuncs.com:9200"]

  # Optional protocol and basic auth credentials.
  #protocol: "https"
  username: "elastic"
  password: "xxx"

  # Overwrite existing template
  template.overwrite: true
表 1. rebeat配置 参数
说明
period
每隔多久将slowlog输出到Elasticsearch。
redis
Redis实例的连接地址,获取方式请参见查看连接地址。
重要由于配置文件中没有定义Redis实例的密码,因此在获取连接地址后,您还需要开启免密访问,才能确保rsbeat能够访问Redis实例,开启方法请参见开启专有网络免密访问。
slowerThan
定义将
config set slowlog-log-slower-than命令发送到Redis服务器的时间。单位为微秒。表 2. output.elasticsearch配置 参数
说明
hosts
阿里云Elasticsearch实例的连接地址,可在实例的基本信息页面获取,详情请参见查看实例基本信息。
username
阿里云Elasticsearch实例的访问用户名,默认为elastic。
password
对应用户的密码。elastic用户的密码在创建实例时设定,如果忘记可重置,重置密码的注意事项和操作步骤请参见重置实例访问密码。
template.overwrite
是否覆盖已存在的同名模板,默认为true。
-
-
启动rsbeat服务。
./rsbeat.linux.amd64 -c rsbeat.yml -e -d "*"
步骤三:通过Kibana图形化分析slowlog
-
登录目标阿里云Elasticsearch实例的Kibana控制台。
具体操作步骤请参见登录Kibana控制台。
-
创建索引模式。
- 在左侧导航栏,单击Management。
- 在Kibana区域,单击Index Patterns。
- 单击Create index pattern。
-
输入Index pattern名称,单击Next step。
- 从Time Filter field name中,选择时间过滤器字段名(本文选择@timestamp)。
- 单击Create index pattern。
-
查看slowlog的详细信息。
-
在左侧导航栏,单击Discover。
-
在Discover页面左侧,选择目标索引模式rsbeat-*。
-
在页面右上角,选择一段时间,查看该时间段内的slowlog信息。
在 Kibana 的 Discover 页面,索引模式选择
rsbeat-*,时间范围选择 Last 24 hours,即可查看该时间段内的 slowlog 记录。页面显示命中结果数量、按时间分布的柱状图,以及包含cmd、ipPort、slowId、key、duration等字段的日志条目列表。
-
-
统计slowlog数量最多的前10个key,并以降序排列展示。
-
在左侧导航栏,单击Visualize。
-
在Visualize页面,单击
 图标。
图标。 -
在New Visualization对话框中,单击Pie。
-
选择索引模式rsbeat-*。
-
按照以下说明配置 Metrics 和 Buckets。
Metrics 配置:
-
Slice Size:Aggregation 选择 Count,Custom Label 填写
slowlog数量
Buckets 配置:
-
Split Slices:Aggregation 选择 Terms,Field 填写
key,Order By 选择 metric: slowlog数量,Order 设为 Descend,Size 设为10
-
-
单击
 图标,查看结果。
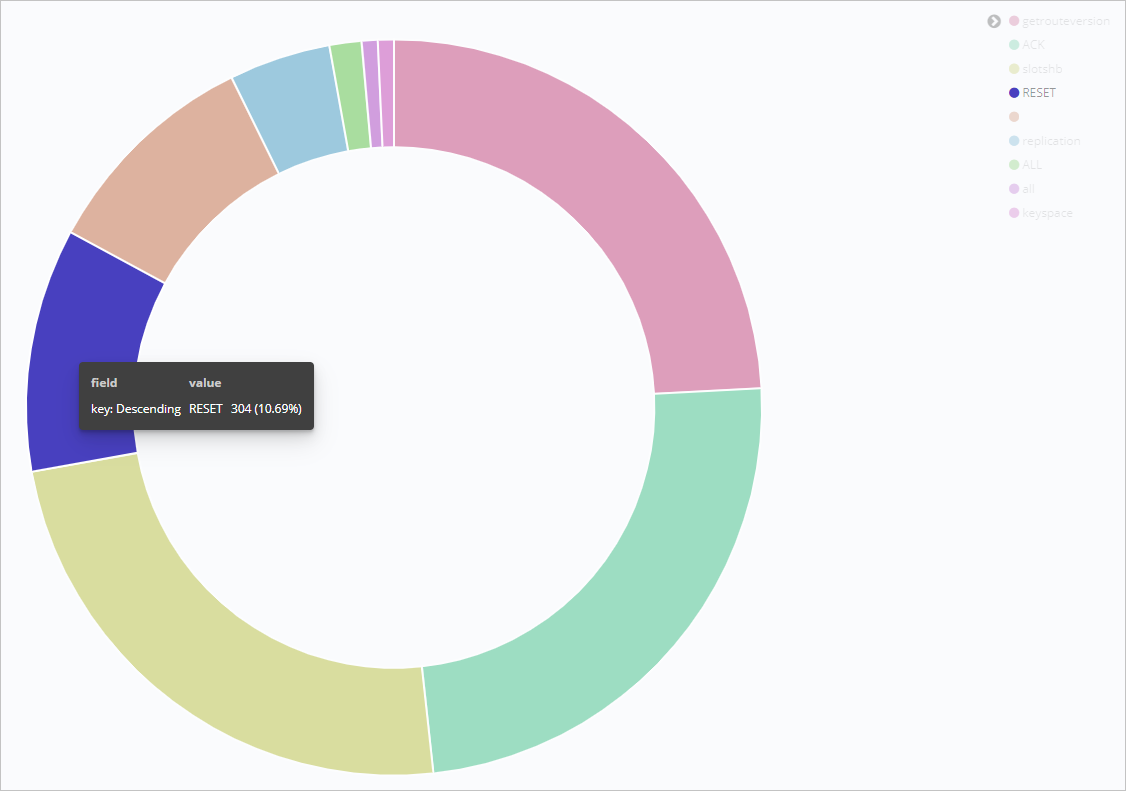 说明
说明更多Kibana的使用方法,请参见Kibana官方文档。
-