全部产品
Search
文档中心

云消息队列 RabbitMQ 版:秒级指标数据的生成方法

更新时间:Jun 11, 2026

本文为您介绍如何使用日志管理功能生成秒级指标数据。

背景信息

当前云监控提供的图表是分钟级统计数据的平均值,无法展示秒级的TPS统计数据。云消息队列 RabbitMQ 版的TPS统计了每秒Client主动发起的AMQP协议方法请求数量。

TPS统计的AMQP协议请求方法如下:

  • ConnectionOpenChannelOpen

  • QueueDeclareQueueDeleteQueueBindQueueUnbind

  • ExchangeDeclareExchangeDelete

  • ExchangeBindExchangeUnBind

  • SendMessageBasicConsumeBasicGetBasicAckBasicRejectBasicNackBasicRecover

关于请求方法的详细描述,请参见请求方法

操作步骤

  1. 开启日志管理功能并配置索引

  2. 创建Metric时序库,用于存储清洗出来的指标数据。

    1. 日志服务控制台的Project详情页面,选择立即创建。此时页面显示当前project暂无时序库的空白状态。

    2. 创建MetricStore面板中设置Metric时序库的基本信息。主要配置参数包括名称(Metric时序库名称)和数据保存时间(默认30天)等。

  3. 创建清洗任务。

    1. 在logstore中输入查询语句,以实例错误码为例。

      * | SELECT Code, count(*) as num, microtime / 1000 / 1000 as timeSecond group by Code, timeSecond limit 1000000

      上述语句格式为:查询语句|分析语句,前者为条件的筛选,后者为标准的SQL语法。从查询结果中清洗出以下三项内容即可写入Metric时序库:您需要的Label;各个Label下的指标值;时间。以本语句为例,Code对应Label,代表各个请求的返回码;num对应各个Code的值;timeSecond对应时间,单位为秒。

      查询结果如下所示:查询结果以表格形式展示,包含Code(返回码)、num(计数)和timeSecond(秒级时间戳)三列数据。

    2. 在查询结果中,单击统计图表页签中的另存为定时SQL,在计算配置页签中配置以下参数,然后单击下一步。其中SQL类型选择搜索分析写入模式选择导入新数据,并根据SQL中的字段配置写入列名映射

      说明

      目标库应选择上文中已创建的Metric时序库。

    3. 调度配置页签中设置调度时间间隔,然后单击确定。其中调度间隔可选择每小时或自定义间隔,SQL超时默认为600秒,延迟执行默认为60秒。

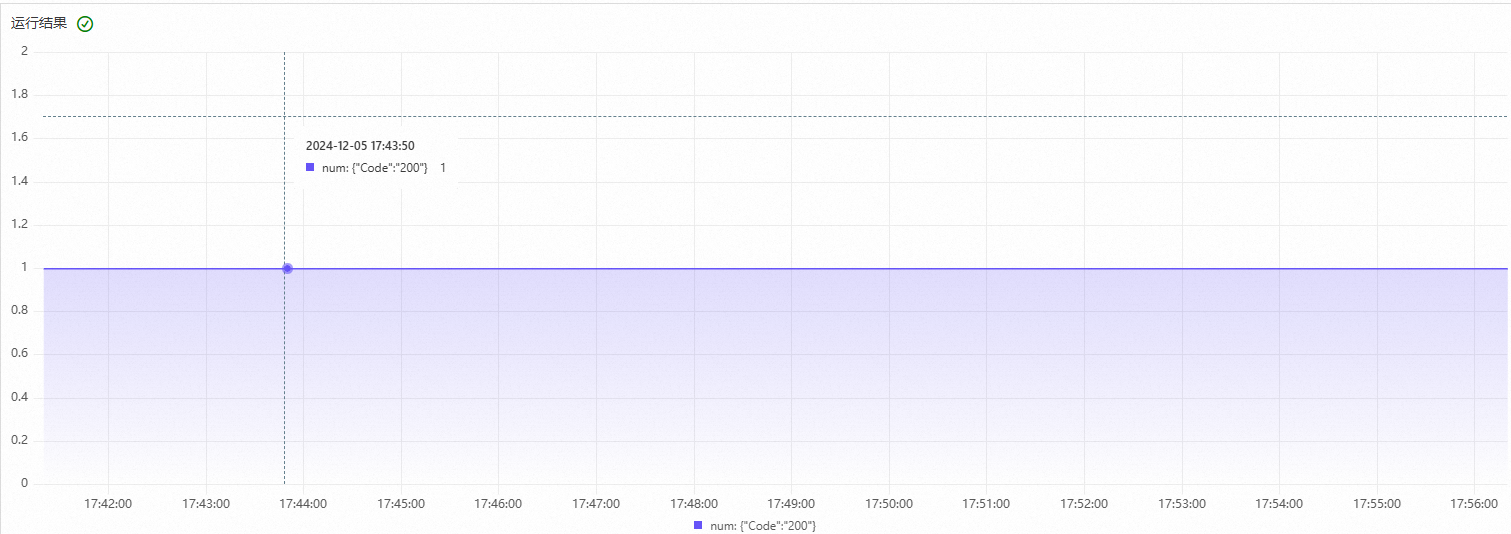
  4. 在Metric时序库中查询指标数值分布。在左侧导航栏选择目标Metric时序库,进入查询页面输入查询语句并执行。

    查询结果如下所示:image

  5. 可选:将Metric时序库中的数据作为数据源接入可视化图表大盘,大盘展示可选用Grafana或日志服务的可视化能力。

说明

以上教程以清洗实例错误码数据为例,您也可以清洗其他数据,例如每个RemoteAddress的每个Channel的消息收发速度、每秒钟每个队列的活跃情况、每秒钟的总消息发送条数和接收条数、每秒钟各个API的调用次数等。

常用语句

查询实例秒级TPS指标数据

* | select microtime/1000/1000 as time, sum(count) as tps 
from 
  (SELECT  microtime, if(Action!='SendMessage', 1, tps) as count 
   from log 
   Where  InstanceId='amqp-xx-xxx' 
     and Action in ('SendMessage', 'ConnectionOpen', 'ChannelOpen', 'ExchangeDeclare', 'QueueBind', 'QueueDeclare', 'QueueDelete', 'ExchangeDelete', 'QueueUnBind', 'ExchangeBind', 'ExchangeUnBind', 'BasicConsume', 'BasicReject', 'BasicRecover', 'BasicAck', 'BasicNAck', 'PullMessage') 
   limit 90000000) 
  
GROUP by time ORDER by time limit 90000000

查询结果如下所示:

查询结果以表格形式展示,包含time(秒级时间戳)和tps(每秒请求数)两列数据,可切换至统计图表页签查看趋势图。

  • 查询前请将上文中的实例IDamqp-xx-xxx替换为待查询实例的ID。

  • 其中BasicNack(multiple=false),计TPS=1,BasicNack(multiple=true),计TPS=N,因此通过SLS日志配置统计出来的TPS值会小于实际发起的请求量。

  • 查询TPS流量图时,如果客户端的流量比较大,建议将查询的时间范围限制在1小时或是更小的范围,然后在SQL语句后面加上limit 90000000,或者limit取值尽可能大。

查询各exchange、routing key的消息发送总量

* and Action : SendMessage and Code : 200 | 
select 
  InstanceId as instance_id,
  VHost as virtual_host, 
  split_part(ResourceName,',',2) as exchange_name, 
  split_part(ResourceName,',',3) as routing_key, 
  count(*) as send_total_num 
group by 
  instance_id,
  virtual_host, 
  exchange_name, 
  routing_key 
order by 
  send_total_num 
limit 10000000

查询结果如下所示:

查询结果以表格形式展示,包含instance_id(实例ID)、virtual_host(虚拟主机)、exchange_name(Exchange名称)、routing_key(路由键)和send_total_num(发送总量)列。

查询各exchange、routing key的每秒消息发送速率

* and Action : SendMessage and Code : 200 | 
select 
  InstanceId as instance_id,
  VHost as virtual_host, 
  split_part(ResourceName,',',2) as exchange_name, 
  split_part(ResourceName,',',3) as routing_key, 
  microtime / 1000 / 1000 as time_second, 
  count(*) as send_qps 
group by 
  instance_id,
  virtual_host, 
  exchange_name, 
  routing_key,
  time_second 
order by 
  time_second, 
  send_qps 
limit 10000000

查询结果如下所示:

查询结果以表格形式展示,包含instance_idvirtual_hostexchange_namerouting_keytime_second(秒级时间戳)和send_qps(每秒发送速率)列。

查询各队列的消费消息量

* and Action : PushMessage and Code : 200 | 
select 
  InstanceId as instance_id,
  VHost as virtual_host, 
  Queue as queue_name, 
  count(*) as push_total_num 
group by 
  instance_id,
  virtual_host, 
  queue_name 
order by 
  push_total_num 
limit 10000000

查询结果如下所示:

查询结果以表格形式展示,包含instance_idvirtual_hostqueue_name(队列名称)和push_total_num(推送消息总量)列。

查询各队列的每秒消费消息速率

* and Action : PushMessage and Code : 200 | 
select 
  InstanceId as instance_id,
  VHost as virtual_host, 
  Queue as queue_name, 
  microtime / 1000 / 1000 as time_second, 
  count(*) as push_qps 
group by 
  instance_id,
  virtual_host, 
  queue_name, 
  time_second 
order by 
  time_second, 
  push_qps 
limit 10000000

查询结果如下所示:

查询结果以表格形式展示,包含instance_idvirtual_hostqueue_nametime_second(秒级时间戳)和push_qps(每秒消费速率)列。

查询各客户端的每秒消息发送量

* and Action : SendMessage and Code : 200 | 
select 
  InstanceId as instance_id,
  VHost as virtual_host, 
  RemoteAddress as client_ip_port, 
  microtime / 1000 / 1000 as time_second, 
  count(*) as send_qps 
group by 
  instance_id,
  virtual_host, 
  client_ip_port, 
  time_second 
order by 
  time_second, 
  send_qps 
limit 10000000

查询结果如下所示:

查询结果以表格形式展示,包含instance_idvirtual_hostclient_ip_port(客户端IP和端口)、time_secondsend_qps(每秒发送量)列。

查询各客户端的每秒消息消费量

* and Action : PushMessage and Code : 200 | 
select 
  InstanceId as instance_id,
  VHost as virtual_host, 
  RemoteAddress as client_ip_port, 
  microtime / 1000 / 1000 as time_second, 
  count(*) as push_qps 
group by 
  instance_id,
  virtual_host, 
  client_ip_port, 
  time_second 
order by 
  time_second, 
  push_qps 
limit 10000000

查询结果如下所示:

查询结果以表格形式展示,包含instance_idvirtual_hostclient_ip_porttime_secondpush_qps(每秒消费量)列。

查询各客户端某行为的每秒速率

如果需要查询某客户端对于某个行为的操作QPS,请复制下面的语句,并修改{action_name}为您需要查询的Action名称,具体Action名称包括:

  • ConnectionOpen、ChannelOpen

  • QueueDeclare、QueueDelete、QueueBind、QueueUnbind

  • ExchangeDeclare、ExchangeDelete

  • ExchangeBind、ExchangeUnBind

  • SendMessage、BasicConsume、BasicGet、BasicAck、BasicReject、BasicNack、BasicRecover

* and Action : {action_name} and Code : 200 | 
select 
  InstanceId as instance_id,
  VHost as virtual_host, 
  RemoteAddress as client_ip_port, 
  microtime / 1000 / 1000 as time_second, 
  count(*) as {action_name}_qps 
group by 
  instance_id,
  virtual_host, 
  client_ip_port, 
  time_second 
order by 
  time_second, 
  {action_name}_qps 
limit 10000000

例如,如果希望查询某客户端打开Connection的QPS,可使用如下语句:

* and Action : ConnectionOpen and Code : 200 | 
select 
  InstanceId as instance_id,
  VHost as virtual_host, 
  RemoteAddress as client_ip_port, 
  microtime / 1000 / 1000 as time_second, 
  count(*) as connection_open_qps 
group by 
  instance_id,
  virtual_host, 
  client_ip_port, 
  time_second 
order by 
  time_second, 
  connection_open_qps 
limit 10000000

查询结果如下所示:

查询结果以表格形式展示,包含instance_idvirtual_hostclient_ip_porttime_secondconnection_open_qps(每秒ConnectionOpen次数)列。

查询各Action的QPS

该语句能够一次性统计各客户端的所有Action QPS。

* and Code : 200 | 
select 
  InstanceId as instance_id,
  VHost as virtual_host,
  Action as action_type,
  RemoteAddress as client_ip_port, 
  microtime / 1000 / 1000 as time_second, 
  count(*) as action_qps
group by 
  instance_id,
  virtual_host,
  client_ip_port,
  action_type,
  time_second 
order by
  time_second, 
  action_qps
limit 10000000

查询结果如下所示:

查询结果以表格形式展示,包含instance_idvirtual_hostclient_ip_portaction_type(操作类型,如ExchangeDeclare、ConnectionOpen等)、time_secondaction_qps列。

查询各错误出现频次

* and not Code = 200 | 
select 
  Code as error_code,
  VHost as virtual_host,
  split_part(split_part(Info, '[', 1), 'Req', 1) as error_info,
  microtime / 1000 / 1000 as time_second,
  count(*) as error_num
group by 
  virtual_host,
  error_code,
  time_second,
  error_info
order by
  time_second, 
  error_num
limit 10000000

查询结果如下所示:

查询结果以表格形式展示,包含error_code(错误码)、virtual_hosterror_info(错误描述)、time_seconderror_num(错误次数)列。

查询平均消息体大小

* and Action : SendMessage and Code: 200 | 
select 
  InstanceId as instance_id, 
  VHost as virtual_host, 
  split_part(Queue, ';', 1) as queue_name, 
  microtime / 1000 / 1000 as time_second, 
  avg(cast(split_part(ResourceName, 'bodySize=', 2) as bigint)) as avg_body_size 
group by 
  instance_id, 
  virtual_host, 
  queue_name, 
  time_second 
order by 
  time_second, 
  avg_body_size 
limit 10000000

查询结果如下所示:

查询结果以表格形式展示,包含instance_idvirtual_hostqueue_nametime_secondavg_body_size(平均消息体大小,单位Byte)列。

查询各消息ID的推送次数

* and Action : PushMessage and Code : 200 | 
select 
  InstanceId as instance_id, 
  VHost as virtual_host, 
  split_part(split_part(ResourceName, ',', 1), '=', 2) as msg_id, 
  count(*) as push_times 
group by 
  instance_id, 
  virtual_host, 
  msg_id 
order by 
  push_times desc 
limit 1000000

查询结果如下所示:

查询结果以表格形式展示,包含instance_idvirtual_hostmsg_id(消息ID)和push_times(推送次数)列,结果按推送次数降序排列。