增量同步處理效能白皮書
通過本文您可以瞭解Tunnel增量效能測試的測試環境、測試載入器、測試方案、測試單位、測試結果概述以及測試細則等。
測試環境
-
Table Store執行個體
-
執行個體類型:高效能執行個體
-
執行個體地區:華東1(杭州)
-
執行個體地址:私網地址,避免網路的不確定性因素對測試造成的幹擾
-
-
測試機器配置
-
類型:阿里雲ECS
-
地區:華東1(杭州)
-
型號:共用通用型(mn4) ecs.mn4.4xlarge
-
配置:
-
CPU:16核
-
記憶體:64 GB
-
網卡:Red Hat、Inc Virtio network device
-
作業系統:CentOS 7u2
-
-
測試載入器
-
壓力器
壓力器使用Table Store內部使用的壓力測試工具進行資料的批量並發寫入,底層基於Table StoreJava SDK的BatchWrite操作完成。
-
預分區工具
使用Table Store內部使用的壓力測試工具,配置好表名和分區數等資訊,進行表格的自動建立和預分區。
-
速率統計器
增量的即時消費速率統計基於Tunnel Java SDK完成,在傳入的Callback中加入類似的速率統計邏輯,進行速率和消費總行數的即時統計。
樣本
private static final Gson GSON = new Gson();
private static final int CAL_INTERVAL_MILLIS = 5000;
static class PerfProcessor implements IChannelProcessor {
    private static final AtomicLong counter = new AtomicLong(0);
    private static final AtomicLong latestTs = new AtomicLong(0);
    private static final AtomicLong allCount = new AtomicLong(0);
    @Override
    public void process(ProcessRecordsInput input) {
        counter.addAndGet(input.getRecords().size());
        allCount.addAndGet(input.getRecords().size());
        if (System.currentTimeMillis() - latestTs.get() > CAL_INTERVAL_MILLIS) {
            synchronized (PerfProcessor.class) {
                if (System.currentTimeMillis() - latestTs.get() > CAL_INTERVAL_MILLIS) {
                    long seconds = TimeUnit.MILLISECONDS.toSeconds(System.currentTimeMillis() - latestTs.get());
                    PerfElement element = new PerfElement(System.currentTimeMillis(), counter.get() / seconds, allCount.get());
                    System.out.println(GSON.toJson(element));
                    counter.set(0);
                    latestTs.set(System.currentTimeMillis());
                }
            }
        }
    }
    @Override
    public void shutdown() {
        System.out.println("Mock shutdown");
    }
}
測試方案
使用Tunnel進行資料同步時,在單Channel間是串列同步(串列是為了保障使用者資料的有序性),不同Channel間是相互並行的。在增量情境下,Channel數和表的分區數是相等的。由於Tunnel的整體效能和表的分區數有很大的關聯性,所以在本次的效能測試中,將主要考慮不同分區數(Channel數)對於Tunnel增量的同步速率的影響。
-
分區數會隨著資料規模自動成長,如您需要預先建立分區,請聯絡Table Store支援人員。
-
多台機器消費是自動進行的,每台機器用相同tunnelid啟動Tunnel用戶端即可,詳情參見資料消費架構原理。
-
測試情境
我們將主要測試以下情境。
-
單機同步單分區
-
單機同步4個分區
-
單機同步8個分區
-
單機同步32分區
-
單機同步64分區
-
2台機器同步64分區
-
2台機器同步128分區
說明上述測試情境不是產品能力的極限測試,對錶格儲存服務端的整體壓力較小。
-
-
測試步驟
-
建立資料表並進行預分區(不同分區數的測試都會有單獨的一張表)。
-
建立增量通道。
-
使用壓力器進行增量資料的寫入。
-
使用速率統計器進行QPS的即時統計,同時觀察程式佔用的系統資源(CPU、記憶體等)。
-
通過監控獲得增量資料同步消耗的總網路頻寬。
-
-
測試資料說明
範例資料由4個主鍵和1~2個屬性列組成,單行的大小在220位元組左右。第一主鍵(分區鍵)會使用4-Byte-Hash的方式產生,這樣可以確保壓測資料比較均勻的寫入到每個分區上。
範例資料的 4 個主鍵列分別為 uid、name、class、time,屬性列為 col0 和 col1。其中 name 和 class 列為隨機字串,time、col0 和 col1 列為 13 位時間戳記。
測試單位
本次測試主要包含以下幾項指標。
-
QPS(row):每秒同步的資料行數。
-
Avg Latency(ms/1000行):同步1000行資料所需的時間,單位為毫秒。
-
CPU(核):資料同步消耗的單核CPU總數。
-
Mem(GB):資料同步消耗的物理總記憶體。
-
頻寬(MBps):資料同步消耗的總網路頻寬。
本次效能測試不是產品能力的極限,是從實際使用角度出發進行的效能測試。
測試結果
該部分主要概述各個情境下的指標測試結果,測試的細節可以參見測試細則部分。
-
QPS和延遲
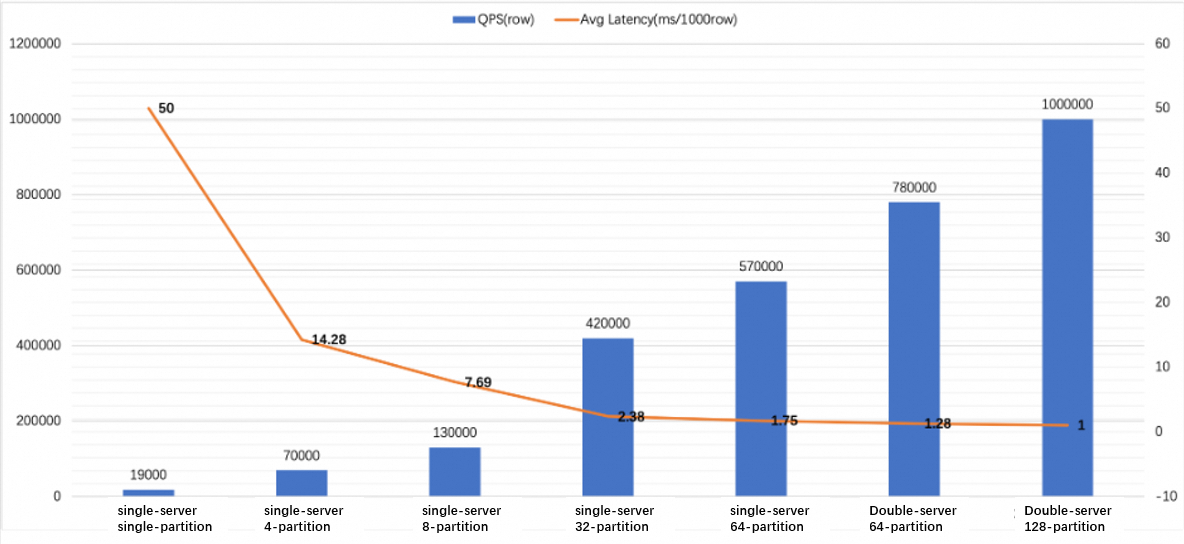
下圖展示的是各個情境下每秒同步的資料行數和同步1000行資料所需的時間。從圖中我們看出QPS的增長和分區數的增加呈線性關係。
在本次測試中,單機同步64分區情境下,將千兆的網卡成功打爆(參見測試細則部分),導致只有57萬的QPS。兩台機器對64分區進行同步後,平均QPS成功達到了78萬行左右,約等於單機-32分區情境下(42萬)的兩倍速率。而在最後的兩台機器-128分區情境下,Tunnel增量同步處理的QPS也成功達到了100萬行。
-
系統資源消耗
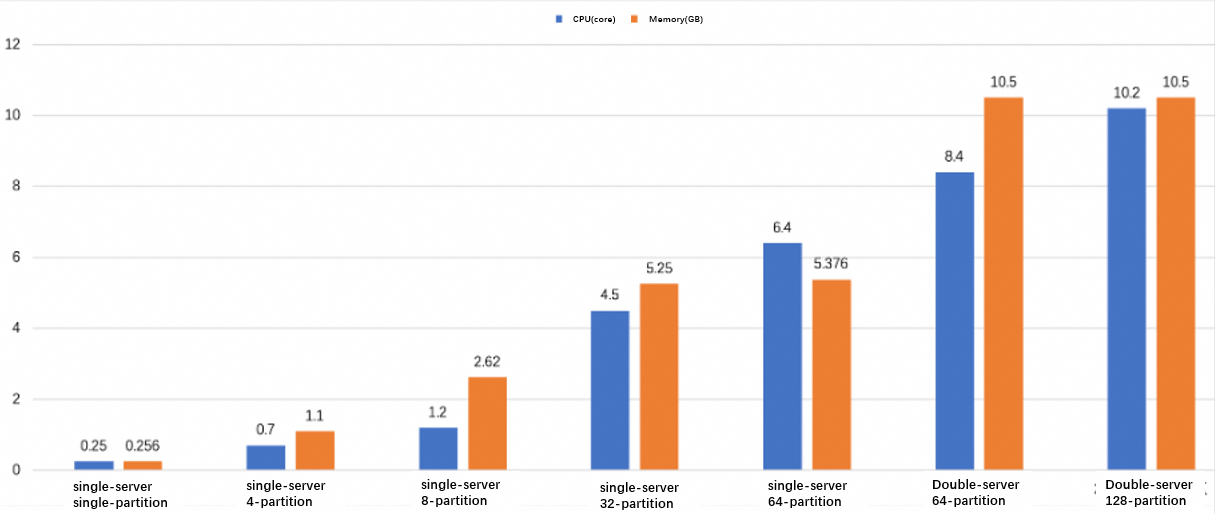
下圖展示的是各個情境下CPU和記憶體的消耗情況,CPU基本上和分區數呈線性關係。
在單機-單分區情境下,消耗的CPU為0.25個單核CPU。2台機器-128個分區的情境下,當同步QPS達到100萬行時,消耗的CPU也僅為10.2個單核CPU。從記憶體消耗方面看。在分區數較少時,CPU和分區數呈線性關係,而在分區數增加較多(32個和64個)時,單機記憶體消耗基本維持在5.3 GB左右。
-
網路總頻寬消耗
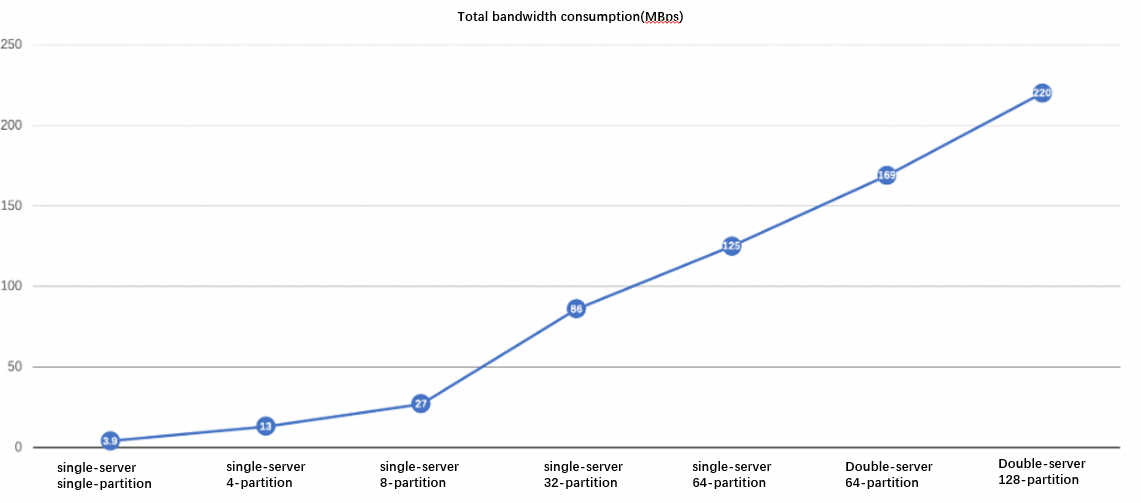
下圖展示的是增量同步處理消耗的總頻寬,從圖中我們可以看出頻寬和Channel數的線性關係(略單機-16分區情境)。
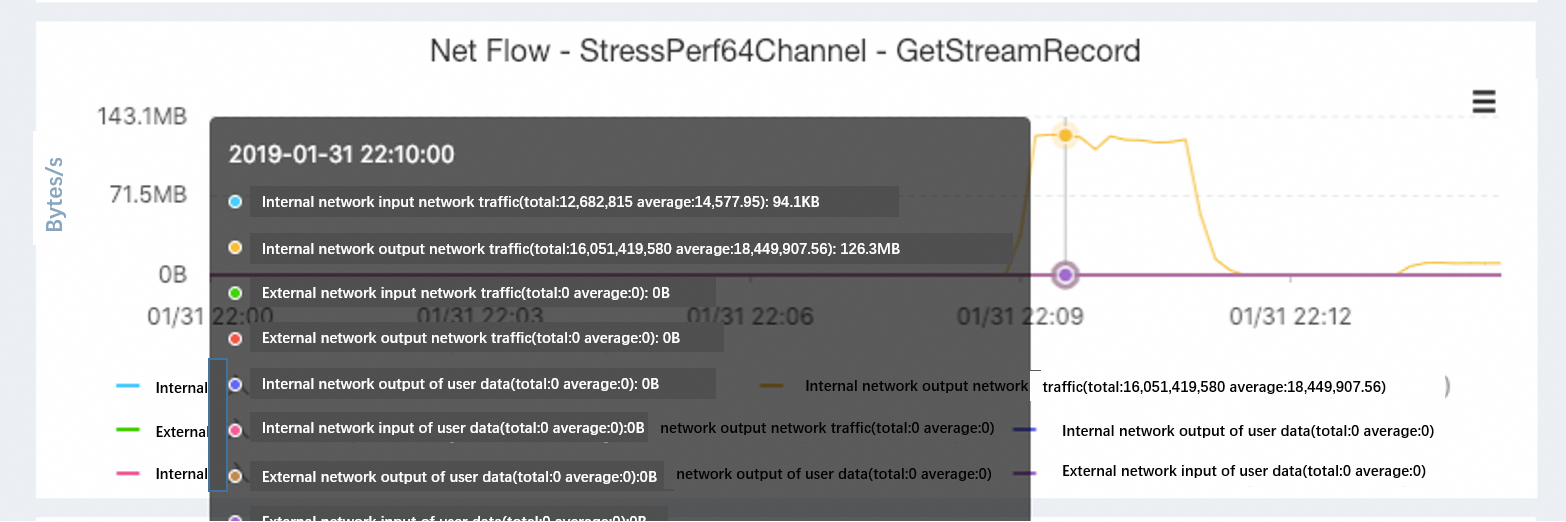
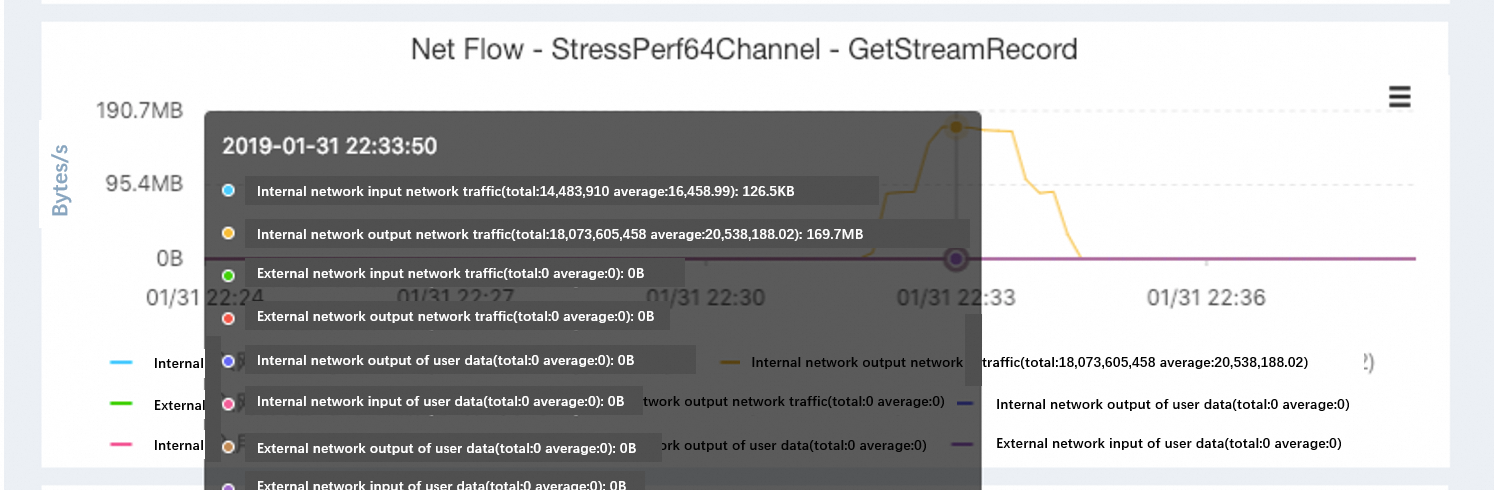
在單機-64分區情境下,我們可以看到頻寬總消耗為125 MBps,已經成功把千兆網卡打爆,而在換成2台機器-64分區進行資料消費後,我們發現64分區真正的輸送量為169 MBps,和單機-32分區的86 MBps的兩倍近乎相等。而在兩台機器-128分區的100萬QPS情境中,總輸送量也達到了220 MBps。
測試細則
-
單機單Channel:1.9萬QPS
-
測試時間:2019/1/30 17:40
-
QPS:穩定速率19000行/秒左右;峰值速率:21800行
-
Latency:50ms/1000行左右
{"timestamp":1548841516239,"speed":19000,"totalCount":3094000} {"timestamp":1548841521290,"speed":19200,"totalCount":3190000} {"timestamp":1548841526318,"speed":20400,"totalCount":3292000} {"timestamp":1548841531357,"speed":19600,"totalCount":3390000} {"timestamp":1548841536396,"speed":19400,"totalCount":3487000} {"timestamp":1548841541418,"speed":17800,"totalCount":3576000} {"timestamp":1548841546472,"speed":17600,"totalCount":3664000} {"timestamp":1548841551532,"speed":17200,"totalCount":3750000} {"timestamp":1548841556572,"speed":17400,"totalCount":3837000} {"timestamp":1548841561631,"speed":17400,"totalCount":3924000} {"timestamp":1548841566664,"speed":20000,"totalCount":4024000} {"timestamp":1548841571693,"speed":21600,"totalCount":4132000} {"timestamp":1548841576721,"speed":21200,"totalCount":4238000} {"timestamp":1548841581765,"speed":21800,"totalCount":4347000} {"timestamp":1548841586787,"speed":21400,"totalCount":4454000} {"timestamp":1548841591798,"speed":17800,"totalCount":4543000} {"timestamp":1548841596812,"speed":17800,"totalCount":4632000} {"timestamp":1548841601825,"speed":17800,"totalCount":4721000} {"timestamp":1548841606861,"speed":16200,"totalCount":4802000} {"timestamp":1548841611884,"speed":17400,"totalCount":4889000} {"timestamp":1548841616912,"speed":17200,"totalCount":4975000} {"timestamp":1548841621966,"speed":18000,"totalCount":5065000} {"timestamp":1548841626988,"speed":17600,"totalCount":5153000} {"timestamp":1548841632035,"speed":18200,"totalCount":5244000} -
CPU佔用:單核25%左右
-
記憶體佔用:總實體記憶體0.4%左右,即0.256 GB左右(測試機器記憶體為64 GB)
-
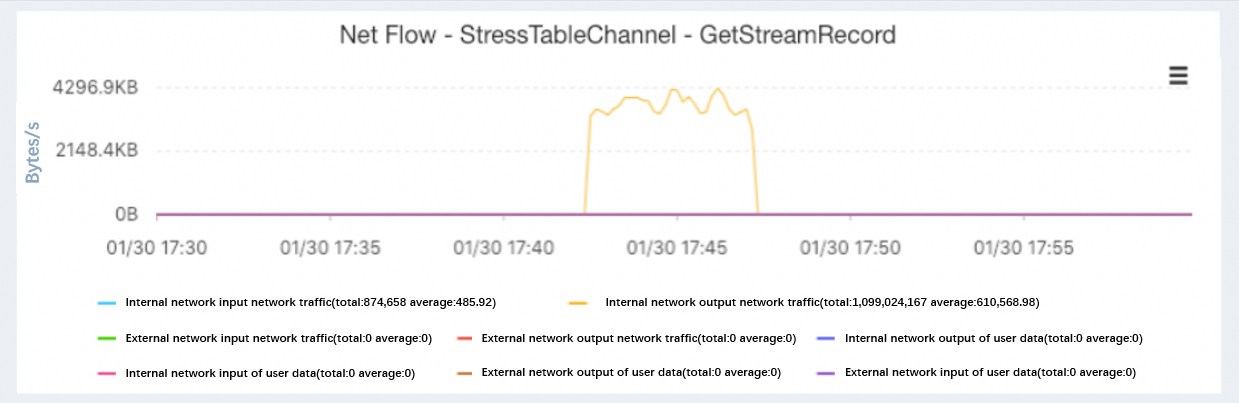
網路頻寬消耗:4000 KB/s左右
-
-
單機4分區:7萬QPS
在通道服務控制台中,通道 teststream 為增量類型,包含 4 個分區,各分區消費統計分別為 249000、259000、267000、266000,狀態均為開啟。
-
測試時間:2019/1/30 20:00
-
QPS:穩定速率70000行/秒左右,峰值速度72400行/秒
-
Latency:14.28ms/1000行左右
{"timestamp":1548849903425,"speed":68200,"totalCount":345000} {"timestamp":1548849908451,"speed":69400,"totalCount":692000} {"timestamp":1548849913454,"speed":71800,"totalCount":1051000} {"timestamp":1548849918470,"speed":70600,"totalCount":1404000} {"timestamp":1548849923479,"speed":69400,"totalCount":1751000} {"timestamp":1548849928501,"speed":71000,"totalCount":2106000} {"timestamp":1548849933544,"speed":70200,"totalCount":2457000} {"timestamp":1548849938558,"speed":71400,"totalCount":2814000} {"timestamp":1548849943585,"speed":71600,"totalCount":3172000} {"timestamp":1548849948600,"speed":70600,"totalCount":3525000} {"timestamp":1548849953609,"speed":71000,"totalCount":3880000} {"timestamp":1548849958624,"speed":68000,"totalCount":4220000} {"timestamp":1548849963645,"speed":69000,"totalCount":4565000} {"timestamp":1548849968651,"speed":70200,"totalCount":4916000} {"timestamp":1548849973661,"speed":70600,"totalCount":5269000} {"timestamp":1548849978664,"speed":72400,"totalCount":5631000} {"timestamp":1548849983676,"speed":68000,"totalCount":5971000} {"timestamp":1548849983699,"speed":68000,"totalCount":6311000} -
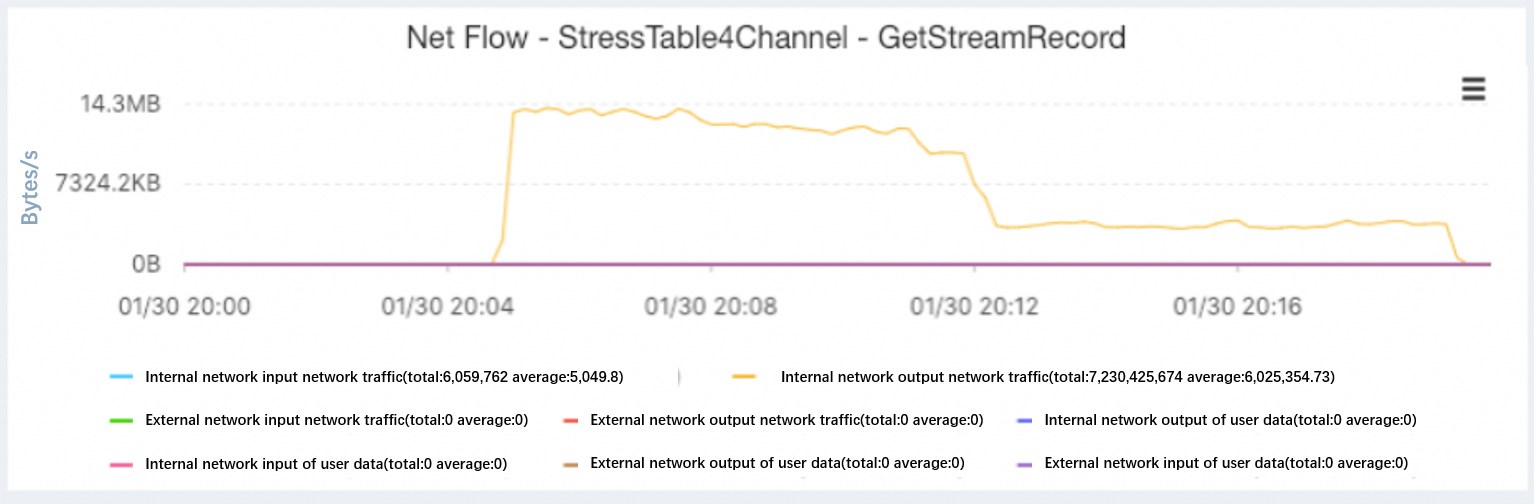
CPU佔用:單核70%左右
-
記憶體佔用:實體記憶體1.9%左右,即1.1 GB左右。(測試機器記憶體為64 GB)
-
網路頻寬消耗:13 MBps左右
-
-
單機8分區:13萬QPS
通道名為 teststream2,8 個分區均為增量類型,狀態為等待,消費統計為 0,增量通道分區最新同步時間為初始值。
-
測試時間:2019/1/30 20:20
-
QPS:穩定速率130000行/秒,峰值速率141644行/秒
-
Latency:7.69ms/1000行左右
{"timestamp":1548850971326,"speed":136000,"totalCount":688000} {"timestamp":1548850976329,"speed":137600,"totalCount":1376000} {"timestamp":1548850981335,"speed":137800,"totalCount":2065000} {"timestamp":1548850986351,"speed":139800,"totalCount":2764000} {"timestamp":1548850991360,"speed":139200,"totalCount":3460000} {"timestamp":1548850996362,"speed":134600,"totalCount":4133000} {"timestamp":1548851001377,"speed":133800,"totalCount":4802000} {"timestamp":1548851006389,"speed":137800,"totalCount":5491000} {"timestamp":1548851011390,"speed":138000,"totalCount":6181000} {"timestamp":1548851016412,"speed":137600,"totalCount":6869000} {"timestamp":1548851021417,"speed":135600,"totalCount":7547000} {"timestamp":1548851026418,"speed":134800,"totalCount":8221000} {"timestamp":1548851031420,"speed":134400,"totalCount":8893000} {"timestamp":1548851036430,"speed":136600,"totalCount":9576000} {"timestamp":1548851041443,"speed":141400,"totalCount":10283000} {"timestamp":1548851046452,"speed":141644,"totalCount":10991220} {"timestamp":1548851051455,"speed":124928,"totalCount":11615860} {"timestamp":1548851056456,"speed":122201,"totalCount":12226865} {"timestamp":1548851061466,"speed":121944,"totalCount":12836585} -
CPU佔用:單核120%左右
-
記憶體佔用:物理總記憶體4.1%左右,即2.62 GB左右(測試機器記憶體為64 GB)
-
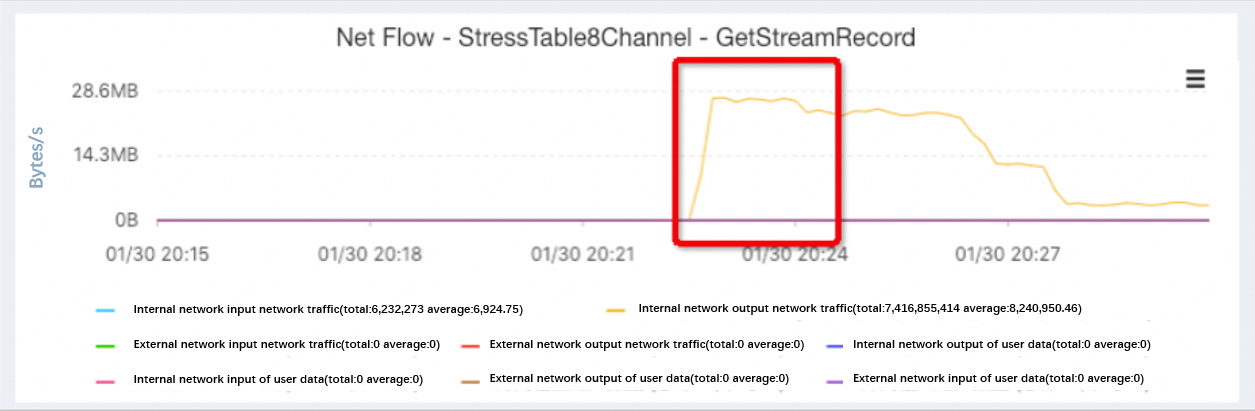
消耗網路頻寬:27 MBps左右

-
-
單機32分區:42萬QPS
通道名為 teststream,通道類型為增量,32 個通道分區狀態均為開啟,消費統計均為 0,增量通道最新同步時間為
1970-01-01 08:00:00。-
測試時間:2019/1/31 15:50
-
QPS:穩定速率42萬行/秒,峰值速率447600行/秒
-
Latency:2.38ms/1000行
{"timestamp":1548921206560,"speed":401800,"totalCount":2016000} {"timestamp":1548921211565,"speed":435600,"totalCount":4194000} {"timestamp":1548921216569,"speed":440200,"totalCount":6397000} {"timestamp":1548921221571,"speed":439000,"totalCount":8592000} {"timestamp":1548921226573,"speed":440800,"totalCount":10796000} {"timestamp":1548921231577,"speed":437400,"totalCount":12983000} {"timestamp":1548921236579,"speed":421400,"totalCount":15090000} {"timestamp":1548921241580,"speed":434400,"totalCount":17262000} {"timestamp":1548921246581,"speed":445400,"totalCount":19489000} {"timestamp":1548921251583,"speed":447600,"totalCount":21727000} {"timestamp":1548921256591,"speed":447400,"totalCount":23964000} {"timestamp":1548921261594,"speed":440800,"totalCount":26169000} {"timestamp":1548921266595,"speed":425200,"totalCount":28295000} {"timestamp":1548921271599,"speed":408600,"totalCount":30339000} {"timestamp":1548921276603,"speed":403800,"totalCount":32358000} {"timestamp":1548921281608,"speed":405000,"totalCount":34383000} {"timestamp":1548921286610,"speed":403400,"totalCount":36400000} {"timestamp":1548921291612,"speed":409479,"totalCount":38447399} {"timestamp":1548921296617,"speed":400896,"totalCount":40452882} {"timestamp":1548921301618,"speed":391936,"totalCount":42412564} -
CPU佔用:單核450%左右
-
記憶體佔用:8.2%左右,即5.25 GB左右(實體記憶體64 GB)
-
增量資料消耗網路頻寬:86 MBps左右
-
-
單機64分區(千兆網卡被打滿):57萬QPS
通道
teststream下共64個分區,所有分區類型為增量、狀態為開啟,各分區消費統計約1228941~1231572條,最新同步時間在2019-01-31 22:32附近。-
測試時間:2019/1/31 22:10
-
QPS:穩定速率57萬行/秒左右,峰值速率581400行/秒
-
Latency:1.75ms/1000行左右
{"timestamp":1548943781849,"speed":536200,"totalCount":2688000} {"timestamp":1548943786851,"speed":572000,"totalCount":5548000} {"timestamp":1548943791852,"speed":578800,"totalCount":8442000} {"timestamp":1548943796855,"speed":581800,"totalCount":11351000} {"timestamp":1548943801857,"speed":576200,"totalCount":14232000} {"timestamp":1548943806859,"speed":576200,"totalCount":17113000} {"timestamp":1548943811860,"speed":581400,"totalCount":20020000} {"timestamp":1548943816861,"speed":571600,"totalCount":22878000} {"timestamp":1548943821864,"speed":555800,"totalCount":25657000} {"timestamp":1548943826866,"speed":555000,"totalCount":28432000} {"timestamp":1548943831869,"speed":577000,"totalCount":31317000} {"timestamp":1548943836870,"speed":578800,"totalCount":34211000} {"timestamp":1548943841871,"speed":559600,"totalCount":37009000} {"timestamp":1548943846875,"speed":561400,"totalCount":39816000} {"timestamp":1548943851878,"speed":551600,"totalCount":42574000} {"timestamp":1548943856879,"speed":560600,"totalCount":45377000} -
CPU佔用:單核640%左右
-
記憶體佔用:8.4%左右,即5.376 GB左右
-
增量資料消耗網路頻寬:125 MBps左右(達到千兆網卡的速率極限)
-
-
2台機器共同消費64分區:78萬QPS
通道
teststream2的分區列表顯示共 64 個分區,由兩個用戶端(ID 首碼分別為Linux-6c74d-和Linux-37197-)共同消費,每個分區消費統計約 122~123 萬條,類型均為增量,狀態均為開啟。-
測試時間:2018/1/31 22:30
-
QPS:每台穩定速率在39萬行/秒左右,總的穩定速率在78萬行/秒左右
-
Latency:1.28ms/1000行
{"timestamp":1548945217504,"speed":380200,"totalCount":1902000} {"timestamp":1548945222507,"speed":392400,"totalCount":3864000} {"timestamp":1548945227509,"speed":392800,"totalCount":5828000} {"timestamp":1548945232515,"speed":388200,"totalCount":7769000} {"timestamp":1548945237517,"speed":394200,"totalCount":9740000} {"timestamp":1548945242518,"speed":392800,"totalCount":11704000} {"timestamp":1548945247521,"speed":391200,"totalCount":13660000} {"timestamp":1548945252522,"speed":382200,"totalCount":15571000} {"timestamp":1548945257523,"speed":383400,"totalCount":17488000} {"timestamp":1548945262527,"speed":385600,"totalCount":19416000} {"timestamp":1548945267528,"speed":385000,"totalCount":21341000} {"timestamp":1548945272532,"speed":388600,"totalCount":23284000} {"timestamp":1548945277538,"speed":385800,"totalCount":25213000} {"timestamp":1548945282541,"speed":387400,"totalCount":27150000} {"timestamp":1548945287546,"speed":392200,"totalCount":29111000} -
CPU佔用:每台單核420%左右,共單核840%
-
記憶體佔用:每台8.2%左右,共16.4%(10.5 GB)
-
增量資料消耗總網路頻寬:169 MBps左右(和單機64分區對比,可以看出單機的網路已經成為瓶頸)
-
-
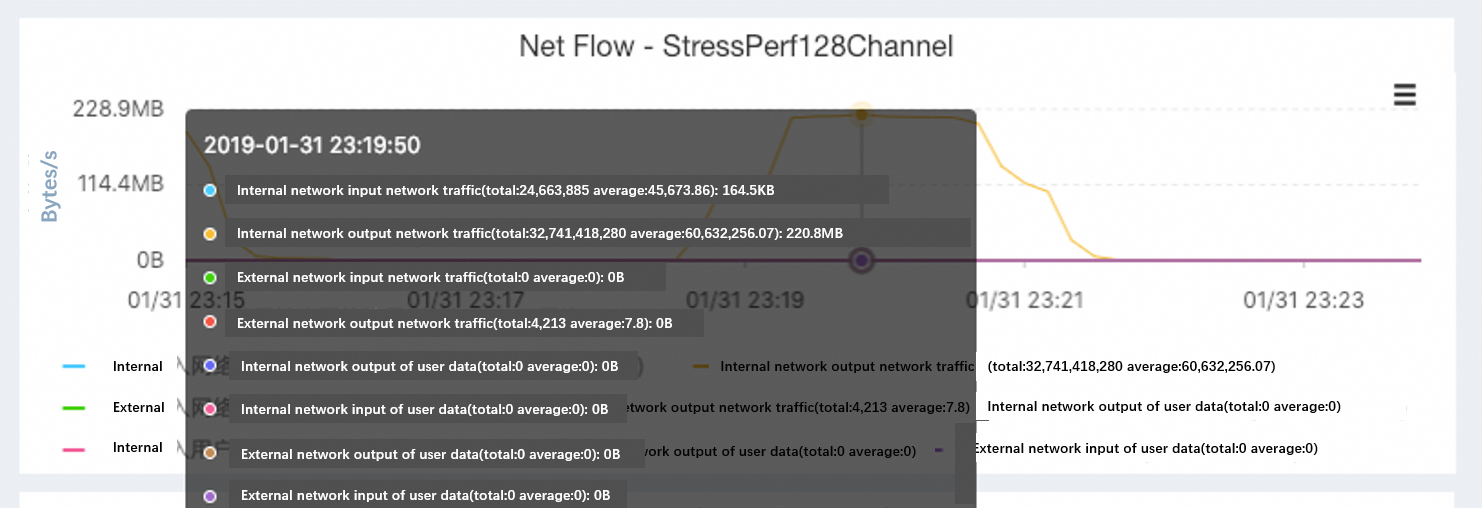
2台機器共同消費128分區(兩台千兆機器的網卡近乎被打滿):100萬QPS
通道teststream2為增量類型,通道分區列表中所有分區狀態均為開啟,每個分區的消費統計達數十萬條記錄,增量同步處理時間集中在2019-01-31 23:22至23:23之間。
-
測試時間:2018/1/31 23:20
-
QPS:每台穩定速率在50萬行/秒左右,總的穩定速率在100萬行/秒左右
-
Latency:1ms/1000行左右
$tail -f perf_128channel_2machine.txt {"timestamp":1548948013375,"speed":492400,"totalCount":27363000} {"timestamp":1548948018378,"speed":499800,"totalCount":29862000} {"timestamp":1548948023383,"speed":499800,"totalCount":32361000} {"timestamp":1548948028387,"speed":504400,"totalCount":34883000} {"timestamp":1548948033389,"speed":504200,"totalCount":37404000} {"timestamp":1548948038390,"speed":506800,"totalCount":39939000} {"timestamp":1548948043391,"speed":500800,"totalCount":42443000} {"timestamp":1548948048393,"speed":497400,"totalCount":44930000} {"timestamp":1548948053394,"speed":511800,"totalCount":47490000} {"timestamp":1548948058397,"speed":519600,"totalCount":50089000} {"timestamp":1548948063398,"speed":518800,"totalCount":52683000} {"timestamp":1548948068399,"speed":519600,"totalCount":55281000} {"timestamp":1548948073401,"speed":503800,"totalCount":57800000} -
CPU佔用:每台單核560%左右,兩台共計單核1020%
-
記憶體佔用:每台8.2%左右,共16.4%(10.5 GB)
-
增量資料消耗總網路頻寬:220 MBps左右
-

總結
通過這次對於增量效能的實際測試,我們發現了單分區(或分區數較少)的速率主要取決於伺服器端的讀盤等延遲,本身機器資源的消耗很小。而隨著分區數增長,Tunnel增量的整體吞吐也進行了線性增長直至達到系統的瓶頸(本文中是網路頻寬)。最後,在單機資源被打滿的情況下,我們也可以通過添加新的機器資源進一步的提升系統整體的輸送量,有效驗證了Tunnel具備良好的水平擴充性。