通過配置Pod Monitor,您可以採集容器叢集中指定的Pod暴露的監控指標,從而使Prometheus監控更加靈活、自動化和易於管理。
使用限制
僅支援容器環境執行個體。
相關費用
使用Pod Monitor將產生相關費用。更多資訊,請參見Prometheus 執行個體計費。
如果您的叢集之前部署過開源Prometheus服務,並且在開源Prometheus服務中存在Pod Monitor配置,後續接入阿里雲Managed Service for Prometheus後,阿里雲Managed Service for Prometheus將會直接繼承原有開源版本的配置,產生Pod Monitor相關費用。計費資訊,請參見Prometheus 執行個體計費。
前提條件
已建立容器環境執行個體,即容器叢集。具體操作,請參見建立ACK託管叢集。
在容器叢集中,目標Pod已正常暴露監控指標。
功能入口
在左側導覽列,單擊接入管理。
在已接入環境頁簽,查看容器環境列表,單擊目標容器環境操作列的指標採集,進入指標採集頁面。
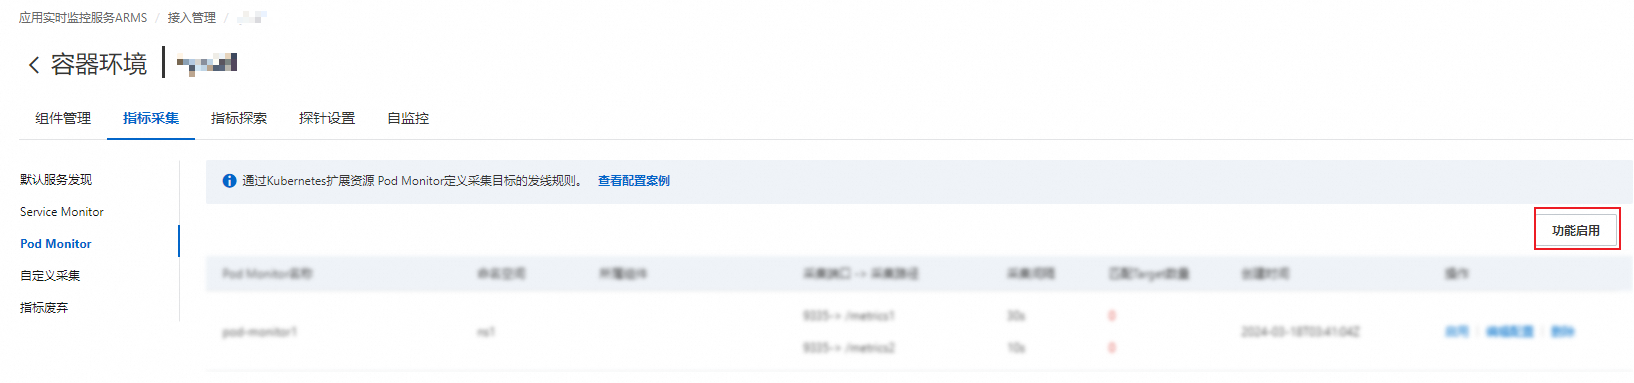
在指標採集頁簽,單擊Pod Monitor,進入Pod Monitor配置頁面。
啟用功能
在Pod Monitor頁面,單擊功能啟用,開啟Pod Monitor能力。啟用後,您可以查看當前容器叢集中所有Pod Monitor及相關配置資訊。同時,Managed Service for Prometheus會根據配置的時間間隔和Path抓取監控指標。
該功能預設啟用。
管理Pod Monitor
新增Pod Monitor
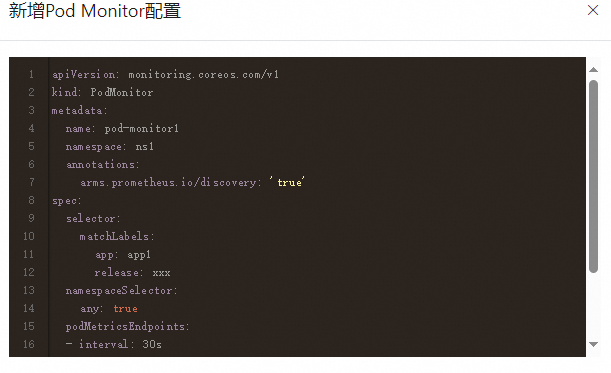
在Pod Monitor頁面,單擊新增,在新增Pod Monitor配置面板,手動錄入Pod Monitor的YAML配置,然後單擊建立。
編輯Pod Monitor
在Pod Monitor列表中,單擊目標Pod Monitor操作列的編輯配置,在編輯Pod Monitor配置面板修改YAML內容。
刪除Pod Monitor
在Pod Monitor列表中,單擊目標Pod Monitor操作列的刪除。
停用Pod Monitor
在Pod Monitor列表中,單擊目標Pod Monitor操作列的停用。停用後,當前Pod Monitor配置不生效。
功能禁用
在Pod Monitor頁面,單擊功能禁用,關閉Pod Monitor能力,功能禁用後,Managed Service for Prometheus不再發現和採集Pod暴露指標,但是存量的正在採集的Target不會停止。