將 AWS CloudWatch 指標接入可觀測監控 Prometheus 版
更新時間:
Copy as MD
本方案通過yet-another-cloudwatch-exporter(簡稱yace-exporter)將AWS CloudWatch指標接入可觀測監控 Prometheus 版,實現跨CloudMonitor。
前提條件
方案
資料擷取:yace-exporter通過 AWS OpenAPI 定期拉取 CloudWatch 的指標資料(如 EC2 的 CPU 利用率、磁碟 I/O 等)。
格式轉換:yace-exporter將 AWS 的指標資料格式轉換為 Prometheus 標準的
metrics格式。暴露端點:通過配置的 HTTP 連接埠(預設
5000)提供/metrics介面,供阿里雲 Prometheus 伺服器(通過服務發現機制)拉取資料。
操作步驟
步驟1:在 ACK 的叢集中部署 yace-exporter
yace-exporter是社區開發的Cloudwatch Metric Exporter,效能好,成本低。
1.1 下載並修改配置values.yaml
修改說明:
# 配置Prometheus Scrape 路徑和連接埠
podAnnotations: {
  prometheus.io/path: /metrics,
  prometheus.io/port: "5000",
  prometheus.io/scrape: "true"
}

# 配置 AWS 的認證方式,自行選擇1個,推薦 ak/sk 方式
aws:
  role:

  # The name of a pre-created secret in which AWS credentials are stored. When
  # set, aws_access_key_id is assumed to be in a field called access_key,
  # aws_secret_access_key is assumed to be in a field called secret_key, and the
  # session token, if it exists, is assumed to be in a field called
  # security_token
  secret:
    name:
    includesSessionToken: false

  # Note: Do not specify the aws_access_key_id and aws_secret_access_key if you specified role or secret.name before
  aws_access_key_id:
  aws_secret_access_key:

#採集 CloudWatch 的指標配置,請您按需配置,只需配置用到的產品和指標及統計運算元,AWS CloudWatch 會按請求的指標個數計費
config: |-
  apiVersion: v1alpha1
  sts-region: us-west-1 # AWS 認證地區建議和雲產品的地區保持一致
  discovery:
    jobs:
    - type: AWS/EC2  # 支援的產品命名空間,參考這個文檔 https://github.com/prometheus-community/yet-another-cloudwatch-exporter
      regions:
        - us-west-1 # 雲產品所在地區
      searchTags:  # 配置採集哪些tag的雲產品執行個體寫入Prometheus
        - key: scrapedEnable
          value: ^(ali)$
      metrics: # 配置需要採集的指標列表,CloudWatch 每個雲產品支援哪些指標,參考這個文檔 https://docs.aws.amazon.com/AmazonCloudWatch/latest/monitoring/aws-services-cloudwatch-metrics.html。下面以採集EC2的幾個指標為例,其他產品配置類似
        - name: CPUUtilization
          statistics:   # statistics 彙總統計方法,AWS 文檔也有列出,Average:平均值,Minimum:最小值 ,Maximum:最大值,Sum:求和
          - Average
          - Minimum
          - Maximum
          period: 60
          length: 600
        - name: DiskReadOps
          statistics:
          - Sum
          - Average
          - Minimum
          - Maximum
          period: 60
          length: 600
        - name: DiskWriteOps
          statistics:
          - Sum
          - Average
          - Minimum
          - Maximum
          period: 60
          length: 600
        - name: DiskReadBytes
          statistics:
          - Sum
          - Average
          - Minimum
          - Maximum
          period: 60
          length: 600
1.2 安裝 Helm 應用
helm install -f values.yaml yace-exporter-cw ./prometheus-yet-another-cloudwatch-exporter-0.40.0.tgz -n aws-cloudwatch或者線上拉鏡像安裝:
helm repo add prometheus-community https://prometheus-community.github.io/helm-charts
helm repo update
helm install -f values.yaml yane-exporter-cw prometheus-community/prometheus-yet-another-cloudwatch-exporter -n aws-cloudwatch步驟2:在可觀測監控 Prometheus 版中自動採集
登入Prometheus控制台,在左側導覽列單擊接入管理。
在上方地區選取項目ACK叢集所在地區,然後在容器環境頁簽中找到並單擊目標環境名稱。
單擊指標採集頁簽,然後在預設服務發現頁面中,單擊右側功能啟用。
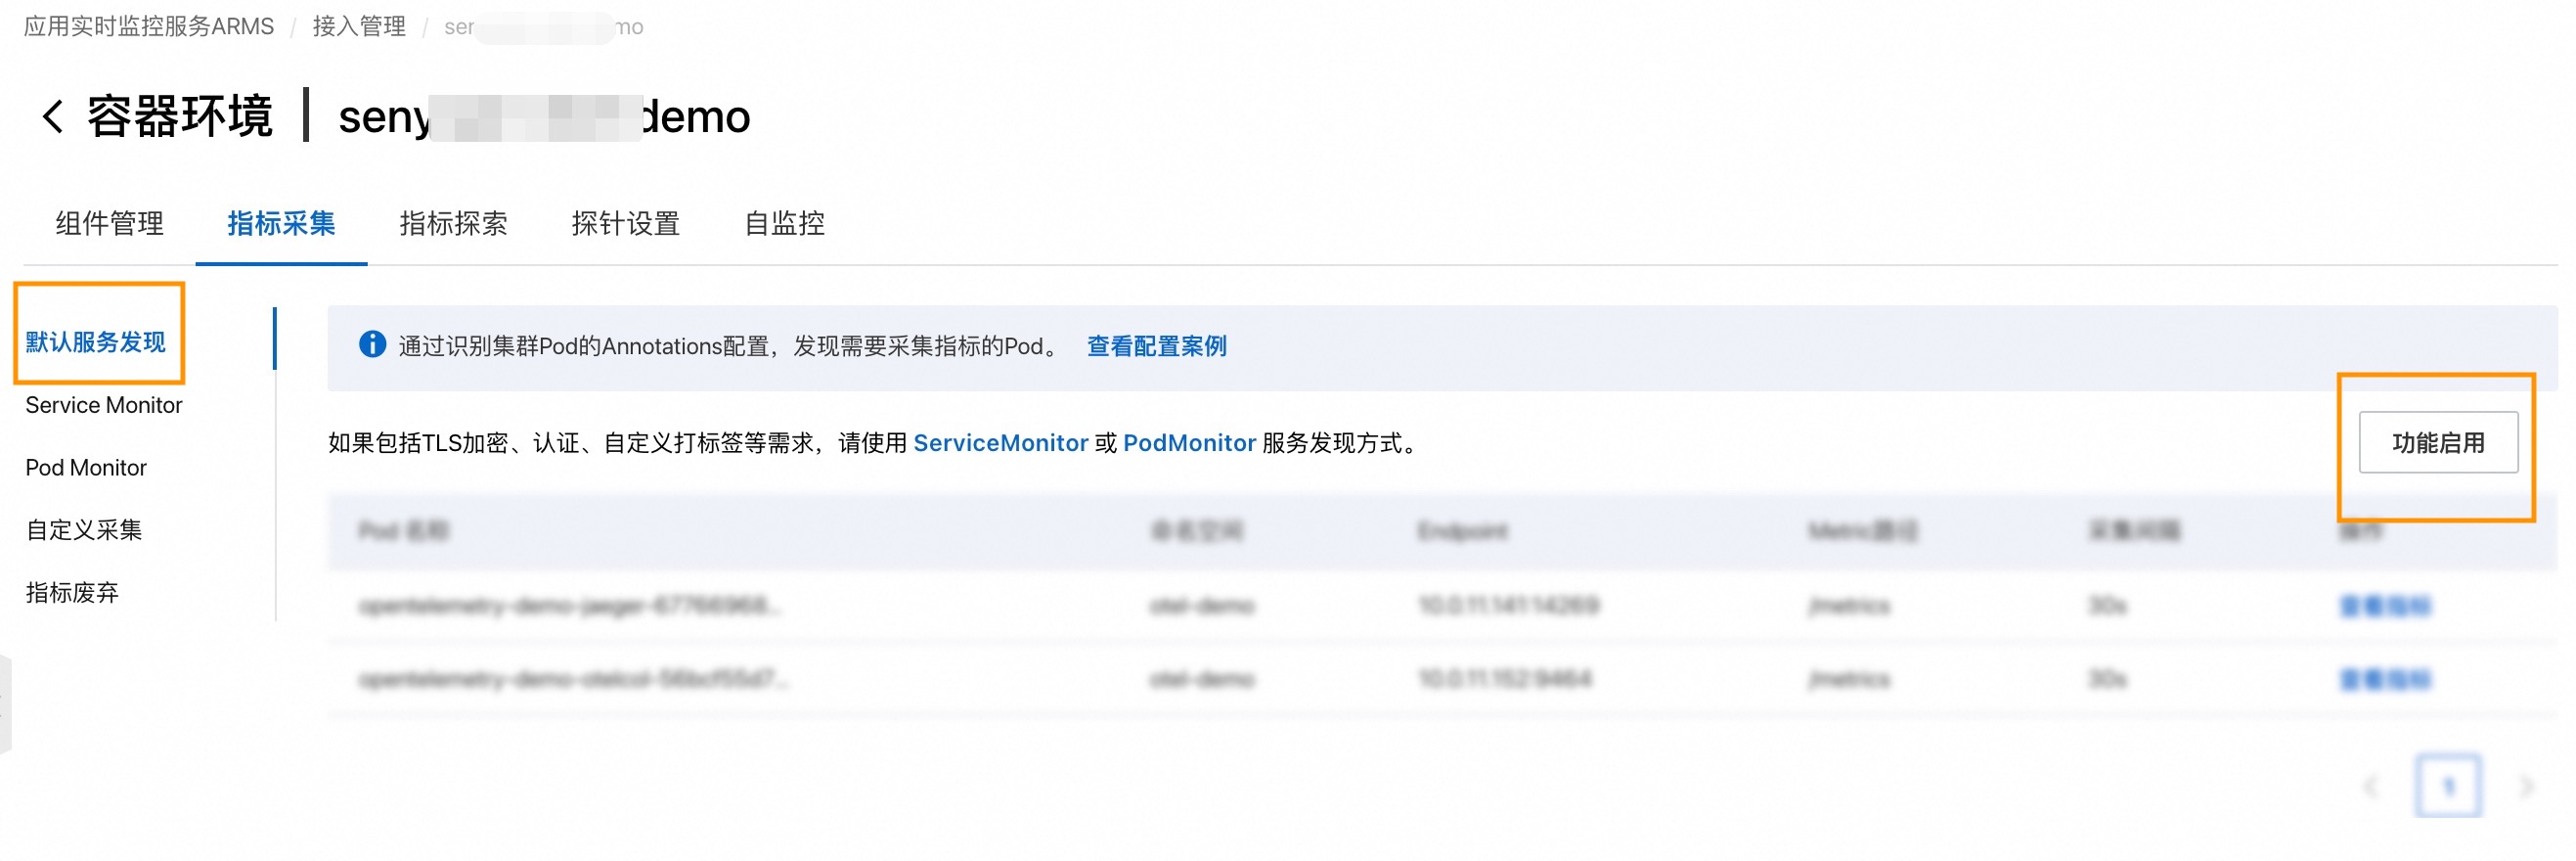
啟用後系統會預設採集 yace-exporter 的指標。
單擊自监控頁簽,查看採集任務。
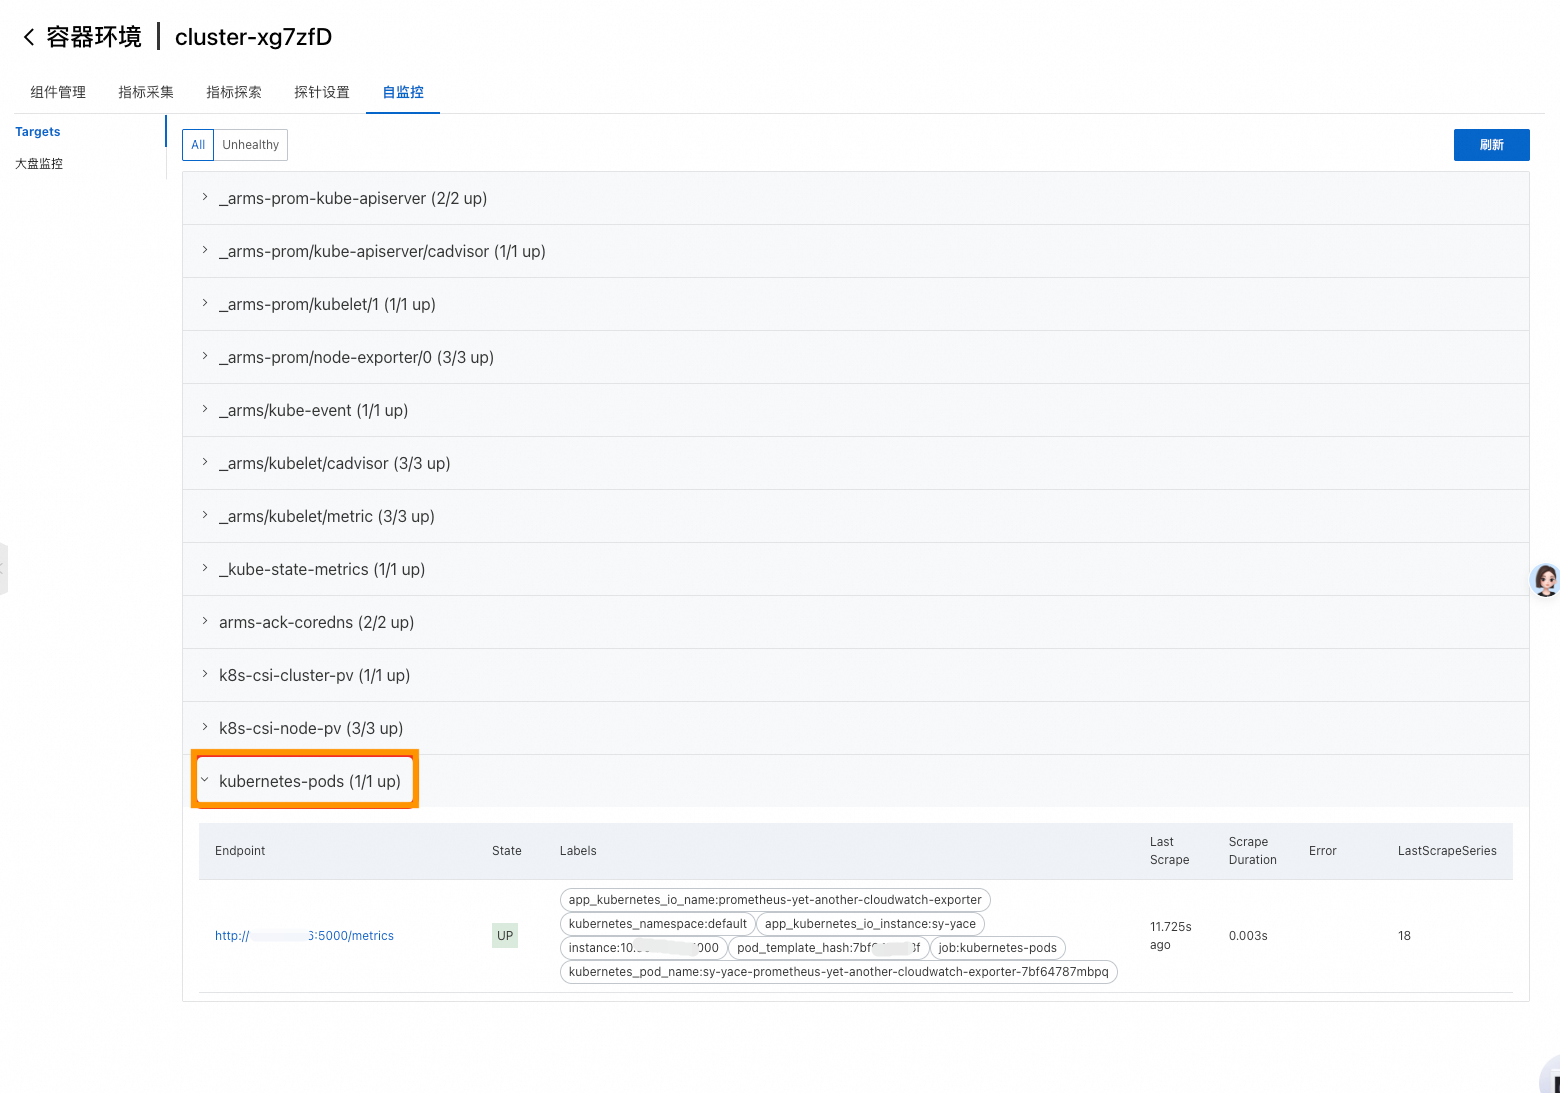
系統會自動建立一個名稱為
kubernetes-pods的採集任務,狀態為up表示配置採集成功。
步驟3:查看採集指標,配置大盤和警示
採集任務配置成功後,可以在指標探索中查詢是否有aws_開頭指標,來驗證指標是否已經採集到可觀測監控 Prometheus 版中。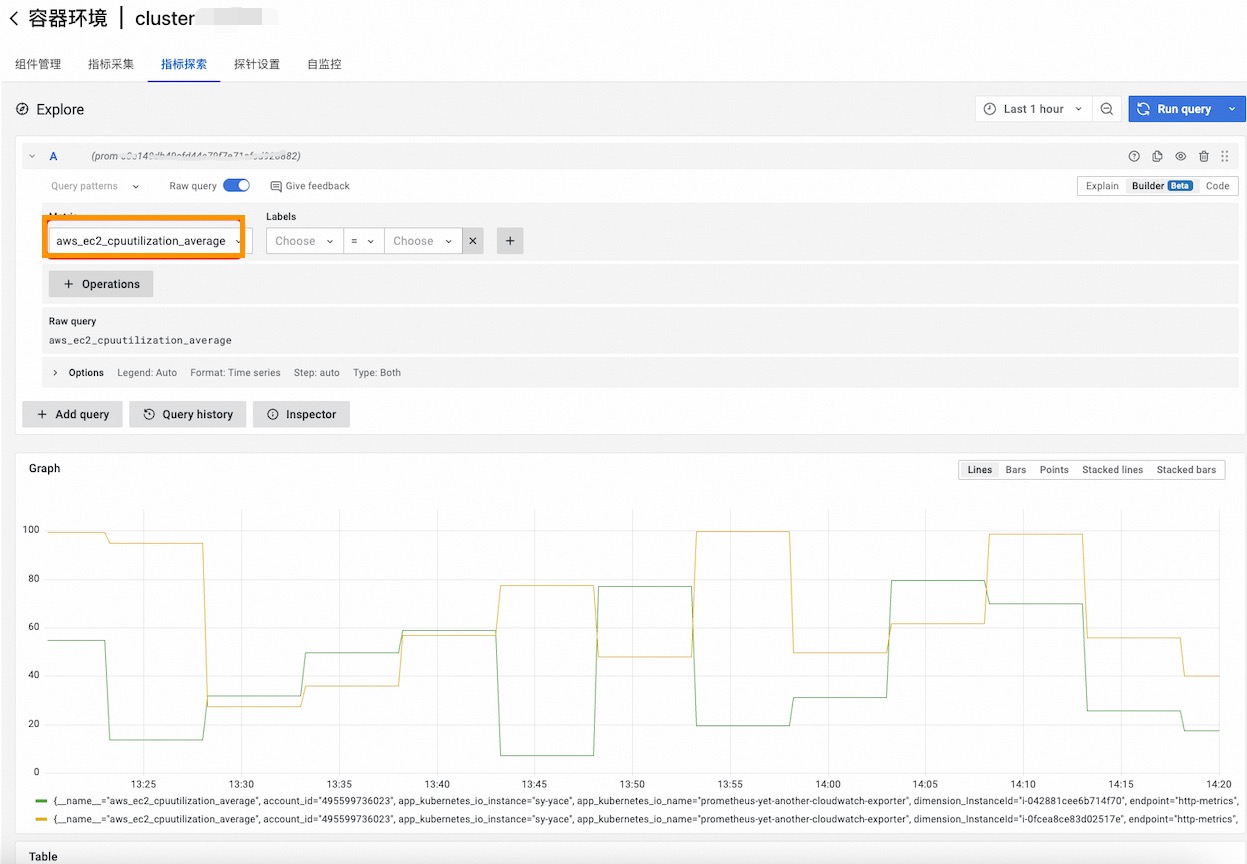
配置大盤和警示,請參考雲端服務可觀測中的步驟三和步驟四。
该文章对您有帮助吗?