PerfTracker是大模型訓練的線上效能分析診斷工具。當訓練效能異常時,它能線上採集各Worker的CUDA核函數、Python函數執行記錄及硬體監控資料,自動產生分析報告,定位慢節點、瓶頸函數和Hang問題。
使用限制
目前,PerfTracker相關能力僅支援PyTorch架構任務。
功能介紹
主要功能
線上擷取任務執行記錄:線上收集所有Worker的函數執行記錄(CUDA核函數、Python函數等),以及GPU、NVLink、PCIe、DRAM等硬體的高精度(100微秒粒度)監控資訊。
函數級效能分析:集中處理高精度監控資料,產生函數級效能報告,自動診斷效能損失原因(慢節點、瓶頸函數等),為深入最佳化提供依據。
解決方案
線上細粒度採集:將資訊收集從離線複現轉為線上捕獲,提升即時性和準確性。
自動化效能分析演算法:將人工分析經驗程式化,自動診斷和定位效能問題。
實現原理
PerfTracker由Collector和PerfDisplay兩部分組成。Collector運行在任務容器中,與訓練進程獨立;PerfDisplay提供本地可視化頁面。原理如下圖所示:
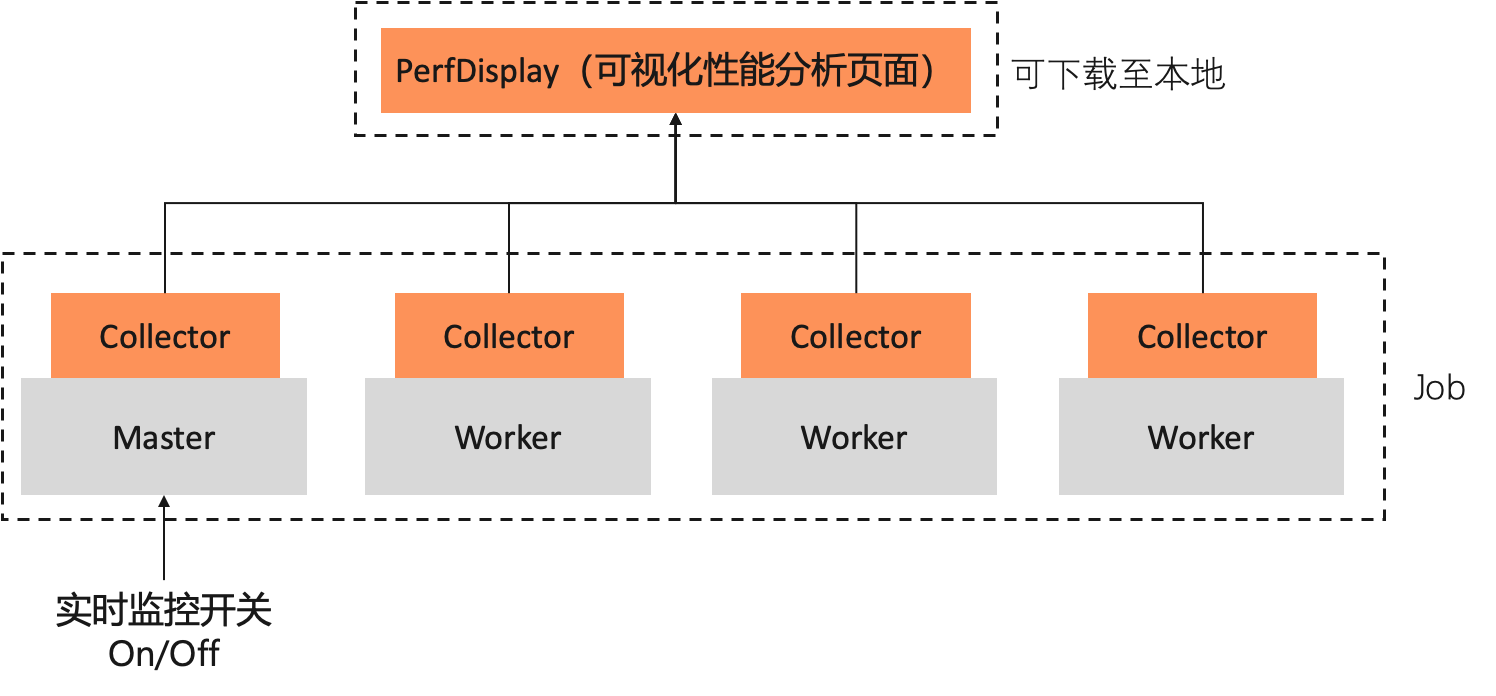
PerfTracker Collector:利用Torch profiler API和nsys採集全棧監控資料,支援以下類型:
CUDA Kernel函數(計算、通訊等)、GPU launch Kernel函數、顯存操作、Python函數等的執行記錄,100%精確記錄程式行為。
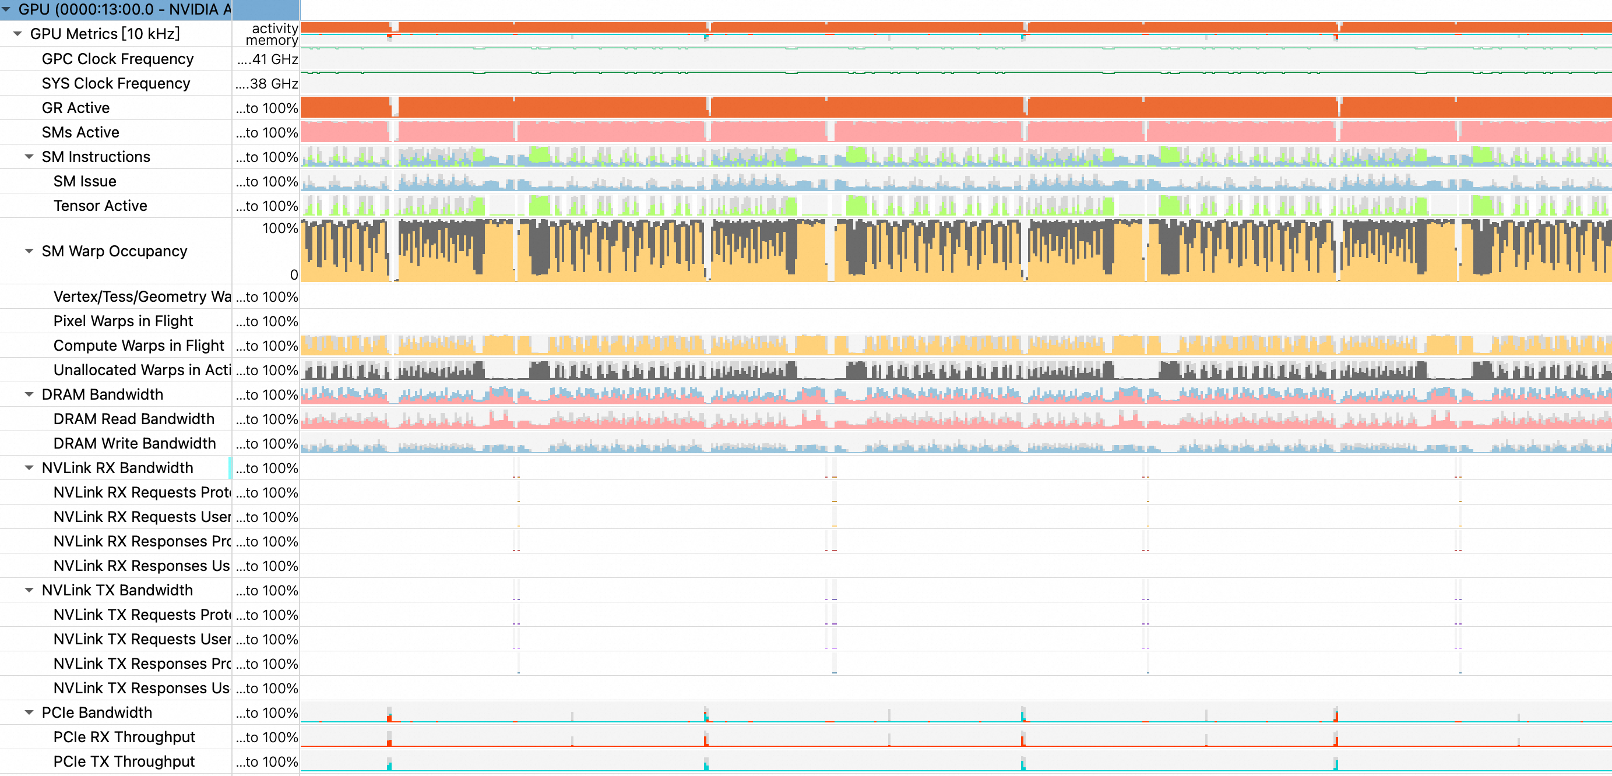
100微秒精度的GPU、NVLink、PCIe、DRAM等硬體的各種指標監控資訊。
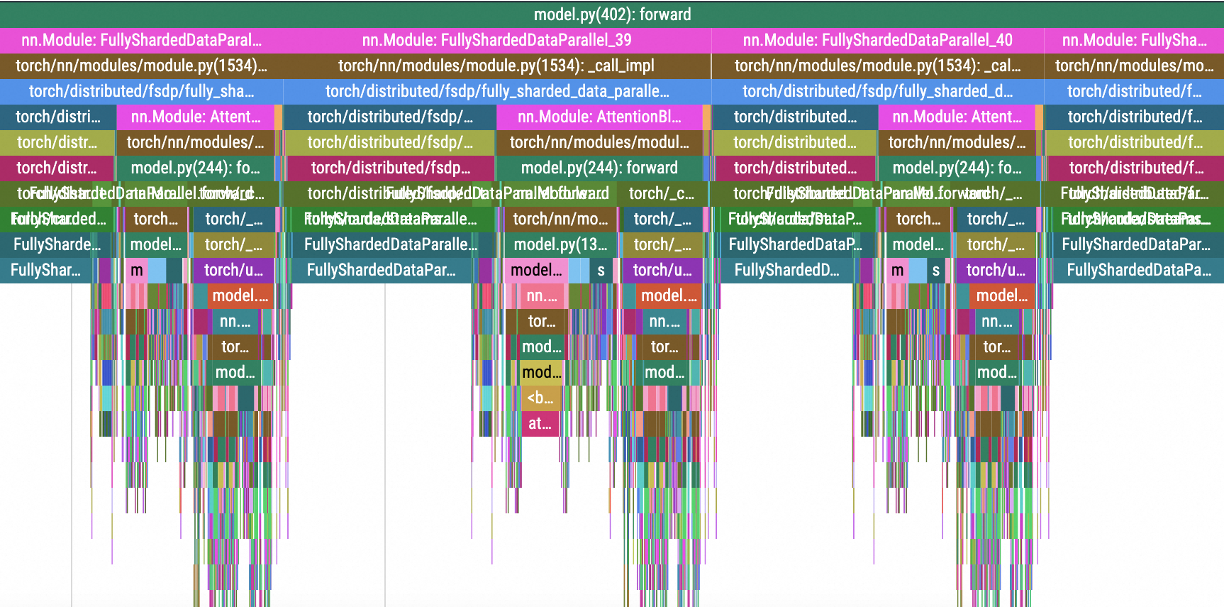
採集結果如下圖所示:
CUDA Kernel函數、顯存操作

Python函數、GPU launch Kernel
硬體監控資訊
PerfDisplay:匯總分析採集資料,產生效能分析報告和可視化頁面。
使用方法
準備工作
準備訓練代碼,匯入PerfTracker模組並標記step。
在訓練代碼頭部匯入PerfTracker模組:
try:
    from c4d_perftracker_collector.PerfTracker import PerfTracker
    my_tracer = PerfTracker()
except:
    my_tracer = None
在訓練代碼中標記step。
每次調用tracer.step(),PerfTracker會記錄一次,用於控制採集的iteration數量。
while iteration < args.train_iters:
    ...	# 訓練代碼
    if my_tracer is not None:
        my_tracer.step() # 標記一個step
以下是完整的training.py樣本:
import torch import time import torch.distributed as dist import argparse try: from c4d_perftracker_collector.PerfTracker import PerfTracker my_tracer = PerfTracker() except: my_tracer = None dist.init_process_group("nccl") torch.cuda.set_device(dist.get_rank()) # 檢查CUDA是否可用 if torch.cuda.is_available(): print("CUDA is available!") device = torch.device('cuda') # 使用預設的CUDA裝置 else: print("CUDA is not available.") device = torch.device('cpu') # 如果沒有CUDA,則使用CPU def matmul(): matrix_a = torch.randn(1000, 1000) matrix_b = torch.randn(1000, 1000) # 將矩陣移動到CUDA裝置 matrix_a = matrix_a.to(device) matrix_b = matrix_b.to(device) # 執行矩陣乘法 result = torch.matmul(matrix_a, matrix_b) result_cpu = result.to('cpu') print(result_cpu) del matrix_a, matrix_b, result torch.cuda.empty_cache() for i in range(1000): matmul() time.sleep(dist.get_rank()) print("Epoch:", i) if my_tracer is not None: my_tracer.step() dist.barrier()將訓練代碼檔案(training.py)上傳到儲存目錄。本樣本使用Object Storage Service儲存空間。
建立訓練任務
建立訓練任務時,在啟動命令中下載並安裝PerfTracker,其餘配置與普通任務相同。配置完成後單擊确定建立任務。操作樣本:
參數
描述
环境信息
镜像配置
選擇PyTorch2.0或以上版本。本樣本選擇
easyanimate:1.1.5-pytorch2.2.0-gpu-py310-cu118-ubuntu22.04。存储挂载
單擊OSS,選擇訓練代碼檔案所在的OSS儲存目錄,並配置挂载路径,本方案樣本為
/mnt/data/。启动命令
# 下載PerfTracker安裝包
wget -t 5 -w 2 -P /mnt/data https://network-research-lingjun-open-oss.oss-cn-hangzhou.aliyuncs.com/files/c4d_perftracker_collector-1.4.0-py3-none-any.whl
# 安裝PerfTracker
pip3 install /mnt/data/c4d_perftracker_collector-1.4.0-py3-none-any.whl
# 執行訓練代碼(例如訓練代碼為training.py)
CUDA_VISIBLE_DEVICES=0,1,2,3,4,5,6,7 torchrun --nproc_per_node=4 /mnt/data/training.py
其中
/mnt/data/為資料集掛載路徑,可以替換成您的目錄。說明大規模任務並發下載可能導致速度緩慢,建議提前將PerfTracker安裝包下載到儲存目錄中。
资源信息
框架
選擇PyTorch。
任务资源
選擇資源規格。本樣本選擇
ecs.gn6e-c12g1.12xlarge。在任務運行期間,單擊目標任務名稱,並在概覽頁簽的執行個體地區,單擊master執行個體操作列下的進入容器。
執行以下命令儲存分析結果,用於診斷效能問題。
方式一:僅儲存分析結果,不儲存原始trace。
c4d_perftracker --trigger-on --auto-analyze --output-dir /mnt/data/方式二(推薦):儲存空間充足時,同時儲存分析結果和原始trace,便於人工確認。注意每個Worker的trace通常超過幾百MB,診斷完畢後可手動刪除。
c4d_perftracker --trigger-on --auto-analyze --output-dir /mnt/data/ --save-raw-trace all其中
/mnt/data/表示原始trace儲存的目錄。可以將其配置為您的資料集掛載目錄,原始trace將儲存到資料集中。
儲存分析結果後,可通過PerfDisplay查看分析報告。更多參數說明見附錄。
查看分析結果
參考分析模式產生並儲存分析結果。命令執行成功後,系統會在該目錄中產生
<時間戳記>/PerfDisplay檔案夾。分析完成後,OSS Bucket 檔案清單中將產生 PerfDisplay/ 和 raw_trace/ 兩個檔案夾。將PerfDisplay檔案夾拷貝到資料來源的掛載目錄
/mnt/data中,參考命令列工具ossutil 2.0,將PerfDisplay下載到本地。(可以將檔案夾壓縮後再進行下載)。tar -cvf trace.tar PerfDisplay/ mv trace.tar /mnt/data在本地終端中,進入
PerfDisplay檔案夾並運行sudo python3 app.py(Linux可能不需要sudo),然後在瀏覽器中開啟http://127.0.0.1:5000/,即可在可視化頁面中查看任務效能報告。
PerfTracker展示所有影響效能的函數報告,並標註異常。按函數類型分類展示:
GPU計算函數
GPU Compute:
[2025-03-04 06:04:00,046 PerfTracker] (compute_functions.py 131) INFO: {
    "min/median/max GPU utilization (in [0,1])": [
        0.27586059769318555,
        0.28605496203987174,
        0.2945494558115959
    ],
    "workers with abnormal GPU utilization": {},
    "major_kernel_executions": {
        "void multi_tensor_apply_kernel<TensorListMetadata<4>, AdamFunctor<float, float, int>, float, float, float, float, float, float, adamMode_t, float>(long, int volatile*, TensorListMetadata<4>, AdamFunctor<float, float, int>, float, float, float, float, float, float, adamMode_t, float)320_1_1|512_1_1": {
            "median cost per execution (ms)": 403.7,
            "bottleneck ratio (in [0,1])": 0.01608086667957405
        },
        "sm80_xmma_gemm_f16f16_f16f32_f32_nn_n_tilesize160x128x32_stage4_warpsize2x2x1_tensor16x8x16_kernel7_16_1|128_1_1": {
            "median cost per execution (ms)": 130.0,
            "bottleneck ratio (in [0,1])": 0.015779752711771233
        },
        "ampere_fp16_s16816gemm_fp16_128x128_ldg8_f2f_stages_32x5_nt16_32_1|128_1_1": {
            "median cost per execution (ms)": 132.60000000000002,
            "bottleneck ratio (in [0,1])": 0.013880912782219888
        },
        "void (anonymous namespace)::indexing_backward_kernel<c10::Half, 4>(long const*, long const*, c10::Half const*, c10::Half*, long, long, long, long, bool)256_16_1|32_4_1": {
            "median cost per execution (ms)": 1202.25,
            "bottleneck ratio (in [0,1])": 0.012148757934008617
        },
        "ampere_fp16_s16816gemm_fp16_128x128_ldg8_f2f_stages_32x5_nt16_24_1|128_1_1": {
            "median cost per execution (ms)": 105.6,
            "bottleneck ratio (in [0,1])": 0.005656117080836238
        }
    },
    "workers with potential GPU issues": [],
    "detailed report": {}
}
報告解讀:
"min/median/max GPU utilization (in [0,1])"表明該任務所有Worker的GPU利用率最高為29.4%,最低為27.5%,中位元為28.6%。"workers with abnormal GPU utilization"為空白,表明GPU利用率沒有顯著離群的Worker(如果非空,則會列出離群的Worker號及其GPU利用率)。"major_kernel_executions"列出了幾個總耗時較長的GPU Kernel執行情況,包括平均單次執行耗時(median cost per execution),以及占端到端效能的百分比(bottleneck ratio)。"workers with potential GPU issues"會列出GPU核函數執行較慢的Worker號,若為空白則表示所有Worker都正常。"detailed report"會在"workers with potential GPU issues"非空時,列出具體哪個Worker執行的哪個Kernel函數比正常Worker慢,以及慢多少。
GPU顯存操作函數
GPU memory operations:
[2025-03-04 06:04:00,048 PerfTracker] (gpu_mem.py 37) INFO: {
    "Memcpy DtoD (Device -> Device)": {
        "avg bottleneck ratio (in [0,1])": 0.010486858246092,
        "abnormal_workers": {
            "job_x08j11173.cloud.sqa.na131_2_122482.json": 0.010614755325049817,
            "job_x08j11173.cloud.sqa.na131_8_122483.json": 0.0105935370201344,
            "job_x08j11173.cloud.sqa.na131_1_122484.json": 0.010571838319204434,
            "job_x08j11173.cloud.sqa.na131_0_122485.json": 0.010551186610995748,
            "job_x08j11173.cloud.sqa.na131_2_122487.json": 0.010408514784026183,
            "job_x08j11173.cloud.sqa.na131_5_122489.json": 0.010394903160689894,
            "job_x08j11173.cloud.sqa.na131_8_122486.json": 0.010387693451926115,
            "job_x08j11173.cloud.sqa.na131_9_122488.json": 0.010372437296709398
        }
    }
}
報告解讀:
"avg bottleneck ratio (in [0,1])"表明該任務在監控期間Memcpy DtoD的平均時間佔比為1.048%。"abnormal_workers"表明其中8個Worker的Memcpy DtoD函數耗時異常。對於GPU顯存操作函數,當bottleneck ratio(即運行時間長度除去和計算overlap的部分)大於0.01(1%)即被認為異常。
集合通訊
Communication:
{
    "nvlink ring send": {
        "ncclDevKernel_AllReduce_Sum_f16_RING_LL(ncclDevComm*, unsigned long, ncclWork*)": {
            "example_of_normal_worker": {
                "worker": "job_x08j11173.cloud.sqa.na131_0_66930.json",
                "different from other workers": 0,
                "features": {
                    "bottleneck ratio (in [0,1])": 0.2743985289797289,
                    "avg throughput (%)": 73.75921390374332,
                    "throughput std (%)": 11.384679144385027
                }
            },
            "abnormal_workers": []
        }
    },
    "nvlink ring recv": {
        "ncclDevKernel_AllReduce_Sum_f16_RING_LL(ncclDevComm*, unsigned long, ncclWork*)": {
            "example_of_normal_worker": {
                "worker": "job_x08j11173.cloud.sqa.na131_3_66933.json",
                "different from other workers": 2,
                "features": {
                    "bottleneck ratio (in [0,1])": 0.27346865947352955,
                    "avg throughput (%)": 72.70337362637363,
                    "throughput std (%)": 12.658093406593407
                }
            },
            "abnormal_workers": []
        }
    },
    "pcie sendrecv send": {
        "ncclDevKernel_SendRecv(ncclDevComm*, unsigned long, ncclWork*)": {
            "example_of_normal_worker": {
                "worker": "job_x08j11173.cloud.sqa.na131_0_66930.json",
                "different from other workers": 3,
                "features": {
                    "bottleneck ratio (in [0,1])": 0.07248997985478658,
                    "avg throughput (%)": 46.667,
                    "throughput std (%)": 14.636000000000001
                }
            },
            "abnormal_workers": []
        }
    },
    "pcie sendrecv recv": {
        "ncclDevKernel_SendRecv(ncclDevComm*, unsigned long, ncclWork*)": {
            "example_of_normal_worker": {
                "worker": "job_x08j11173.cloud.sqa.na131_7_66936.json",
                "different from other workers": 1,
                "features": {
                    "bottleneck ratio (in [0,1])": 0.0643436909425455,
                    "avg throughput (%)": 54.833333333333336,
                    "throughput std (%)": 14.166666666666666
                }
            },
            "abnormal_workers": []
        }
    },
    "pcie ring send": {
        "ncclDevKernel_AllReduce_Sum_f16_RING_LL(ncclDevComm*, unsigned long, ncclWork*)": {
            "example_of_normal_worker": {
                "worker": "job_x08j11173.cloud.sqa.na131_0_66930.json",
                "different from other workers": 0,
                "features": {
                    "bottleneck ratio (in [0,1])": 0.2743985289797289,
                    "avg throughput (%)": 41.36698734177215,
                    "throughput std (%)": 14.653768987341774
                }
            },
            "abnormal_workers": []
        }
    },
    "pcie ring recv": {
        "ncclDevKernel_AllReduce_Sum_f16_RING_LL(ncclDevComm*, unsigned long, ncclWork*)": {
            "example_of_normal_worker": {
                "worker": "job_x08j11173.cloud.sqa.na131_0_66930.json",
                "different from other workers": 0,
                "features": {
                    "bottleneck ratio (in [0,1])": 0.2743985289797289,
                    "avg throughput (%)": 41.5311475409836,
                    "throughput std (%)": 15.282721311475411
                }
            },
            "abnormal_workers": []
        }
    }
}
報告按通訊類型分類展示集合通訊函數的效能分析:
"example_of_normal_worker"列出了該函數執行的常態績效參數,包括bottleneck ratio(指占端到端時間的佔比,已除去和計算overlap的時間)、avg throughput和throughput std。"abnormal_workers"若非空,則會列出所有該通訊函數效能異常的Worker及其效能指標。
CUDA runtime
CUDA Runtime:
[2025-03-04 06:04:00,047 PerfTracker] (cuda_runtimes.py 43) INFO: {
    "cudaLaunchKernel": {
        "avg bottleneck ratio (in [0,1])": 0.039727736621541394,
        "avg execution time / monitoring duration (in [0,1])": 0.06956947111288565,
        "abnormal_workers": {
            "job_x08j11173.cloud.sqa.na131_5_122489.json": 0.05342638907019616,
            "job_x08j11173.cloud.sqa.na131_8_122483.json": 0.05125160206973098,
            "job_x08j11173.cloud.sqa.na131_2_122487.json": 0.04770049253555521,
            "job_x08j11173.cloud.sqa.na131_8_122486.json": 0.04358845044879828,
            "job_x08j11173.cloud.sqa.na131_0_122485.json": 0.042635952262081556,
            "job_x08j11173.cloud.sqa.na131_9_122488.json": 0.0354174573296689,
            "job_x08j11173.cloud.sqa.na131_1_122484.json": 0.023585242093250733,
            "job_x08j11173.cloud.sqa.na131_2_122482.json": 0.02021630716304934
        }
    }
}
報告解讀:
"avg bottleneck ratio (in [0,1])"表明該任務在監控期間cudaLaunchKernel的平均時間佔比(已排除和計算overlap的部分)為3.97%。"avg execution time / monitoring duration (in [0,1])"表示cudaLaunchKernel的平均時間佔比(不排除和計算overlap的部分)為6.95%。"abnormal_workers"表明其中8個Worker的cudaLaunchKernel函數耗時異常。對於CUDA Runtime函數、bottleneck ratio(即運行時間長度除去和計算overlap的部分)大於0.01(1%)即被認為異常。
Python函數
Python functions:
[2025-03-04 06:04:00,048 PerfTracker] (python_functions.py 43) INFO: {
    "pretrain_gpt.py: <module>|megatron/training.py: pretrain|megatron/training.py: train|megatron/training.py: train_step|megatron/core/pipeline_parallel/schedules.py: forward_backward_pipelining_without_interleaving|megatron/core/pipeline_parallel/schedules.py: backward_step|megatron/core/pipeline_parallel/schedules.py: custom_backward|<built-in method run_backward of torch._C._EngineBase object at 0x>": {
        "job_x08j11173.cloud.sqa.na131_2_122487.json": 0.16970858578301054,
        "job_x08j11173.cloud.sqa.na131_5_122489.json": 0.16821543761561655,
        "job_x08j11173.cloud.sqa.na131_0_122485.json": 0.16787961852913025,
        "job_x08j11173.cloud.sqa.na131_8_122483.json": 0.16769273336153187,
        "job_x08j11173.cloud.sqa.na131_8_122486.json": 0.14482595694389258,
        "job_x08j11173.cloud.sqa.na131_9_122488.json": 0.10359829140378449,
        "job_x08j11173.cloud.sqa.na131_1_122484.json": 0.06543764774209325,
        "job_x08j11173.cloud.sqa.na131_2_122482.json": 0.06217541348063737
    },
    "pretrain_gpt.py: <module>|megatron/training.py: pretrain|megatron/training.py: train|megatron/training.py: train_step|megatron/core/pipeline_parallel/schedules.py: forward_backward_pipelining_without_interleaving|megatron/core/pipeline_parallel/schedules.py: forward_step|pretrain_gpt.py: forward_step|nn.Module: DistributedDataParallel_0|torch/nn/modules/module.py: _call_impl|megatron/core/distributed/distributed_data_parallel.py: forward|nn.Module: Float16Module_0|torch/nn/modules/module.py: _call_impl|megatron/model/module.py: forward|nn.Module: GPTModel_0|torch/nn/modules/module.py: _call_impl|megatron/model/gpt_model.py: forward|nn.Module: TransformerLanguageModel_0|torch/nn/modules/module.py: _call_impl|megatron/model/language_model.py: forward|nn.Module: ParallelTransformer_0|torch/nn/modules/module.py: _call_impl|megatron/model/transformer.py: forward": {
        "job_x08j11173.cloud.sqa.na131_9_122488.json": 0.02471835416438489,
        "job_x08j11173.cloud.sqa.na131_0_122485.json": 0.02022024568555683,
        "job_x08j11173.cloud.sqa.na131_2_122482.json": 0.015394834126935101,
        "job_x08j11173.cloud.sqa.na131_2_122487.json": 0.011625367332189284
    },
    "pretrain_gpt.py: <module>|megatron/training.py: pretrain|megatron/training.py: train|megatron/training.py: train_step": {
        "job_x08j11173.cloud.sqa.na131_0_122485.json": 0.012272193902698852
    },
    "autograd::engine::evaluate_function: LinearWithGradAccumulationAndAsyncCommunicationBackward|LinearWithGradAccumulationAndAsyncCommunicationBackward|torch/autograd/function.py: apply|torch/cuda/amp/autocast_mode.py: decorate_bwd|megatron/core/tensor_parallel/layers.py: backward|<built-in method matmul of Tensor object at 0x>|aten::matmul|aten::mm": {
        "job_x08j11173.cloud.sqa.na131_2_122487.json": 0.014066713574814782,
        "job_x08j11173.cloud.sqa.na131_0_122485.json": 0.013168949365116213,
        "job_x08j11173.cloud.sqa.na131_8_122483.json": 0.013000378454189552,
        "job_x08j11173.cloud.sqa.na131_5_122489.json": 0.012500119397472594,
        "job_x08j11173.cloud.sqa.na131_8_122486.json": 0.012470581043494208
    },
    "autograd::engine::evaluate_function: FastLayerNormFNBackward|FastLayerNormFNBackward|torch/autograd/function.py: apply|apex/contrib/layer_norm/layer_norm.py: backward|<built-in method ln_bwd of PyCapsule object at 0x>": {
        "job_x08j11173.cloud.sqa.na131_0_122485.json": 0.010127612754279463
    },
    "pretrain_gpt.py: <module>|megatron/training.py: pretrain|megatron/training.py: train|megatron/training.py: train_step|megatron/core/pipeline_parallel/schedules.py: forward_backward_pipelining_without_interleaving": {
        "job_x08j11173.cloud.sqa.na131_2_122487.json": 0.01041679269251709
    },
    "autograd::engine::evaluate_function: torch::autograd::AccumulateGrad": {
        "job_x08j11173.cloud.sqa.na131_8_122486.json": 0.013633967050768714
    }
}
報告列出執行時間佔比超過1%(排除與GPU計算、通訊重疊的時間)的Python函數,按函數名聚類,展示各Worker上的執行時間佔比。
附錄
PerfTracker更多參數使用說明
相關參考
PerfTracker原理詳見:PerfTracker: Online Performance Troubleshooting for Large-scale Model Training in Production。