APISIX OpenTelemetry外掛程式支援收集APISIX的調用鏈資料並上報至OpenTelemetry Collector,再由OpenTelemetry Collector轉寄上報至Managed Service for OpenTelemetry。APISIX OpenTelemetry外掛程式目前僅支援通過HTTP方式上報調用鏈資料至OpenTelemetry Collector,不支援gRPC方式上報。
前提條件
APISIX版本 ≥ v2.13.0。
新版控制台
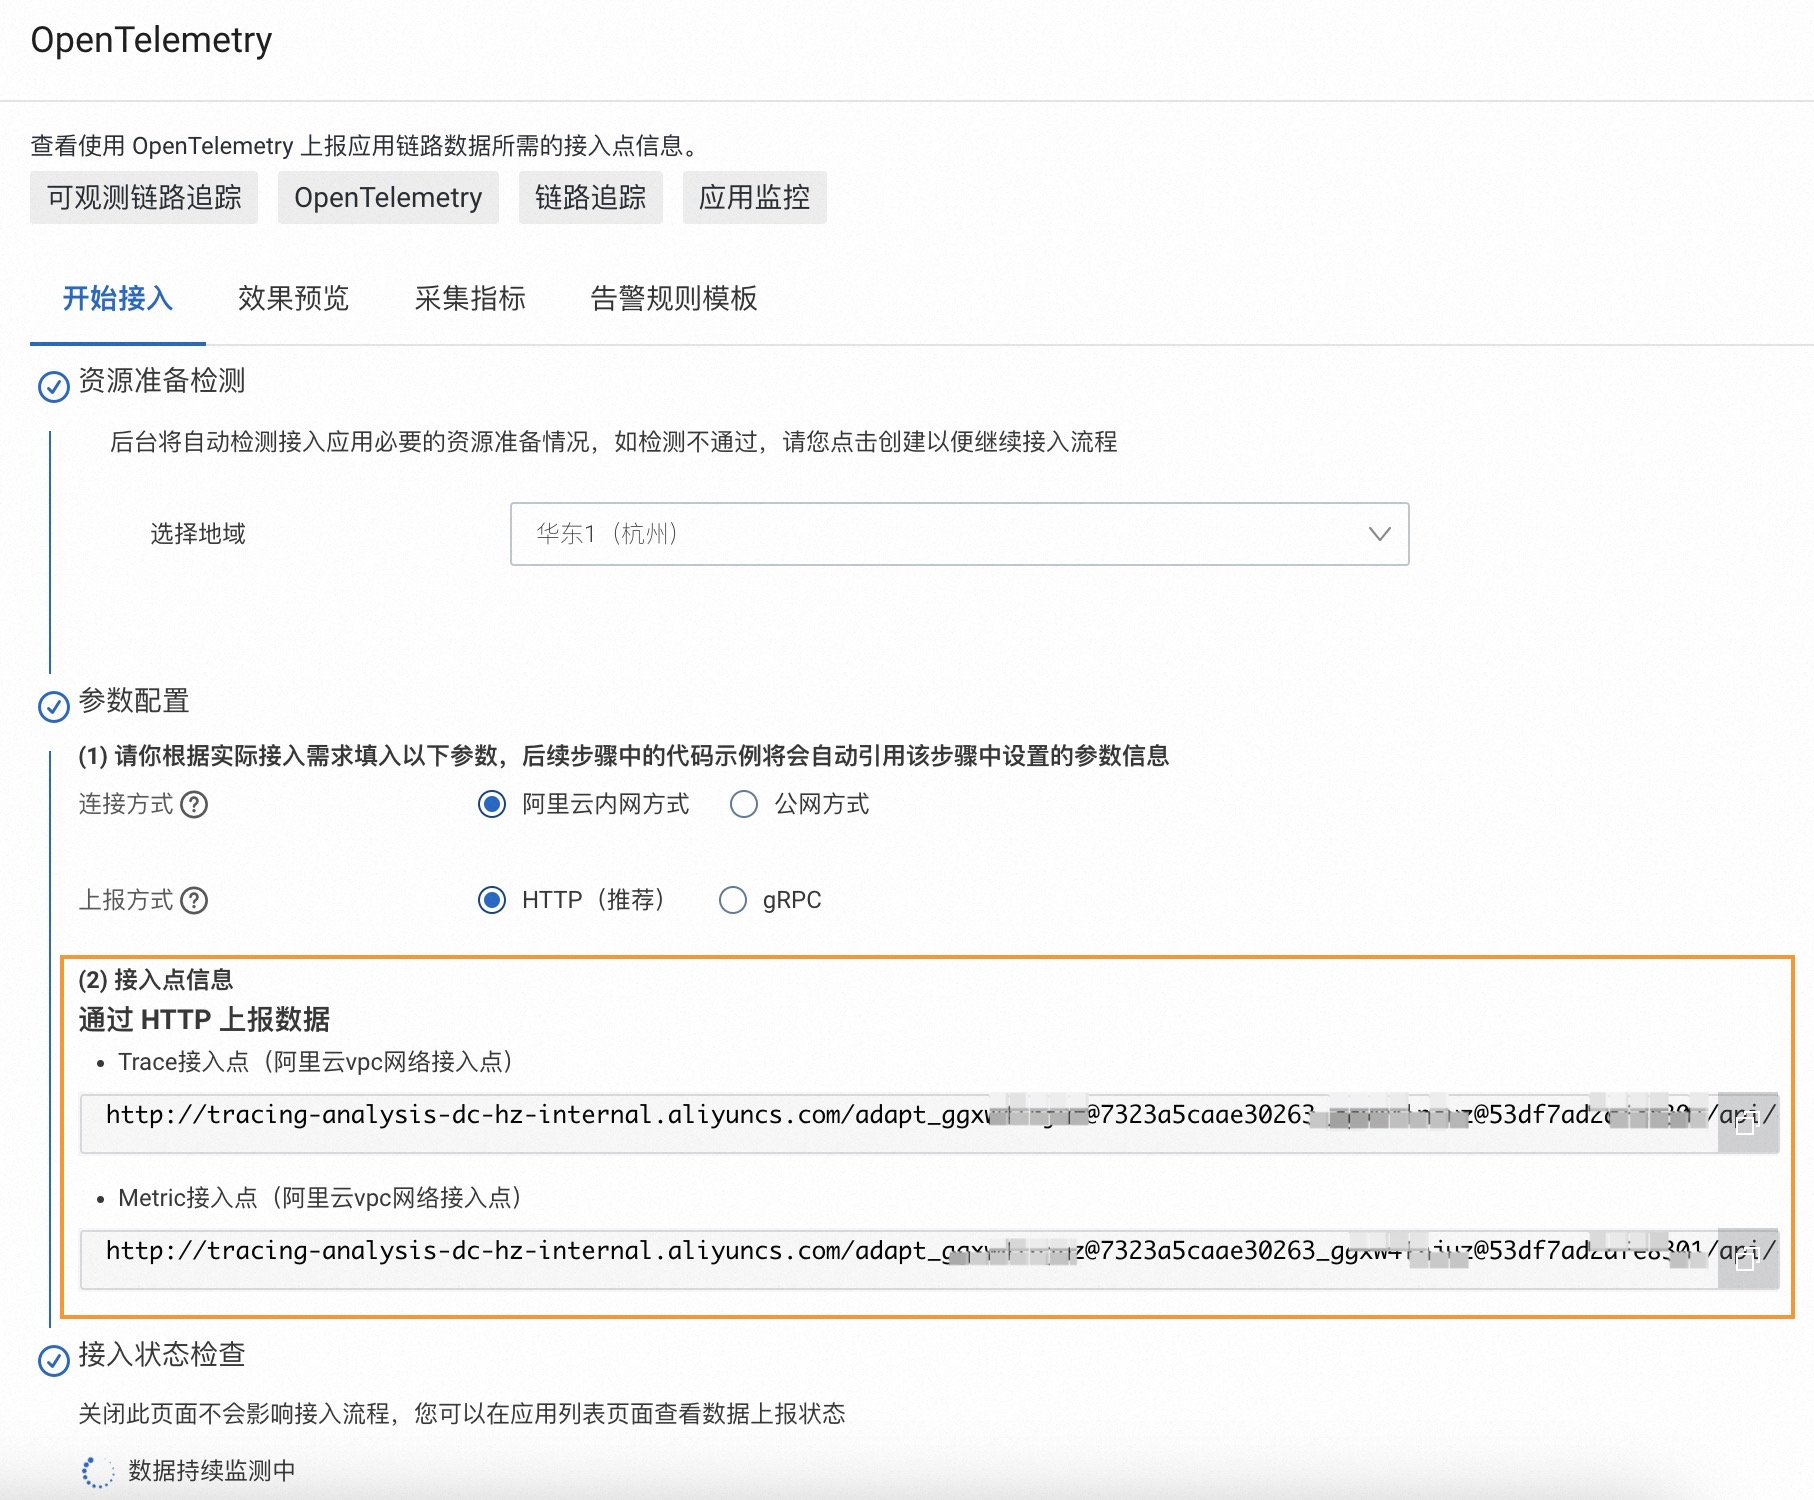
登入可觀測鏈路 OpenTelemetry 版控制台,在左側導覽列單擊接入中心。
在開源架構地區單擊OpenTelemetry卡片。
在彈出的OpenTelemetry面板中選擇資料需要上報的地區。
說明初次接入的地區將會自動進行資源初始化。
選擇串連方式和上報方式,然後複製存取點資訊。
串連方式:若您的服務部署在阿里雲上,且所屬地區與選擇的接入地區一致,推薦使用阿里雲內網方式,否則選擇公網方式。
上報方式:根據用戶端支援的協議類型選擇HTTP或gRPC協議上報資料。
舊版控制台
在左側導覽列單擊叢集配置,然後在右側頁面單擊存取點資訊頁簽。
在頁面頂部選擇需要接入的地區,然後在叢集資訊地區開啟顯示Token開關。
在用戶端採集工具地區單擊OpenTelemetry。
在相關資訊列中,擷取存取點資訊。
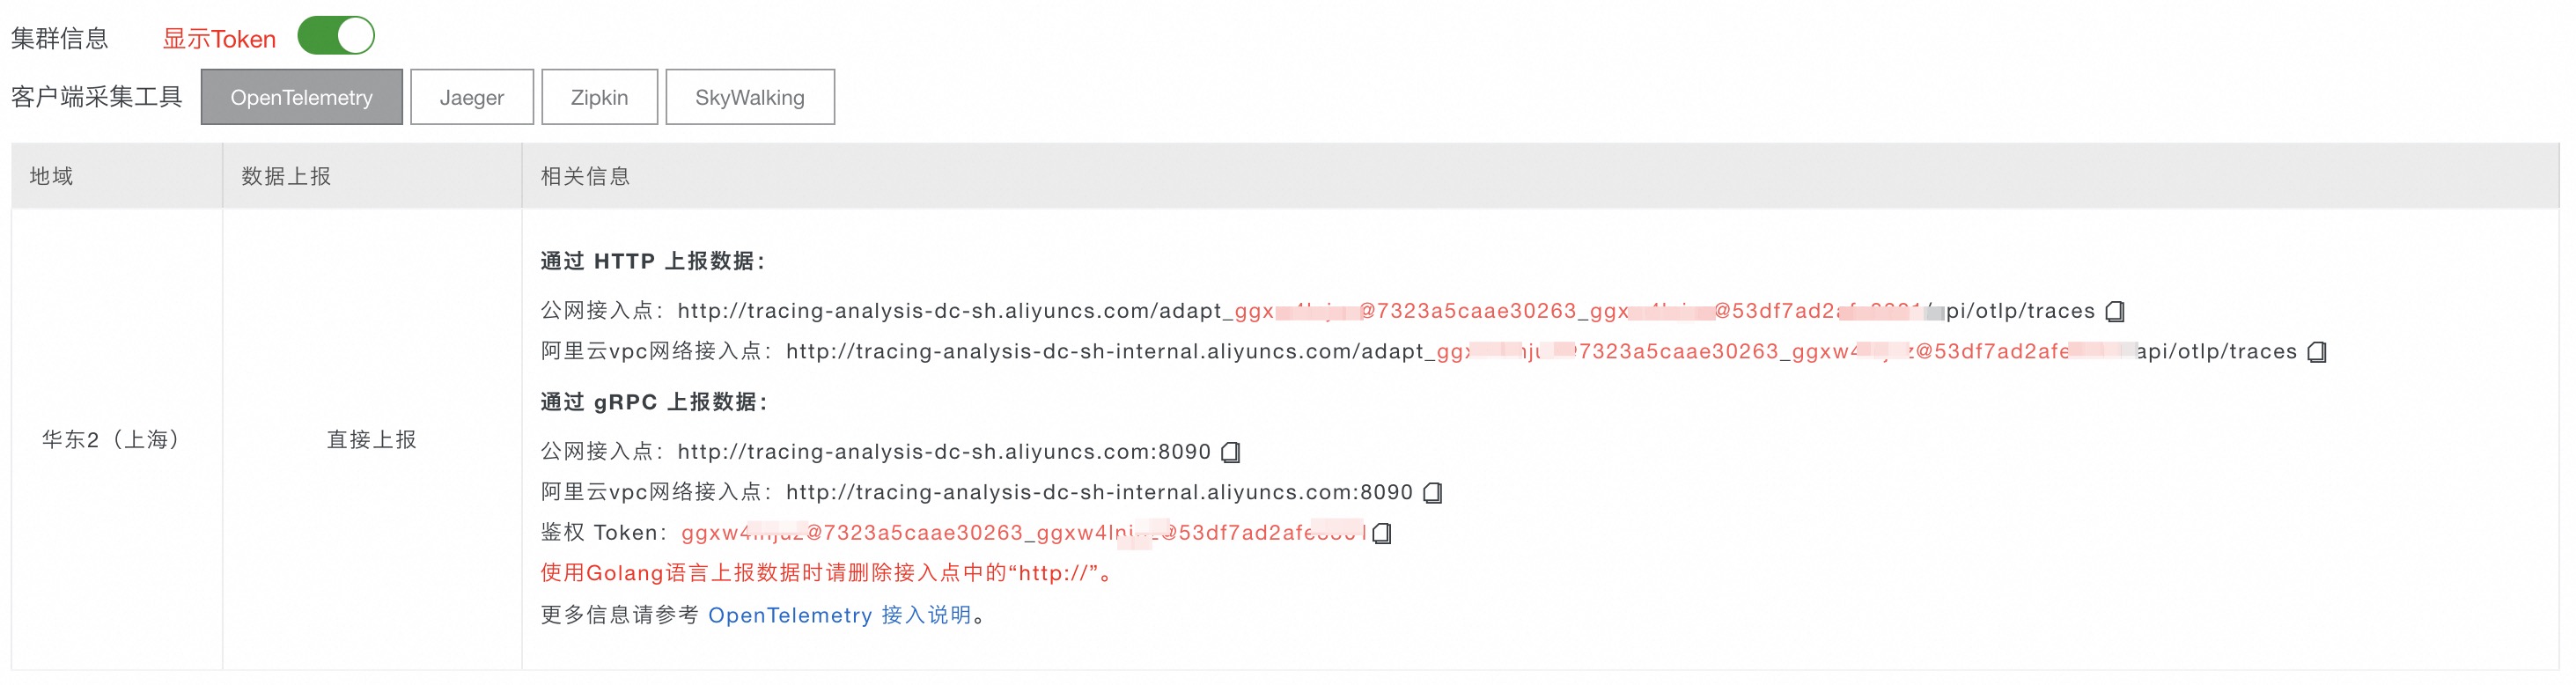 說明
說明如果應用部署於阿里雲生產環境,則選擇阿里雲VPC網路存取點,否則選擇公網存取點。
方案概覽
使用OpenTelemetry對APISIX進行鏈路追蹤,主要分為以下幾步:
部署OpenTelemetry Collector:OpenTelemetry Collector是一個開源可觀測資料擷取器,負責接收、處理和匯出來自各種資料來源的可觀測資料(例如調用鏈)。
在APISIX中啟用OpenTelemetry外掛程式:通過修改APISIX的設定檔啟用OpenTelemetry外掛程式,允許OpenTelemetry Collector收集APISIX的可觀測資料。
設定APISIX OpenTelemetry外掛程式生效範圍:通過APISIX Admin API可以設定OpenTelemetry外掛程式的生效範圍。
查看APISIX調用鏈:您可以在控制台查看由OpenTelemetry產生的APISIX調用鏈。
接入步驟
一. 部署OpenTelemetry Collector
方式一:通過ACK控制台部署
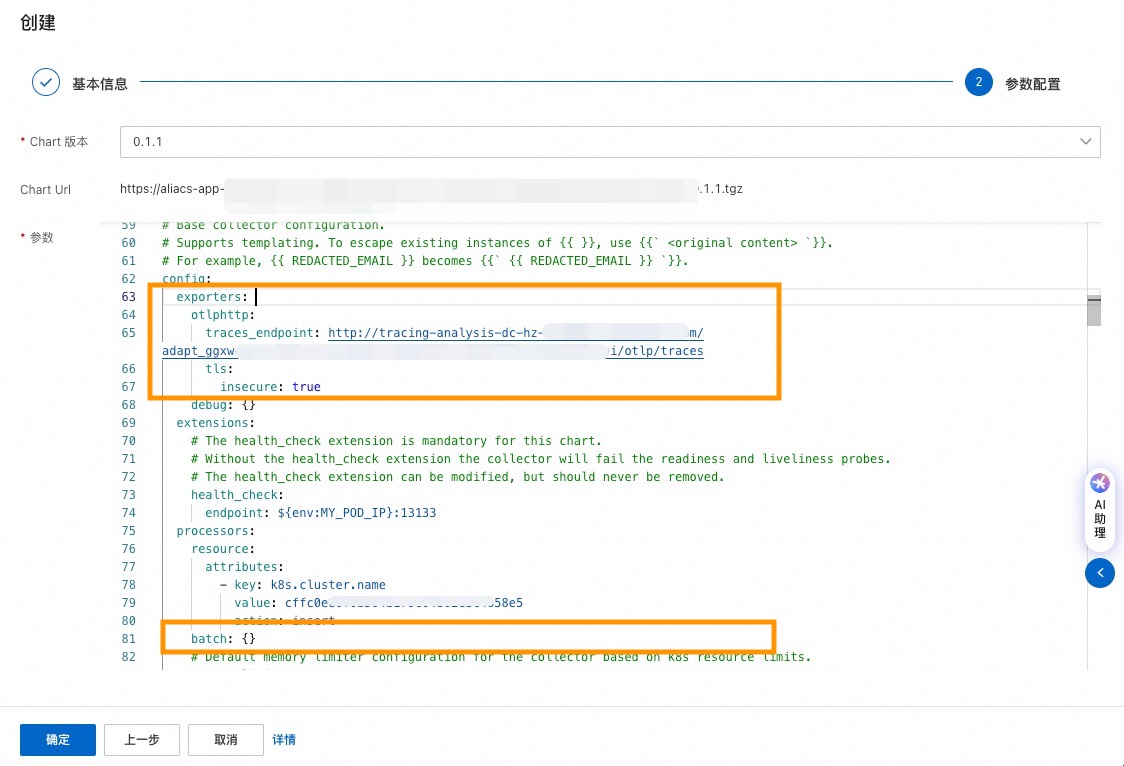
登入Container Service管理主控台,在左側導覽列選擇。
在應用市場中搜尋並單擊
opentelemetry-collector,單擊頁面右上方一鍵部署。在建立頁面選擇需要部署
opentelemetry-collector的叢集,然後單擊下一步。在參數配置頁面,增加如下參數,然後單擊確定。
說明請將
${HTTP Endpoint}替換為前提條件中擷取的HTTP存取點,如:http://tracing-analysis-dc-hz.aliyuncs.com/adapt_xxxxx/api/otlp/traces。receivers: otlp: protocols: grpc: endpoint: 0.0.0.0:4317 http: cors: allowed_origins: - http://* - https://* endpoint: 0.0.0.0:4318 # OTLP HTTP Receiver processors: batch: exporters: otlphttp: traces_endpoint: '${HTTP Endpoint}' tls: insecure: true service: pipelines: traces: receivers: [otlp] processors: [batch] exporters: [otlphttp]以下為樣本圖:
方式二:手動部署
下文以Docker方式為例,介紹如何部署OpenTelemetry Collector。更多部署方式,請參見下載並部署OpenTelemetry Collector。
建立
opentelemetry-config.yaml檔案,並將下面的內容拷貝至檔案。該檔案用於定義和配置OpenTelemetry Collector的行為和功能,包括如何接收、處理和匯出資料。
說明請將
${HTTP Endpoint}替換為前提條件中擷取的HTTP存取點,如:http://tracing-analysis-dc-hz.aliyuncs.com/adapt_xxxxx/api/otlp/traces。receivers: otlp: protocols: grpc: endpoint: 0.0.0.0:4317 http: cors: allowed_origins: - http://* - https://* endpoint: 0.0.0.0:4318 # OTLP HTTP Receiver processors: batch: exporters: otlphttp: traces_endpoint: '${HTTP Endpoint}' tls: insecure: true service: pipelines: traces: receivers: [otlp] processors: [batch] exporters: [otlphttp]啟動OpenTelemetry Collector。
docker run -v $(pwd)/opentelemetry-config.yaml:/etc/otelcol-contrib/config.yaml otel/opentelemetry-collector-contrib:0.105.0
二. 在APISIX中啟用OpenTelemetry外掛程式
APISIX 3.12版本及以上
您需要在APISIX的
config.yaml設定檔中啟用opentelemetry外掛程式。... plugins: ... # 其他已經啟用的外掛程式 - opentelemetry # 啟用OpenTelemetry外掛程式配置 OpenTelemetry 相關參數。
說明請將
${Service Name}替換為應用程式名稱,例如APISIX,該應用程式名稱會顯示在Managed Service for OpenTelemetry的應用列表中。${Host IP}為主機IP地址,設定後可以在步驟四展示的Trace詳情頁右側Span詳情地區看到IP地址。請將
${OpenTelemetry Collector Address}替換為Collector的訪問地址,如127.0.0.1。請將
${admin_key}替換為用於訪問 APISIX Admin API 的身份認證密鑰。關於OpenTelemetry外掛程式的更多上報配置,請參見APISIX Opentelemetry 外掛程式上報配置。
curl http://127.0.0.1:9180/apisix/admin/plugin_metadata/opentelemetry -H "X-API-KEY: ${admin_key}" -X PUT -d ' { "trace_id_source": "x-request-id", "resource": { "service.name": "${Service Name}", "host.ip":"${Host IP}" }, "collector": { "address": "${OpenTelemetry Collector Address}:4318", "request_timeout": 3, "batch_span_processor": { "drop_on_queue_full": false, "max_queue_size": 1024, "batch_timeout": 2, "inactive_timeout": 1, "max_export_batch_size": 16 }, "set_ngx_var": false } }'
APISIX 3.12版本以下
您需要在APISIX的config.yaml設定檔中啟用opentelemetry外掛程式並修改Collector配置。
請將
${Service Name}替換為應用程式名稱,例如APISIX,該應用程式名稱會顯示在Managed Service for OpenTelemetry的應用列表中。${Host IP}為主機IP地址,設定後可以在步驟四展示的Trace詳情頁右側Span詳情地區看到IP地址。請將
${OpenTelemetry Collector Address}替換為Collector的訪問地址,如127.0.0.1。關於OpenTelemetry外掛程式的更多上報配置,請參見APISIX Opentelemetry 外掛程式上報配置。
...
plugins:
  ... # 其他已經啟用的外掛程式
  - opentelemetry # 啟用OpenTelemetry外掛程式
plugin_attr:
...
opentelemetry: # OpenTelemetry相關配置
resource:
service.name: ${Service Name} # 應用程式名稱
host.ip: ${Host IP} # 主機IP地址
collector:
address: ${OpenTelemetry Collector Address}:4318 # OpenTelemetry Collector OTLP HTTP Receiver地址
request_timeout: 3
batch_span_processor: # 配置批量處理
drop_on_queue_full: false
max_queue_size: 6
batch_timeout: 2
inactive_timeout: 1
max_export_batch_size: 2三. 設定APISIX OpenTelemetry外掛程式生效範圍
全域啟用OpenTelemetry外掛程式。
說明sampler設定為always_on代表全採樣,每次請求都會被追蹤併產生調用鏈。關於OpenTelemetry外掛程式的更多屬性配置,請參見APISIX Opentelemetry 外掛程式屬性配置。
curl 'http://127.0.0.1:9080/apisix/admin/global_rules/1' \
-H 'X-API-KEY:  edd1c9f034335f136f87ad84b625c8f1' \
-X PUT -d '{
  "plugins": {
      "opentelemetry": {
          "sampler": {
              "name": "always_on"
          }
      }
  }
}'
僅在指定路由啟用OpenTelemetry外掛程式。
curl http://127.0.0.1:9080/apisix/admin/routes/1 \
-H 'X-API-KEY: edd1c9f034335f136f87ad84b625c8f1' \
-X PUT -d '
{
  "uri": "/get",
  "plugins": {
      "opentelemetry": {
          "sampler": {
              "name": "always_on"
          }
      }
  },
  "upstream": {
      "type": "roundrobin",
      "nodes": {
          "httpbin.org:80": 1
      }
  }
}'
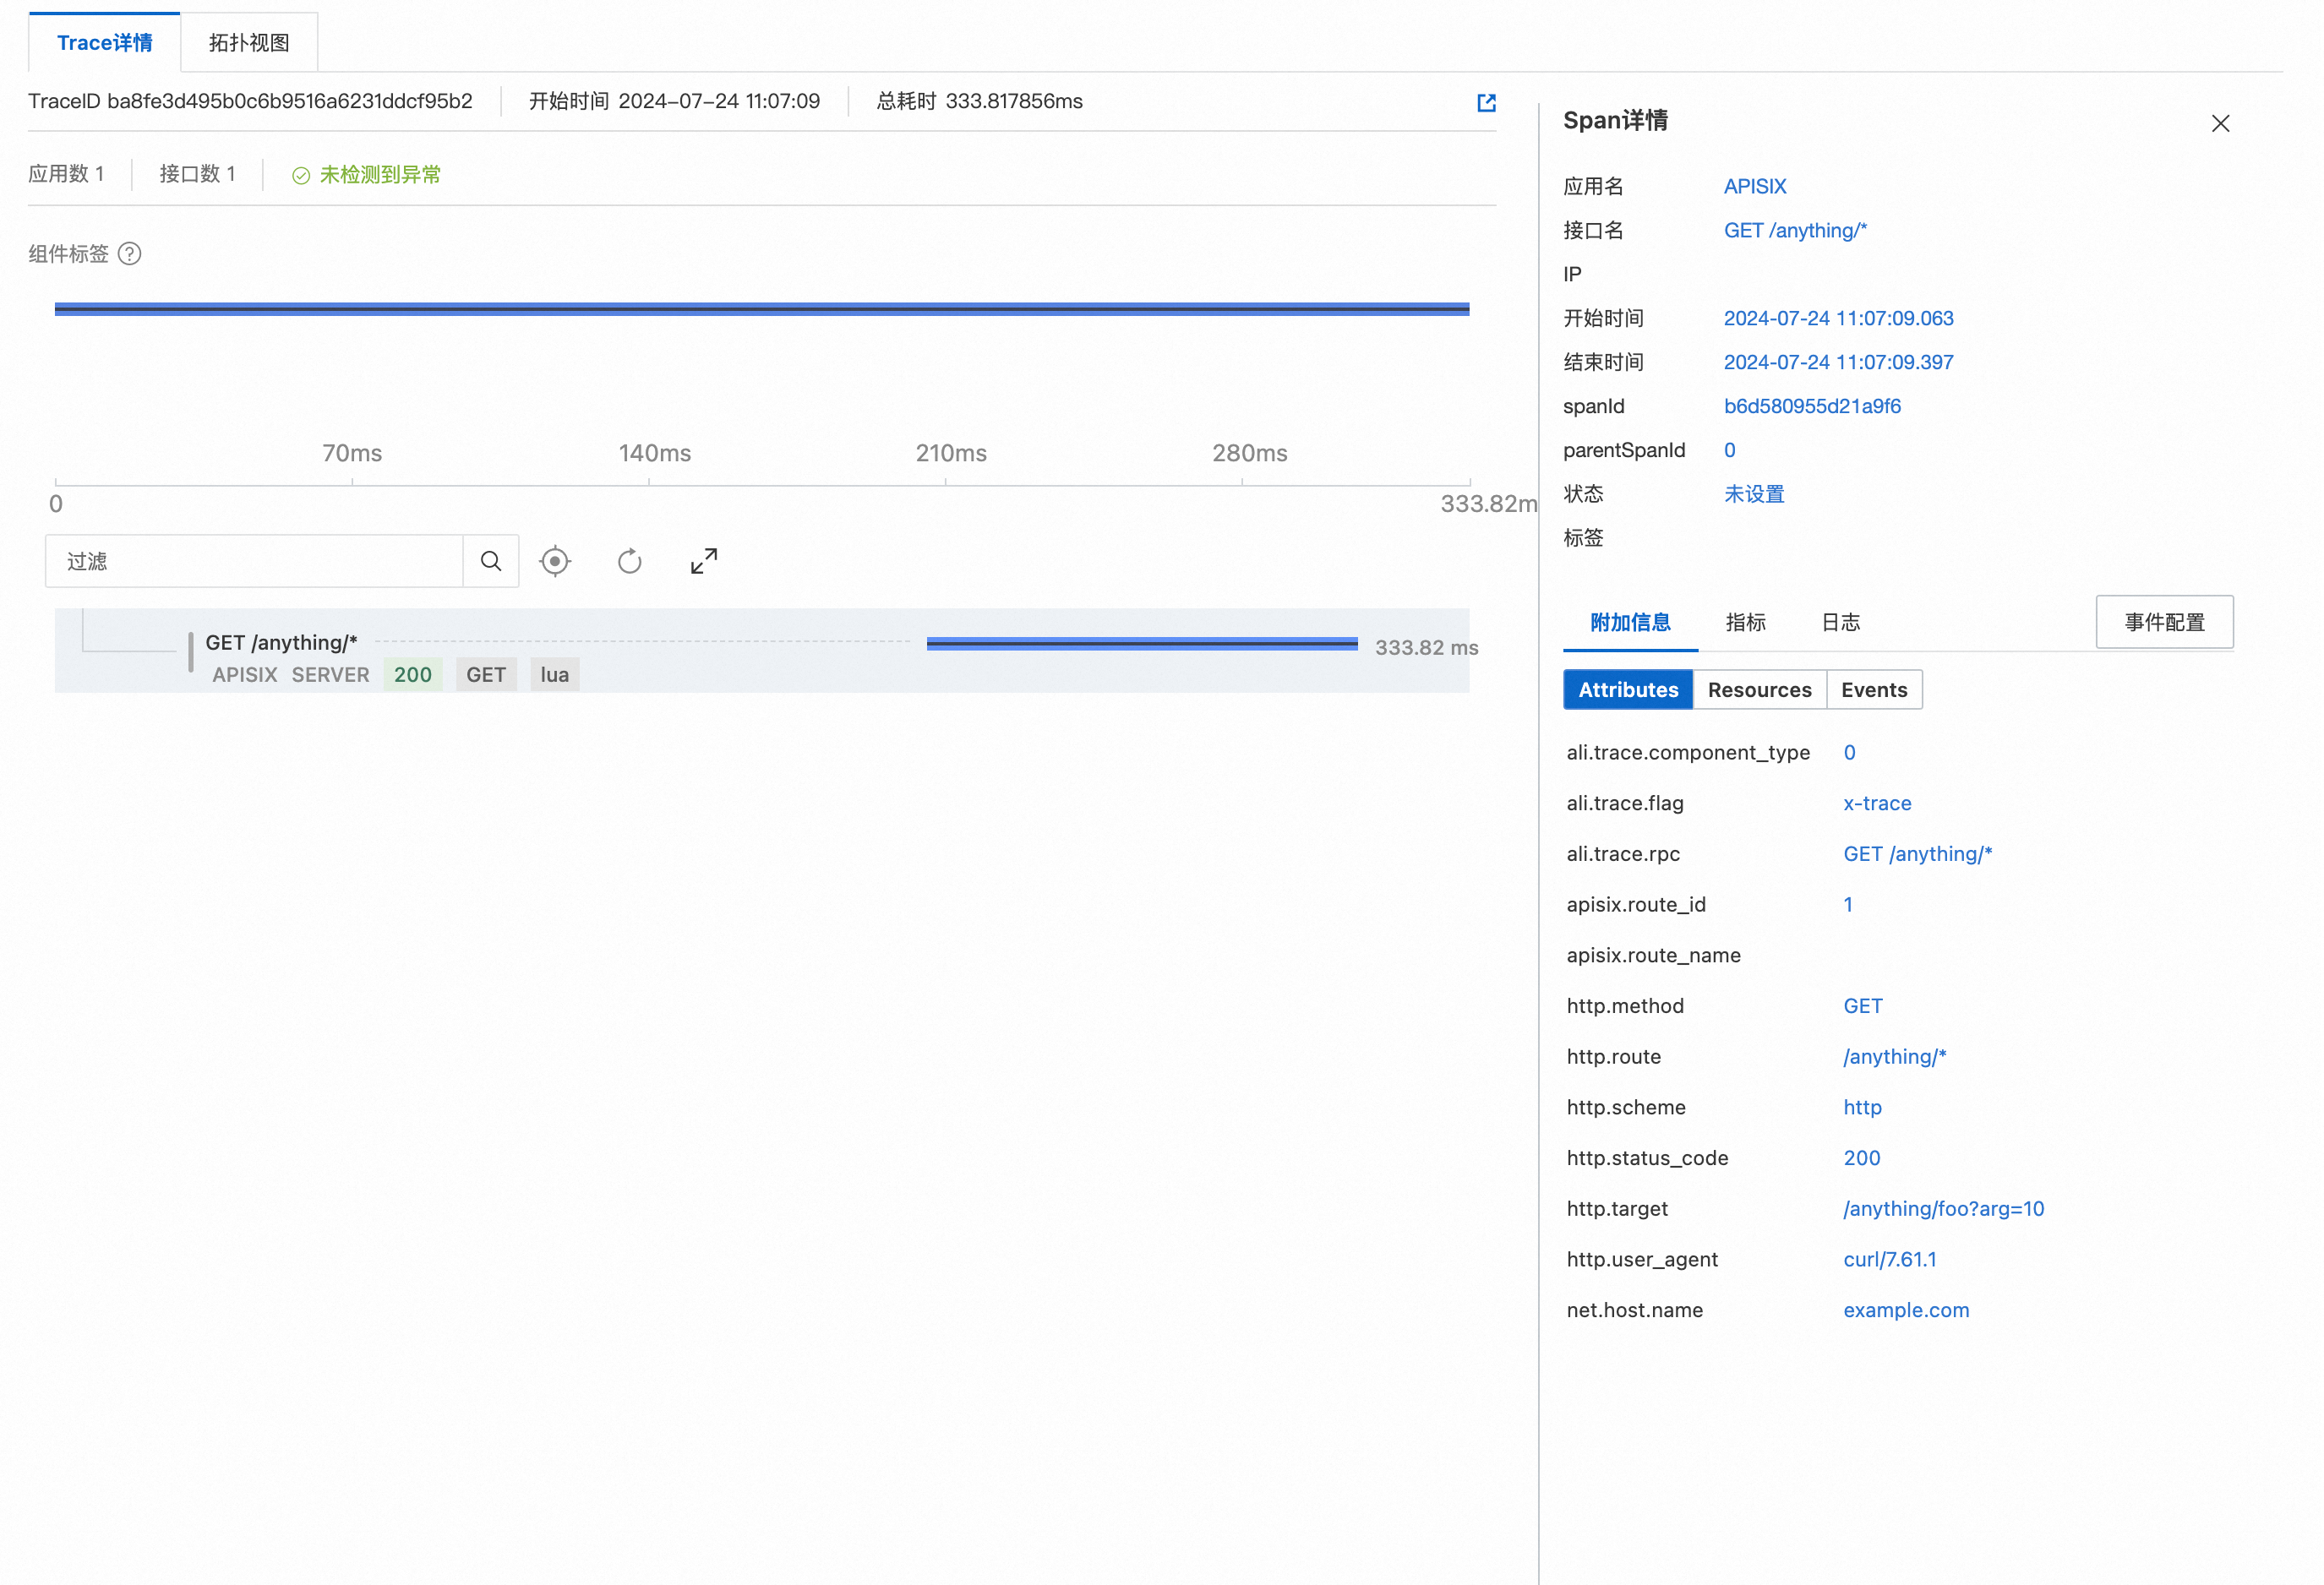
四. 查看APISIX調用鏈
完成以上配置後,您可通過APISIX建立路由並進行訪問。然後可以登入可觀測鏈路 OpenTelemetry 版控制台,查看由OpenTelemetry產生的APISIX調用鏈。
在應用列表頁查看APISIX應用。
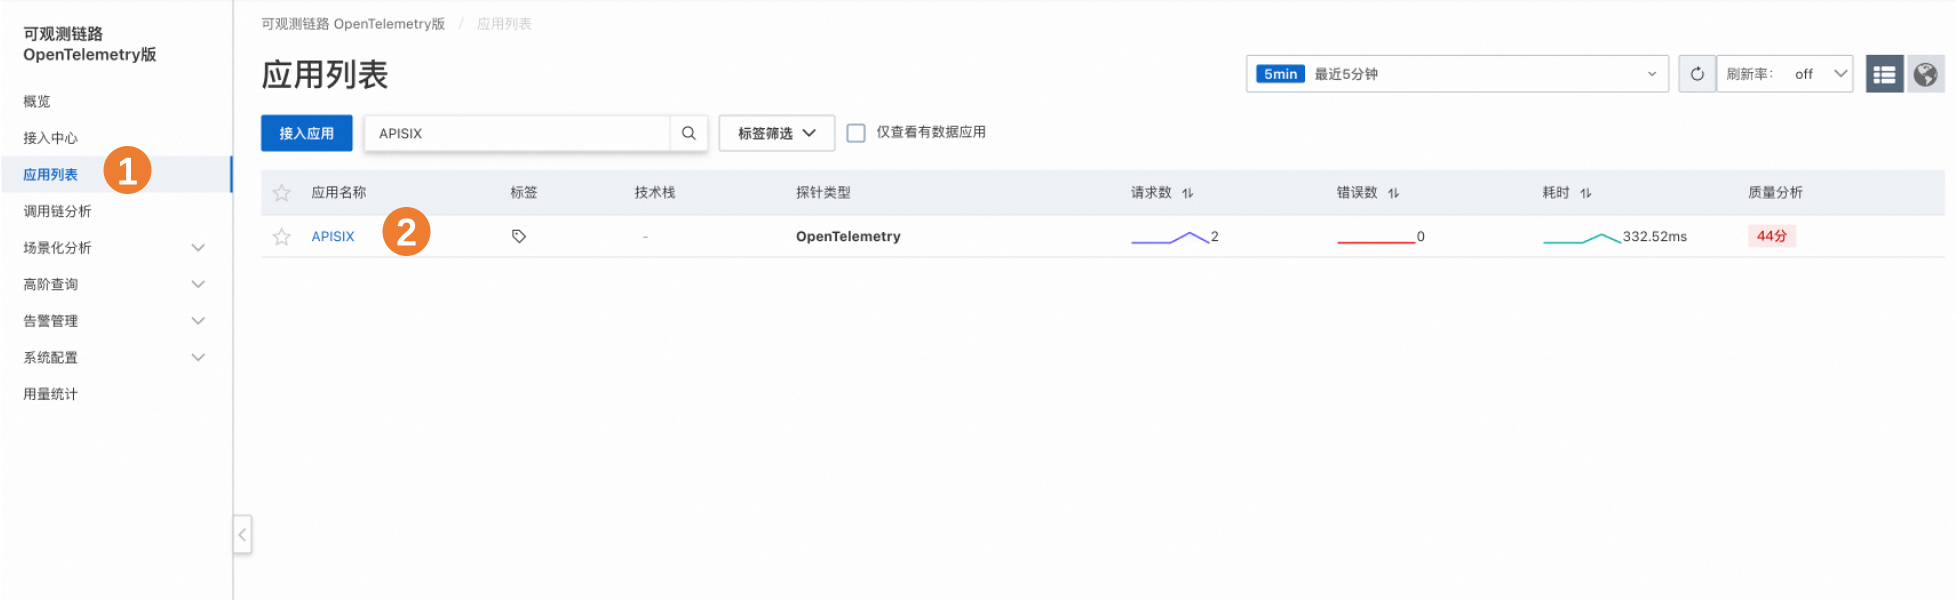
在調用鏈分析頁查看APISIX的調用鏈。
操作樣本
準備工作
確認已安裝Git、Docker和Docker Compose。
確認APISIX版本 ≥ v2.13.0。
操作步驟
下載APISIX官方Docker Compose Demo。
git clone https://github.com/apache/apisix-docker.git
cd apisix-docker/example
將OpenTelemetry Collector添加到APISIX Docker Compose Demo中。
在
apisix-docker/example檔案夾下建立ot_conf檔案夾,並建立config.yaml檔案。說明請將
${HTTP Endpoint}替換為前提條件中擷取的HTTP存取點,如:http://tracing-analysis-dc-hz.aliyuncs.com/adapt_xxxxx/api/otlp/traces。
receivers:
  otlp:
    protocols:
      grpc:
        endpoint: 0.0.0.0:4317
      http:
        cors:
          allowed_origins:
          - http://*
          - https://*
        endpoint: 0.0.0.0:4318
processors:
  batch:

exporters:
  otlphttp:
    traces_endpoint: '${HTTP Endpoint}'
    tls:
      insecure: true

service:
  pipelines:
    traces:
      receivers: [otlp]
      processors: [batch]
      exporters: [otlphttp]
修改
apisix-docker/example/docker-compose.yml檔案,添加OpenTelemetry Collector服務。修改後的完整
docker-compose.yml檔案:# # Licensed to the Apache Software Foundation (ASF) under one or more # contributor license agreements. See the NOTICE file distributed with # this work for additional information regarding copyright ownership. # The ASF licenses this file to You under the Apache License, Version 2.0 # (the "License"); you may not use this file except in compliance with # the License. You may obtain a copy of the License at # # http://www.apache.org/licenses/LICENSE-2.0 # # Unless required by applicable law or agreed to in writing, software # distributed under the License is distributed on an "AS IS" BASIS, # WITHOUT WARRANTIES OR CONDITIONS OF ANY KIND, either express or implied. # See the License for the specific language governing permissions and # limitations under the License. # version: "3" services: apisix: image: apache/apisix:${APISIX_IMAGE_TAG:-3.9.0-debian} restart: always volumes: - ./apisix_conf/config.yaml:/usr/local/apisix/conf/config.yaml:ro depends_on: - etcd ##network_mode: host ports: - "9180:9180/tcp" - "9080:9080/tcp" - "9091:9091/tcp" - "9443:9443/tcp" - "9092:9092/tcp" networks: apisix: etcd: image: bitnami/etcd:3.5.11 restart: always volumes: - etcd_data:/bitnami/etcd environment: ETCD_ENABLE_V2: "true" ALLOW_NONE_AUTHENTICATION: "yes" ETCD_ADVERTISE_CLIENT_URLS: "http://etcd:2379" ETCD_LISTEN_CLIENT_URLS: "http://0.0.0.0:2379" ports: - "2379:2379/tcp" networks: apisix: web1: image: nginx:1.19.0-alpine restart: always volumes: - ./upstream/web1.conf:/etc/nginx/nginx.conf ports: - "9081:80/tcp" environment: - NGINX_PORT=80 networks: apisix: web2: image: nginx:1.19.0-alpine restart: always volumes: - ./upstream/web2.conf:/etc/nginx/nginx.conf ports: - "9082:80/tcp" environment: - NGINX_PORT=80 networks: apisix: prometheus: image: prom/prometheus:v2.25.0 restart: always volumes: - ./prometheus_conf/prometheus.yml:/etc/prometheus/prometheus.yml ports: - "9090:9090" networks: apisix: grafana: image: grafana/grafana:7.3.7 restart: always ports: - "3000:3000" volumes: - "./grafana_conf/provisioning:/etc/grafana/provisioning" - "./grafana_conf/dashboards:/var/lib/grafana/dashboards" - "./grafana_conf/config/grafana.ini:/etc/grafana/grafana.ini" networks: apisix: otel-collector: image: otel/opentelemetry-collector-contrib:0.105.0 volumes: - ./ot_conf/config.yaml:/etc/otelcol-contrib/config.yaml # 掛載 OpenTelemetry Collector 設定檔 ports: - 4317:4317 # OTLP gRPC receiver - 4318:4318 # OTLP http receiver networks: apisix: networks: apisix: driver: bridge volumes: etcd_data: driver: local
在APISIX中啟用OpenTelemetry外掛程式。
修改APISIX設定檔
apisix-docker/example/apisix_conf/config.yaml,在檔案末尾追加以下內容。plugins: - opentelemetry plugin_attr: prometheus: export_addr: ip: "0.0.0.0" port: 9091 opentelemetry: resource: service.name: APISIX host.ip: 127.0.0.1 collector: address: docker-apisix-otel-collector-1:4318 # OTLP HTTP Receiver address request_timeout: 3 batch_span_processor: drop_on_queue_full: false max_queue_size: 6 batch_timeout: 2 inactive_timeout: 1 max_export_batch_size: 2啟動APISIX Docker Compose Demo。
請在
apisix-docker/example目錄下執行。docker compose -p docker-apisix up -d全域啟用OpenTelemetry外掛程式。
通過APISIX Admin API設定OpenTelemetry外掛程式在全域生效。
curl 'http://127.0.0.1:9180/apisix/admin/global_rules/1' \
-H 'X-API-KEY: edd1c9f034335f136f87ad84b625c8f1' \
-X PUT -d '{
    "plugins": {
        "opentelemetry": {
            "sampler": {
                "name": "always_on"
            }
        }
    }
}'
建立APISIX路由並測試調用鏈上報。
使用APISIX Admin API建立路由。
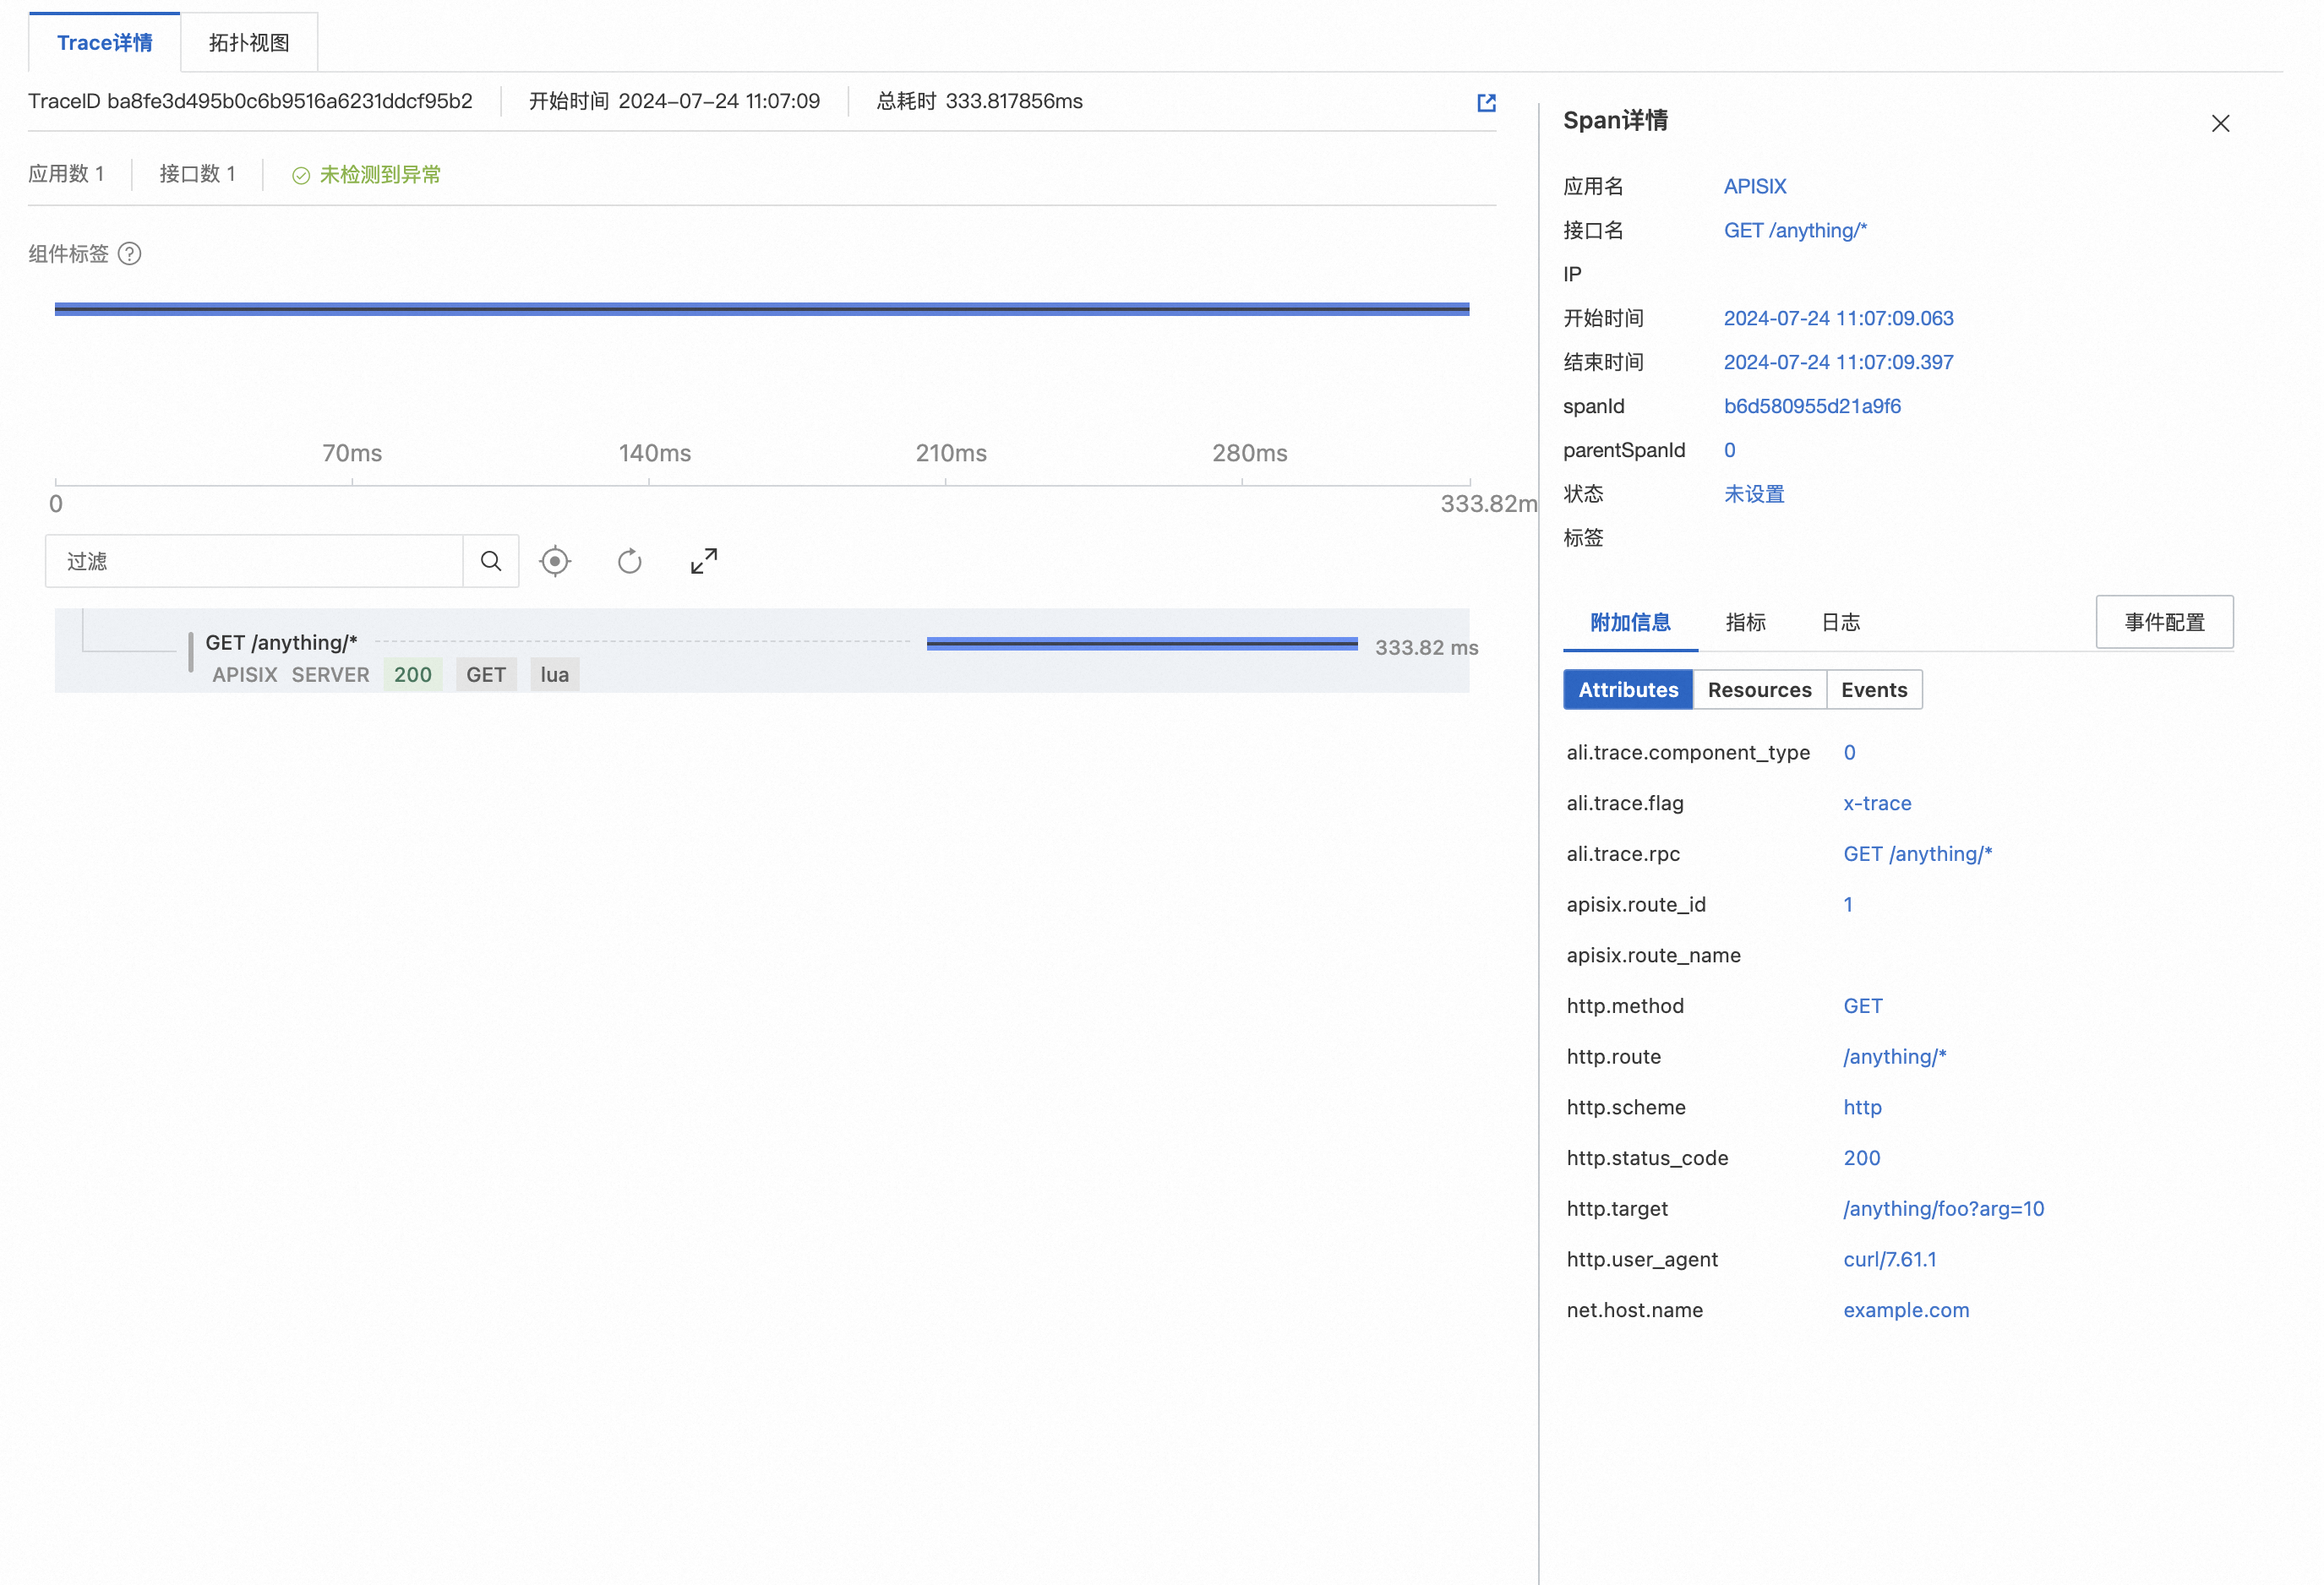
curl "http://127.0.0.1:9180/apisix/admin/routes/1" -H "X-API-KEY: edd1c9f034335f136f87ad84b625c8f1" -X PUT -d '
{
  "methods": ["GET"],
  "host": "example.com",
  "uri": "/anything/*",
  "upstream": {
    "type": "roundrobin",
    "nodes": {
      "httpbin.org:80": 1
    }
  }
}'
訪問以下地址,APISIX OpenTelemetry外掛程式會為本次請求產生調用鏈並上報至可觀測鏈路 OpenTelemetry 版。
curl -i -X GET "http://127.0.0.1:9080/anything/foo?arg=10" -H "Host: example.com"預期輸出:
# curl -i -X GET "http://127.0.0.1:9080/anything/foo?arg=10" -H "Host: example.com"
HTTP/1.1 200 OK
Content-Type: application/json
Content-Length: 501
Connection: keep-alive
Date: Wed, 24 Jul 2024 03:26:11 GMT
Access-Control-Allow-Origin: *
Access-Control-Allow-Credentials: true
Server: APISIX/3.9.0

{
  "args": {
    "arg": "10"
  },
  "data": "",
  "files": {},
  "form": {},
  "headers": {
    "Accept": "*/*",
    "Host": "example.com",
    "Traceparent": "00-xxxxxx-xxxx-01",
    "User-Agent": "curl/7.61.1",
    "X-Amzn-Trace-Id": "Root=1-xxx-xxxx",
    "X-Forwarded-Host": "example.com"
  },
  "json": null,
  "method": "GET",
  "origin": "x.x.x.x, x.x.x.x",
  "url": "http://example.com/anything/foo?arg=10"
}
登入可觀測鏈路 OpenTelemetry 版控制台,查看由OpenTelemetry產生的APISIX調用鏈。
在應用列表頁查看APISIX應用。
在調用鏈分析頁查看APISIX的調用鏈。
相關資訊
APISIX是一款雲原生API Gateway,由Apache APISIX社區維護。它具有動態、即時、高效能等特點,提供了負載平衡、灰階發布(金絲雀發布)等豐富的流量管理功能。更多資訊,請參見Apache APISIX。