本文檔介紹在DataV中添加CSV檔案的方法。
前提條件
已準備好待添加的CSV檔案資料來源。
操作步驟
登入DataV控制台。
在工作台頁面,單擊左側導覽列中的,進入資料來源頁面,單擊建立資料來源。
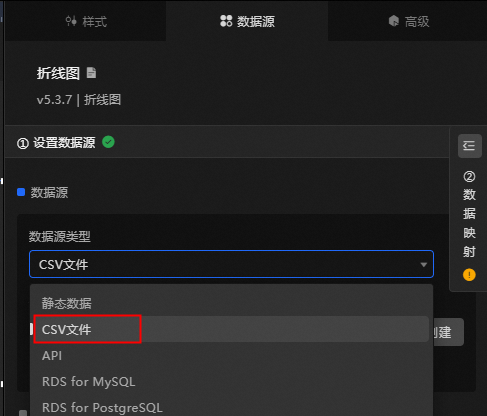
從類型列表中,選擇CSV檔案。
上傳CSV檔案。
說明CSV檔案大小不能超過512KB,暫不支援上傳超出512KB的CSV檔案。
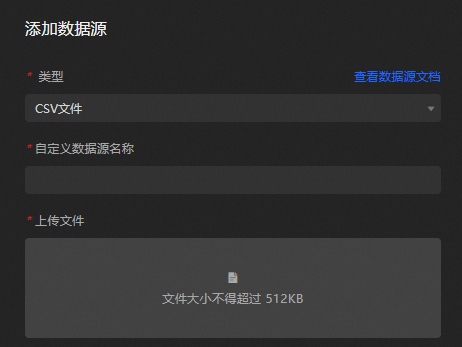
單擊確定,完成資料來源添加。
常見問題
CSV檔案格式問題
需要將原始Excel檔案或其他資料格式的檔案另存新檔CSV檔案,不能通過直接修改尾碼改變CSV檔案格式,會出現錯誤。
DataV控制台相容問題
由於Google瀏覽器對HTTP協議限制,需要使用HTTPS網址開啟DataV控制台,再添加CSV檔案資料來源。
待用資料樣本
[
  {
    "x": "1月",
    "y": 2,
    "s": "降水量"
  },
  {
    "x": "1月",
    "y": 2.6,
    "s": "蒸發量"
  },
  {
    "x": "2月",
    "y": 4.9,
    "s": "降水量"
  },
  {
    "x": "2月",
    "y": 5.9,
    "s": "蒸發量"
  },
  {
    "x": "3月",
    "y": 7,
    "s": "降水量"
  },
  {
    "x": "3月",
    "y": 9,
    "s": "蒸發量"
  },
  {
    "x": "4月",
    "y": 23.2,
    "s": "降水量"
  },
  {
    "x": "4月",
    "y": 26.4,
    "s": "蒸發量"
  },
  {
    "x": "5月",
    "y": 25.6,
    "s": "降水量"
  },
  {
    "x": "5月",
    "y": 28.7,
    "s": "蒸發量"
  },
  {
    "x": "6月",
    "y": 76.7,
    "s": "降水量"
  },
  {
    "x": "6月",
    "y": 70.7,
    "s": "蒸發量"
  },
  {
    "x": "7月",
    "y": 135.6,
    "s": "降水量"
  },
  {
    "x": "7月",
    "y": 175.6,
    "s": "蒸發量"
  }
]
資料格式樣本
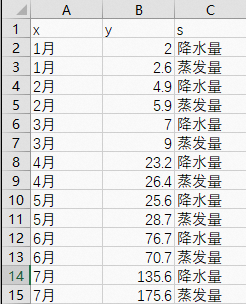
CSV檔案中的第一行x,y,s,表示欄位名,第二行開始表示欄位值。以上文中的待用資料為例,對應到 CSV的檔案內容如下。
案例示範
以折線圖為例,我現在有一份1月到7月的每月降水量和蒸發量的CSV資料,請參見如下步驟匯入DataV。
登入DataV控制台。
在工作台頁面,選擇任一資料看板,單擊編輯。
在畫布編輯器頁面,添加折線圖組件。
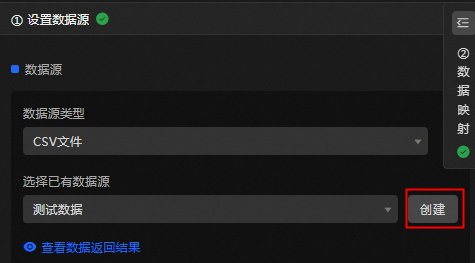
選擇資料來源面板,設定資料來源類型為CSV檔案。
在選擇已有資料來源單擊建立,添加CSV資料來源。
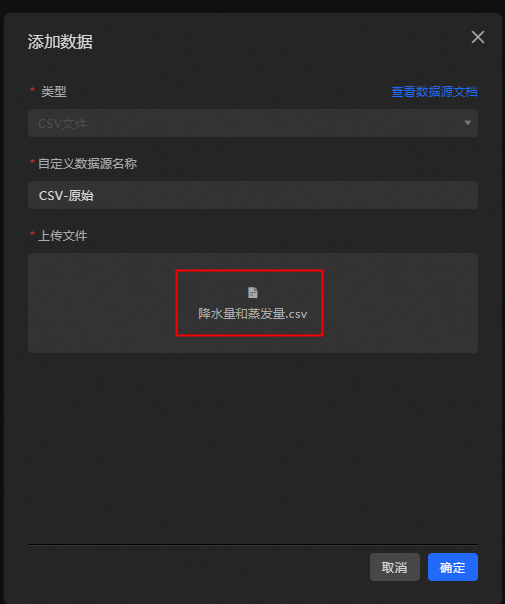
將本地的降水量和蒸發量.csv檔案匯入系統中,單擊確定。
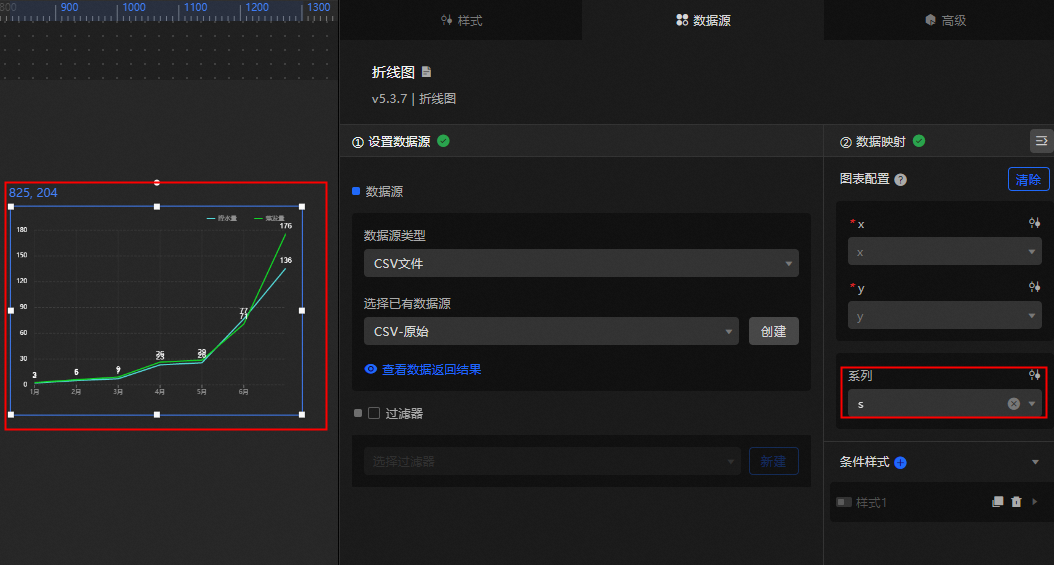
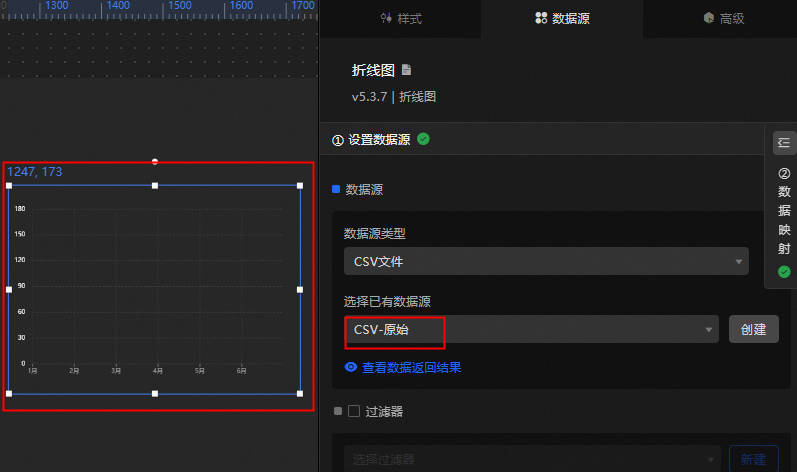
在選擇已有資料來源中選擇已匯入的CSV檔案的資料來源,此時發現圖表無內容顯示。
單擊資料對應,選擇系列映射為欄位
s。如圖所示,圖表正常顯示。