ClickHouse遷移上雲後,可能會面臨相容性及效能方面的問題。為了確保遷移過程順利,並避免對生產環境造成不必要的影響,在您正式開始遷移資料前,強烈建議在測試環境進行資料移轉,然後進行上雲後的相容性和效能瓶頸分析,並解決相關問題。
背景知識
使用者在業務啟動並執行早期階段自建了ClickHouse,後期考慮到穩定性、營運成本和容災能力等因素,希望將ClickHouse隨即轉移至雲端。遷移至雲端後,可能面臨以下問題:
版本相容性問題。
MaterializedMySQL引擎相容性問題。
SQL相容性問題。
業務整體切換至雲資料庫ClickHouse後,出現CPU資源耗盡、記憶體不足等問題。
針對上述問題,自建上雲過程中需重點關注相容性與效能問題的解決。
相容性分析與解決
參數相容性
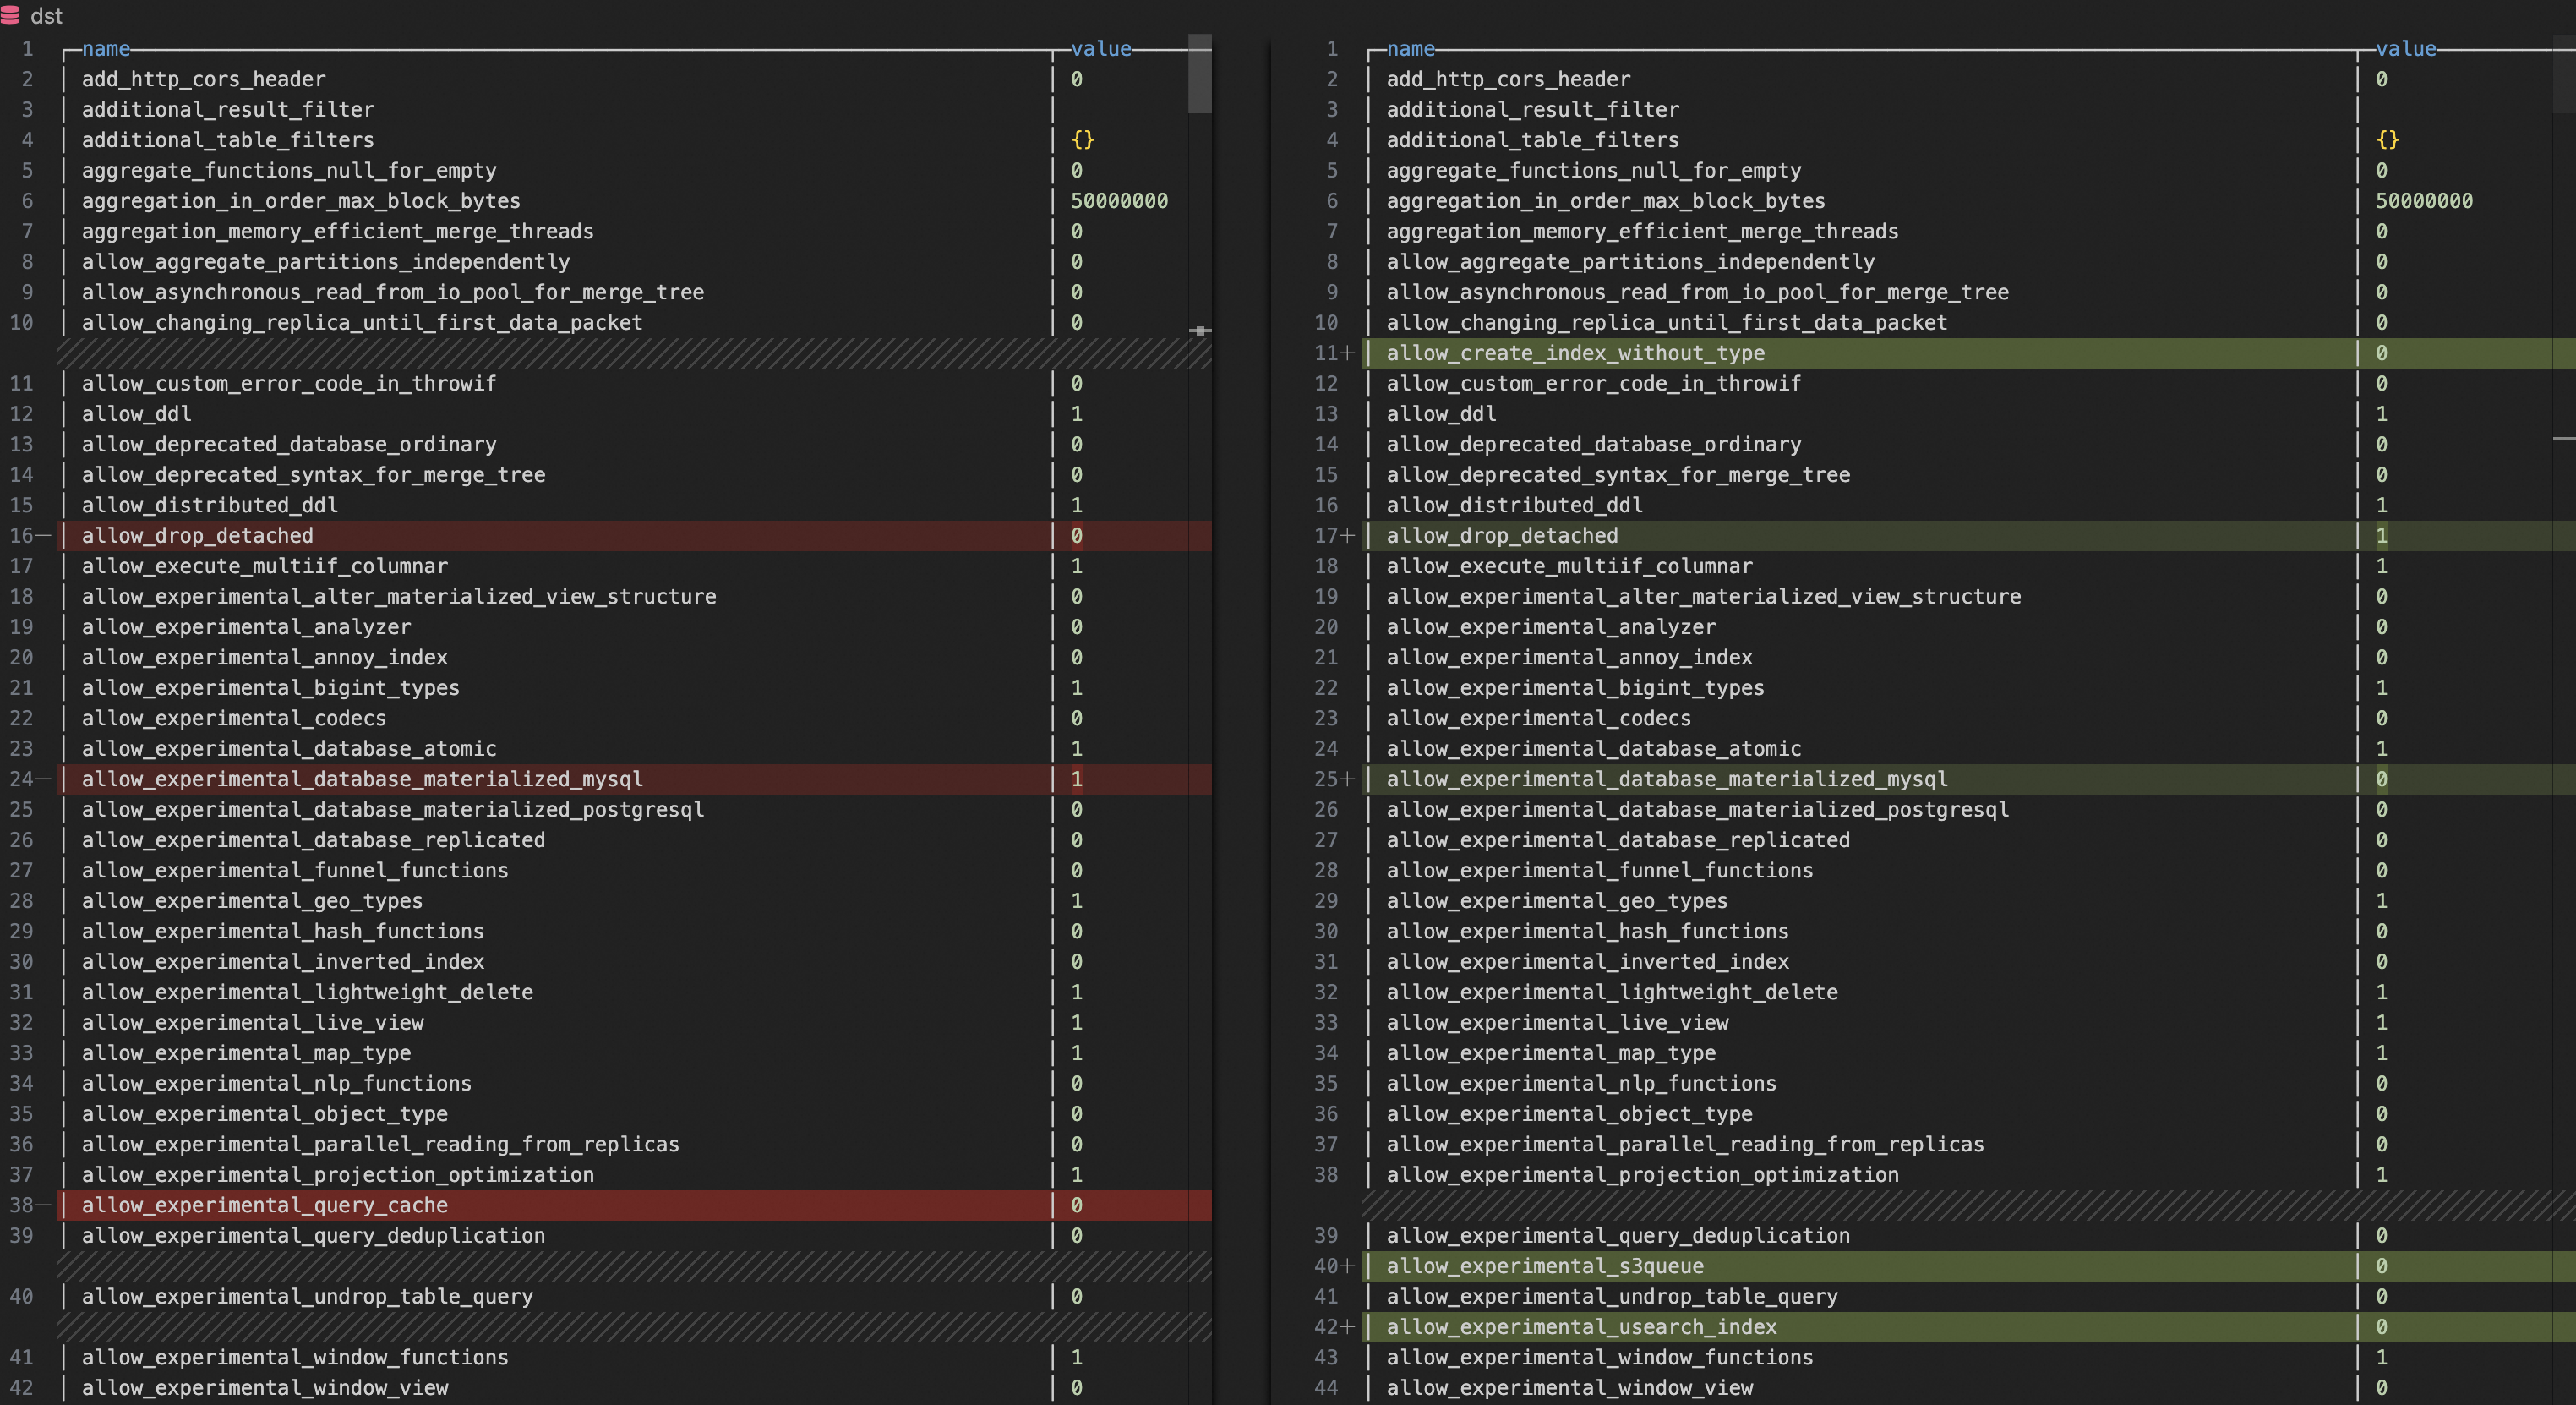
拉取自建ClickHouse和雲資料庫ClickHouse的配置參數。
SELECT name, groupArrayDistinct(value) AS value FROM clusterAllReplicas(`default`, system.settings) GROUP BY name ORDER BY name ASC利用文本對比工具(例如VSCode)對比二者的參數,發現配置不一致的參數後,將雲資料庫ClickHouse的參數配置與自建ClickHouse參數一致。
影響相容性的常見參數:compatibility、prefer_global_in_and_join、distributed_product_mode等。
影響效能的常見參數:max_threads、max_bytes_to_merge_at_max_space_in_pool、prefer_global_in_and_join等。
MaterializedMySQL相容性
如果您的自建ClickHouse同步的是MySQL的資料,自建上雲後,雲資料庫ClickHouse仍需持續同步MySQL的資料,您需注意MaterializedMySQL引擎的相容性。
MaterializedMySQL引擎在每個節點建立ReplacingMergeTree表TABLE1,每個節點保留一樣的資料。但社區版已經不再維護MaterializedMySQL引擎。由於MySQL資料同步至雲資料庫ClickHouse的主要方案是通過DTS同步,針對MaterializedMySQL引擎社區版不再維護問題,DTS將MySQL資料同步至雲資料庫ClickHouse時,其使用ReplacingMergeTree表代替MaterializedMySQL表,具體實現是為雲資料庫ClickHouse的每個節點建立分布式表TABLE1和ReplacingMergeTree表TABLE2,然後雲資料庫ClickHouse通過分布式表將資料分發到各自節點。此實現引發了一系列自建ClickHouse遷移至雲資料庫ClickHouse的相容問題,可能對您的業務造成影響。常見問題如下:
問題一:上雲之前,在自建的ClickHouse中,MaterializedMySQL會為每個分區同步資料;而通過DTS上雲後,使用ReplacingMergeTree表代替MaterializedMySQL表,資料會通過分布式表分發到各自節點,這對業務中使用IN和JOIN關聯查詢分布式表產生了影響。更多詳情,請參見分布式表使用子查詢報錯後,怎麼辦?。
問題二:上雲後,使用ReplacingMergeTree表替代MaterializedMySQL後,由於ReplacingMergeTree資料合併速度不夠快,導致查詢結果比自建查詢結果出現更多的重複資料。可通過以下方案解決:
方案一:在雲資料庫ClickHouse執行
set global final=1,設定在查詢時合并資料。此參數能保證查詢資料不重複,但其會佔用更多CPU和記憶體。方案二:在雲資料庫ClickHouse,修改目標ReplacingMergeTree表的min_age_to_force_merge_seconds與min_age_to_force_merge_on_partition_only參數,讓目標表merge更頻繁,防止產生太多重複資料。樣本如下:
ALTER TABLE <AIM_TABLE>
    MODIFY SETTING
        min_age_to_force_merge_on_partition_only = 1,
        min_age_to_force_merge_seconds = 60;
min_age_to_force_merge_on_partition_only
含義:用於控制MergeTree表引擎的合并策略。當設定為1時,開啟分區強制合并資料。
預設值:0(表示關閉)
min_age_to_force_merge_seconds
含義:強制合并part的時間間隔。
預設值:3600
單位:秒
SQL相容性驗證
安裝Python環境。
此驗證需基本Python3環境。建議您用阿里雲ECS的Linux進行驗證,因為其已具有Python3環境。如何購買ECS,請參見快速購買執行個體。
如果非阿里雲ECS環境,您需自行安裝Python環境,如何安裝Python環境,請參見Python官網。
安裝與ClickHouse進行互動的Python用戶端庫。
在終端或命令提示字元中,執行以下命令。
pip3 install clickhouse_driver確保用於驗證的伺服器與雲資料庫ClickHouse和自建ClickHouse網路互連。
如何解決用於驗證的伺服器與雲資料庫ClickHouse網路互連,請參見如何解決目的地組群與資料來源網路互連問題?
執行Python指令碼,提取自建ClickHouse的SELECT請求在雲資料庫ClickHouse運行,驗證自建ClickHouse的SQL在雲資料庫ClickHouse的相容性。指令碼如下:
from clickhouse_driver import connect
import datetime
import logging
# 需要 pip3 install clickhouse_driver

# 自建執行個體VPC地址
host_old='HOST_OLD'
# 自建執行個體TCP連接埠
port_old=TCP_PORT_OLD
# 自建執行個體使用者名稱
user_old='USER_OLD'
# 自建執行個體使用者密碼
password_old='PASSWORD_OLD'

# 雲ClickHouse VPC地址
host_new='HOST_NEW'
# 雲ClickHouse TCP連接埠
port_new=TCP_PORT_NEW
# 雲ClickHouse使用者名稱
user_new='USER_NEW'
# 雲ClickHouse使用者密碼
password_new='PASSWORD_NEW'

# 配置日誌
logging.basicConfig(level=logging.INFO, format='%(asctime)s - %(levelname)s - %(message)s')

def create_connection(host, port, user, password):
    """建立 ClickHouse 串連"""
    return connect(host=host, port=port, user=user, password=password)

def get_query_hashes(cursor):
    """擷取最近2天的 query_hash 列表"""
    get_queryhash_sql = '''
    select distinct normalized_query_hash from system.query_log
    where type='QueryFinish'
      and `is_initial_query`=1
      and `user` not in ('default', 'aurora')
      and lower(`query`) not like 'select 1%'
      and lower(`query`) not like 'select timezone()%'
      and lower(`query`) not like '%dms-websql%'
      and lower(`query`) like 'select%'
      and `event_time` > now() - INTERVAL 2 DAY;
    '''
    cursor.execute(get_queryhash_sql)
    return cursor.fetchall()

def get_sql_info(cursor, queryhash):
    """擷取最近2天(搜尋範圍3天)指定 query_hash 的 SQL 資訊"""
    get_sqlinfo_sql = f'''
    select `event_time`, `query_duration_ms`, `read_rows`, `read_bytes`, `memory_usage`, `databases`, `tables`, `current_database`, `query`
    from system.query_log
    where `event_time` > now() - INTERVAL 3 DAY and `type`='QueryFinish' and `normalized_query_hash`='{queryhash}' limit 1
    '''
    cursor.execute(get_sqlinfo_sql)
    sql_info = cursor.fetchone()
    if sql_info:
        return [info.strftime('%Y-%m-%d %H:%M:%S') if isinstance(info, datetime.datetime) else info for info in sql_info[:-1]],sql_info[-1]
    return None

def execute_sql_on_new_db(cursor, current_database, query_sql, execute_failed_sql):
    """在新節點上執行 SQL 並記錄失敗的 SQL"""
    try:
        cursor.execute(f"USE {current_database};")
        cursor.execute(query_sql)
    except Exception as error:
        logging.error(f'query_sql execute in new db failed: {query_sql}')
        execute_failed_sql[query_sql] = error

def main():
    # 建立串連
    conn_old = create_connection(
        host=host_old,
        port=port_old,
        user=user_old,
        password=password_old
    )
    conn_new = create_connection(
        host=host_new,
        port=port_new,
        user=user_new,
        password=password_new
    )

    # 建立遊標
    cursor_old = conn_old.cursor()
    cursor_new = conn_new.cursor()

    # 擷取老節點的 query_hash 列表
    old_query_hashes = get_query_hashes(cursor_old)
    #老節點擷取 SQL 執行資訊
    old_db_execute_dir = {}
    for queryhash in old_query_hashes:
        sql_info,query = get_sql_info(cursor_old, queryhash[0])
        if sql_info:
            old_db_execute_dir[query] = sql_info

    # 關閉老節點的遊標和串連
    cursor_old.close()
    conn_old.close()

    # 在新節點上執行 SQL,最重要的驗證步驟
    execute_failed_sql = {}
    keys_list = list(old_db_execute_dir.keys())
    for query_sql in old_db_execute_dir:
        position = keys_list.index(query_sql)
        current_database = old_db_execute_dir[query_sql][-1]
        logging.info(f"new db test the {position + 1}th/{len(old_db_execute_dir)}, running sql: {query_sql}\n")
        execute_sql_on_new_db(cursor_new, current_database, query_sql, execute_failed_sql)

    # 擷取新節點的 query_hash 列表
    new_query_hashes = get_query_hashes(cursor_new)
    new_db_execute_dir = {}
    for queryhash in new_query_hashes:
        sql_info,query = get_sql_info(cursor_new, queryhash[0])
        if sql_info:
            new_db_execute_dir[query] = sql_info

    # 關閉新節點的遊標和串連
    cursor_new.close()
    conn_new.close()

    # 列印新老版本節點 SQL 執行資訊
    for query_sql in new_db_execute_dir:
        if query_sql in old_db_execute_dir:
            logging.info(f'succeed sql: {query_sql}')
            logging.info(f'old sql info: {old_db_execute_dir[query_sql]}')
            logging.info(f'new sql info: {new_db_execute_dir[query_sql]}\n')


    # 列印執行報錯的 SQL
    for query_sql in execute_failed_sql:
        logging.error('\033[31m{}\033[0m'.format(f'failed sql: {query_sql}'))
        logging.error('\033[31m{}\033[0m'.format(f'failed error: {execute_failed_sql[query_sql]}\n'))

if __name__ == "__main__":
    main()
驗證結果與解決。
驗證的SQL相容性情況較為複雜,如遇到錯誤,您需根據錯誤資訊自行進行排查與解決。
效能分析和最佳化
由於自建上雲背景是已經有業務在運行,較難實現逐步上雲測試和效能最佳化。業務整體切換到雲ClickHouse後,執行個體可能出現CPU打滿,記憶體不足等問題。在出現切換到雲資料庫ClickHouse後,雲資料庫ClickHouse效能劣化時,通過以下措施快速定位到表或請求,進而確認效能瓶頸問題。當然,如果已經知道某個表或查詢導致目標執行個體效能較差,可以直接進入步驟三:SQL效能分析。
步驟一:定位整體效能瓶頸的關鍵表
火焰圖與query_log分析是定位導致效能問題關鍵表的兩種手段。火焰圖製作比較繁瑣,但資訊更直觀;query_log表分析操作簡單,無需藉助工具,但資訊需自己分析。二者可結合使用。
製作火焰圖
匯出trace_log。
使用clickhouse-client,登入雲資料庫ClickHouse執行個體。如何登入,請參見通過命令列工具串連ClickHouse。
執行以下命令,匯出trace_log,產生
cpu_trace_log.txt。-- trace_type = 'CPU'表示跟蹤CPU -- trace_type = 'Real'表示跟蹤實際耗時 /clickhouse/bin/clickhouse-client -h <IP> --port <port> -q "SELECT arrayStringConcat(arrayReverse(arrayMap(x -> concat( addressToLine(x), '#', demangle(addressToSymbol(x)) ), trace)), ';') AS stack, count() AS samples FROM system.trace_log WHERE trace_type = 'CPU' and event_time >= '2025-01-08 19:31:00' and event_time < '2025-01-08 19:33:00' group by trace order by samples desc FORMAT TabSeparated settings allow_introspection_functions=1" > cpu_trace_log.txt參數說明如下。
參數
描述
IP
雲資料庫ClickHouse的VPC地址。
port
雲資料庫ClickHouse的TCP連接埠。
除了配置上述參數外,您還需配置event_time,擷取目標時間段的trace日誌。
使用clickhouse-flamegraph製作火焰圖。
安裝clickhouse-flamegraph。下載與安裝,請參見clickhouse-flamegraph。
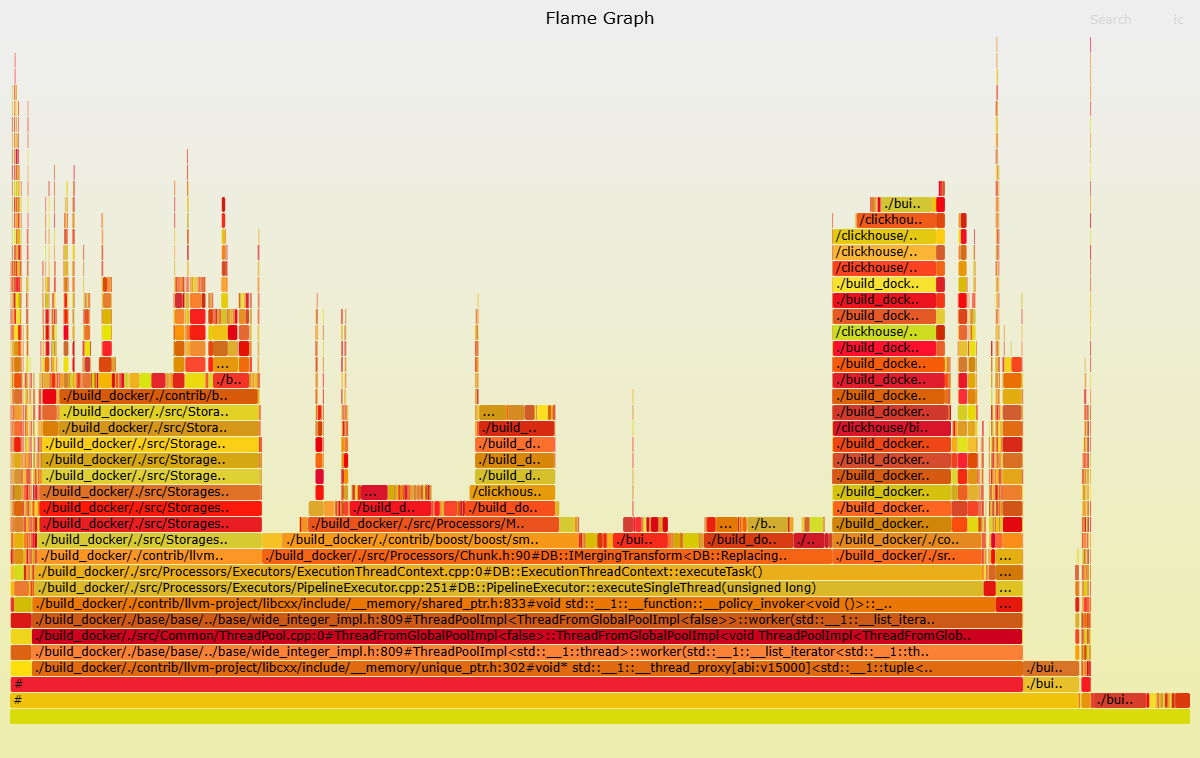
執行以下命令,產生火焰圖後,分析火焰圖。
cat cpu_trace_log.txt | flamegraph.pl > cpu_trace_log.svg以下火焰圖中,可以觀察到目標執行個體CPU消耗較大的函數,例如ReplacingSortedMerg函數。因此,您可以重點關注ReplacingMergeTree表中的查詢SQL。
分析query_log
SELECT請求佔用CPU和記憶體多的表,並不能直接說明整體效能較差,這僅僅表明其導致CPU和記憶體佔用較多的機率更高。因此,有必要在自建的ClickHouse與雲資料庫ClickHouse中同時執行相關命令以進行TOP對比。在確定了差異較大的表之後,需進行相關表中SELECT語句的定位。定位CPU或記憶體問題表的樣本如下。
定位CPU問題的表
SELECT
    tables,
    first_value(query),
    count() AS cnt,
    groupArrayDistinct(normalizedQueryHash(query)) AS normalized_query_hash,
    sum(ProfileEvents.Values[indexOf(ProfileEvents.Names, 'UserTimeMicroseconds')]) AS sum_user_cpu,
    sum(ProfileEvents.Values[indexOf(ProfileEvents.Names, 'SystemTimeMicroseconds')]) AS sum_system_cpu,
    avg(ProfileEvents.Values[indexOf(ProfileEvents.Names, 'UserTimeMicroseconds')]) AS avg_user_cpu,
    avg(ProfileEvents.Values[indexOf(ProfileEvents.Names, 'SystemTimeMicroseconds')]) AS avg_system_cpu,
    sum(memory_usage) as sum_memory_usage,
    avg(memory_usage) as avg_memory_usage
FROM clusterAllReplicas(default, system.query_log)
WHERE (event_time > '2025-01-08 19:30:00') AND (event_time < '2025-01-08 20:30:00') AND (query_kind = 'Select')
GROUP BY tables
ORDER BY sum_user_cpu DESC
LIMIT 5
定位記憶體問題表
SELECT
    tables,
    first_value(query),
    count() AS cnt,
    groupArrayDistinct(normalizedQueryHash(query)) AS normalized_query_hash,
    sum(ProfileEvents.Values[indexOf(ProfileEvents.Names, 'UserTimeMicroseconds')]) AS sum_user_cpu,
    sum(ProfileEvents.Values[indexOf(ProfileEvents.Names, 'SystemTimeMicroseconds')]) AS sum_system_cpu,
    avg(ProfileEvents.Values[indexOf(ProfileEvents.Names, 'UserTimeMicroseconds')]) AS avg_user_cpu,
    avg(ProfileEvents.Values[indexOf(ProfileEvents.Names, 'SystemTimeMicroseconds')]) AS avg_system_cpu,
    sum(memory_usage) as sum_memory_usage,
    avg(memory_usage) as avg_memory_usage
FROM clusterAllReplicas(default, system.query_log)
WHERE (event_time > '2025-01-08 19:30:00') AND (event_time < '2025-01-08 20:30:00') AND (query_kind = 'Select')
GROUP BY tables
ORDER BY sum_memory_usage
LIMIT 5
步驟二:定位效能瓶頸關鍵SQL
根據上個步驟確定導致效能瓶頸的表後,進一步定位導致效能瓶頸的某類SQL。樣本如下所示。
定位導致CPU問題的SQL
SELECT
    tables,
    first_value(query),
    count() AS cnt,
    normalizedQueryHash(query) AS normalized_query_hash,
    sum(ProfileEvents.Values[indexOf(ProfileEvents.Names, 'UserTimeMicroseconds')]) AS sum_user_cpu,
    sum(ProfileEvents.Values[indexOf(ProfileEvents.Names, 'SystemTimeMicroseconds')]) AS sum_system_cpu,
    avg(ProfileEvents.Values[indexOf(ProfileEvents.Names, 'UserTimeMicroseconds')]) AS avg_user_cpu,
    avg(ProfileEvents.Values[indexOf(ProfileEvents.Names, 'SystemTimeMicroseconds')]) AS avg_system_cpu,
    sum(memory_usage) as sum_memory_usage,
    avg(memory_usage) as avg_memory_usage
FROM clusterAllReplicas(default, system.query_log)
WHERE (event_time > '2025-01-08 19:30:00') AND (event_time < '2025-01-08 20:30:00') AND (query_kind = 'Select') AND has(tables, '<AIM_TABLE>')
GROUP BY
    tables,
    normalized_query_hash
ORDER BY sum_user_cpu DESC
LIMIT 5
定位導致記憶體問題的SQL
SELECT
    tables,
    first_value(query),
    count() AS cnt,
    normalizedQueryHash(query) AS normalized_query_hash,
    sum(ProfileEvents.Values[indexOf(ProfileEvents.Names, 'UserTimeMicroseconds')]) AS sum_user_cpu,
    sum(ProfileEvents.Values[indexOf(ProfileEvents.Names, 'SystemTimeMicroseconds')]) AS sum_system_cpu,
    avg(ProfileEvents.Values[indexOf(ProfileEvents.Names, 'UserTimeMicroseconds')]) AS avg_user_cpu,
    avg(ProfileEvents.Values[indexOf(ProfileEvents.Names, 'SystemTimeMicroseconds')]) AS avg_system_cpu,
    sum(memory_usage) as sum_memory_usage,
    avg(memory_usage) as avg_memory_usage
FROM clusterAllReplicas(default, system.query_log)
WHERE (event_time > '2025-01-08 19:30:00') AND (event_time < '2025-01-08 20:30:00') AND (query_kind = 'Select') AND has(tables, 'AIM_TABLE')
GROUP BY
    tables,
    normalized_query_hash
ORDER BY sum_memory_usage
LIMIT 5
參數說明如下:
AIM_TABLE:需要定位效能問題的表。
除了配置上述參數外,您還需配置event_time,擷取目標時間段的資料。
步驟三:SQL效能分析
您可以使用EXPLAIN和system.query_log表進行分析目標語句。
利用EXPLAIN分析目標SQL。EXPLAIN中各欄位含義,請參見EXPLAIN。
EXPLAIN PIPELINE <存在效能問題的SQL>利用system.query_log表分析目標SQL。
SELECT
  hostname () AS  host,
  *
FROM
  clusterAllReplicas (`default`, system.query_log)
WHERE
  event_time > '2025-01-18 00:00:00'
  AND event_time < '2025-01-18 03:00:00'
  AND initial_query_id = '<INITIAL_QUERY_ID>'
  AND type = 'QueryFinish'
ORDER BY
  query_start_time_microseconds
參數說明如下。
INITIAL_QUERY_ID:目標查詢語句的查詢ID。
除了配置上述參數外,您還需配置event_time,擷取目標時間段的資料。
您需重點關注以下返回欄位:
ProfileEvents:此欄位提供了詳細的查詢執行事件計數器和統計資訊,協助您分析查詢的效能和資源使用方式進行指標對比。更多查詢事件資訊,請參見events。
Settings:此欄位提供了查詢執行時所使用的各種配置參數,這些參數可以影響查詢的行為和效能。通過查看此欄位,您可以更好地理解和最佳化目標SQL。更多查詢參數資訊,請參見settings。
query_duration_ms:此欄位表示查詢的總執行時間。如果發現某個子查詢特別慢,可以使用子查詢query_id在記錄檔中尋找執行細節。如何修改記錄層級,請參見配置config.xml參數。
如果上述方法均無法定位到目標語句導致效能變差的問題,您可以在自建的ClickHouse上查詢目標語句相關資訊,並與目標語句在雲資料庫ClickHouse的相關資訊進行對比,進而分析上雲後目標語句效能下降的原因。
步驟四:SQL最佳化
定位到導致效能問題的SQL後,您可以對目標SQL進行相應的最佳化。以下提供幾種最佳化方向,具體問題仍需根據實際情況進行分析和處理。
索引最佳化:分析目標語句,定位經常用於過濾的列,為其建立索引。
資料類型:合適的資料類型可以減少儲存空間並提高查詢效能。
查詢最佳化:
查詢列最佳化:避免使用SELECT * ,只選擇需要的列,減少I/O和網路傳輸。
WHERE 子句最佳化:子句中使用主鍵和索引欄位。
使用 PREWHERE:對於複雜的過濾條件,可以使用
PREWHERE子句來提前過濾資料,減少後續處理的資料量。JOIN最佳化:對於分布式表,使用 GLOBAL JOIN可以提高 JOIN 效能。
參數設定最佳化:通過調整查詢設定來最佳化效能。例如,增加
max_threads可以利用更多 CPU 核心,但需注意不要過度配置導致資源爭用。更多查詢參數資訊,請參見settings。如何查看查詢中的參數設定,請參見SQL效能分析。物化視圖:對於頻繁執行的複雜查詢,可以建立物化視圖來預先計算結果,從而提高查詢效能。
資料壓縮:ClickHouse預設啟用了資料壓縮,可以通過調整壓縮演算法和層級來進一步最佳化儲存和查詢效能。
配置更大緩衝:對於頻繁執行且結果不經常變化的查詢,雲資料庫ClickHouse使用查詢快取來提高效能。當您發現目前緩衝不能滿足需求時,可修改uncompressed_cache_size參數,設定更大緩衝空間。如何修改參數,請參見配置config.xml參數。