本文介紹如何使用 OpenTelemetry 對 Istio 進行鏈路追蹤。通過 Istio 的鏈路追蹤功能,可以可視化服務調用關係和依賴、監控微服務的健康狀態、識別系統中的效能瓶頸以及排查分布式系統中的故障。
前提條件
叢集已安裝 Istio 且 Istio 版本 ≥ v1.19。
已部署 OpenTelemetry Collector。Istio 調用鏈需要通過 OpenTelemetry Collector 轉寄上報至可觀測鏈路 OpenTelemetry 版。如您的叢集中尚未部署 OpenTelemetry Collector,請參考 通過 OpenTelemetry Collector 轉寄 進行部署。
擷取Managed Service for OpenTelemetry的存取點和鑒權資訊。詳情請參考 接入和鑒權說明。
接入步驟
1、設定 Istio 鏈路資料上報方式
Istio 可以通過 gRPC 或 HTTP 協議匯出 Trace 資料到 OpenTelemetry Collector。請選擇以下兩種方式中的一種進行配置。
使用 gRPC 協議
運行以下內容,Istio 的 Trace 資料將通過 OTLP/HTTP 匯出到 OpenTelemetry Collector。
建立設定檔istio-otel-config.yaml。
cat > istio-otel-config.yaml <<EOF
apiVersion: install.istio.io/v1alpha1
kind: IstioOperator
spec:
  meshConfig:
    defaultConfig:
      tracingServiceName: APP_LABEL_AND_NAMESPACE
    enableTracing: true
    extensionProviders:
    - name: otel-tracing
      opentelemetry:
        port: 4317
        service: <service-name>.<namespace>.svc.cluster.local
        resource_detectors:
          environment: {}
EOF
使用 HTTP 協議
運行以下內容,Istio 的 Trace 資料將通過 OTLP/HTTP 匯出到 OpenTelemetry Collector。
建立設定檔istio-otel-config.yaml。
cat > istio-otel-config.yaml <<EOF apiVersion: install.istio.io/v1alpha1 kind: IstioOperator spec: meshConfig: enableTracing: true extensionProviders: - name: otel-tracing opentelemetry: port: 4318 service: opentelemetry-collector.observability.svc.cluster.local http: path: "/v1/traces" timeout: 5s headers: - name: "custom-header" value: "custom value" resource_detectors: environment: {} EOF說明需要將配置中的
service地址替換為您環境中 OpenTelemetry Collector 的實際服務地址,<service-name>為 OpenTelemetry Collector 的服務名稱,<namespace> 為OpenTelemetry Collector 所在命名空間的名稱。例如:opentelemetry-collector.observability.svc.cluster.local。Istio 提供了配置選項 tracingServiceName 來控制應用程式名稱的產生方式,有三種選項。
APP_LABEL_AND_NAMESPACE(預設值):使用<app標籤>.<命名空間>格式。CANONICAL_NAME_ONLY:僅使用工作負載的正式名稱,如 Deployment 的名稱。CANONICAL_NAME_AND_NAMESPACE:使用<正式名稱>.<命名空間>格式。
使用該設定檔安裝。
istioctl install -y -f istio-otel-config.yaml
2、為 Istio 開啟鏈路追蹤
配置完鏈路資料上報後,還需要開啟 Istio 鏈路資料擷取功能並設定採樣比例。運行以下命令來啟用鏈路追蹤。
建立設定檔istio-telemetry.yaml。
cat > istio-telemetry.yaml <<EOF apiVersion: telemetry.istio.io/v1 kind: Telemetry metadata: name: otel-demo spec: tracing: - providers: - name: otel-tracing randomSamplingPercentage: 100 EOF說明randomSamplingPercentage表示追蹤採樣率,取值 0-100,設定為 100 表示記錄所有請求的追蹤資料。在生產環境中,建議根據實際流量情況調整該值。應用配置。
kubectl apply -f istio-telemetry.yaml完成以上配置後,當服務間有調用發生時,Istio 就會自動產生鏈路資料,並通過 OpenTelemetry Collector 轉寄到Managed Service for OpenTelemetry。
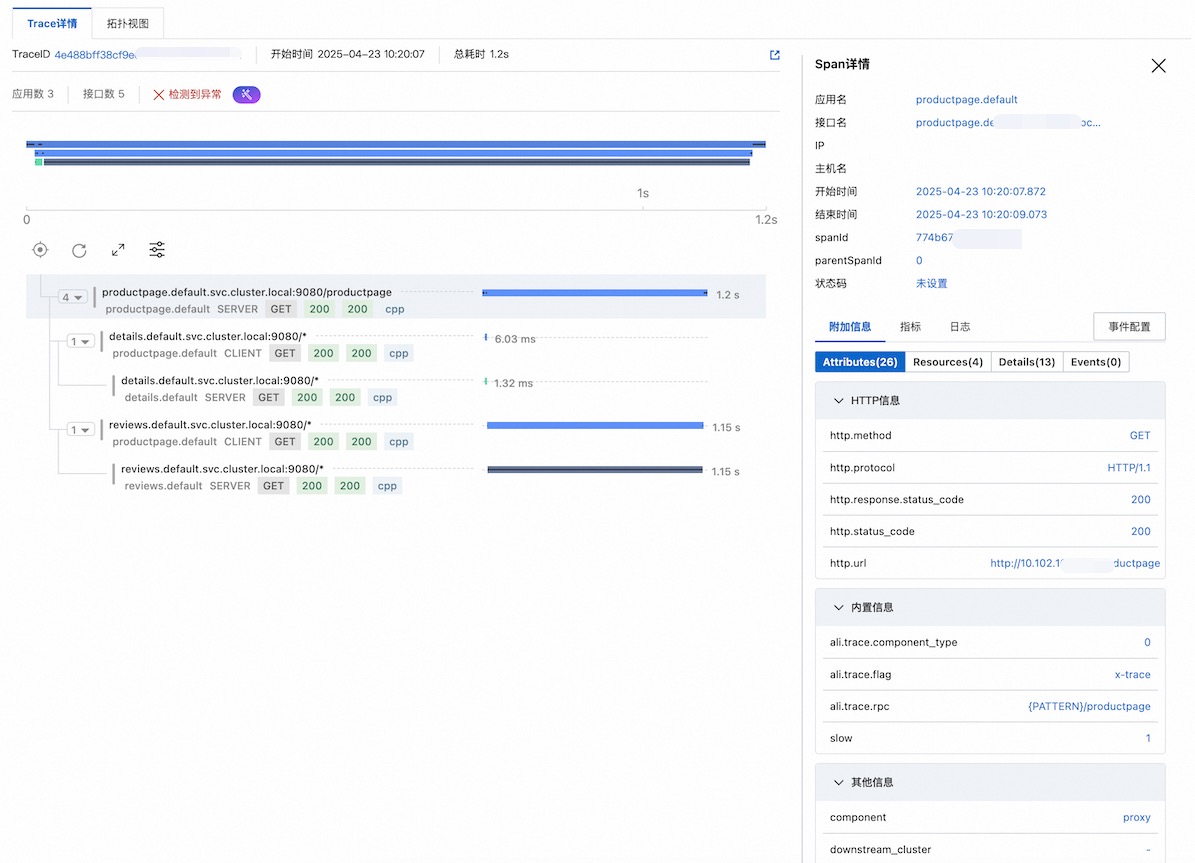
3、查看 Istio 調用鏈
前往可觀測鏈路 OpenTelemetry 版控制台查看 Istio 的調用鏈。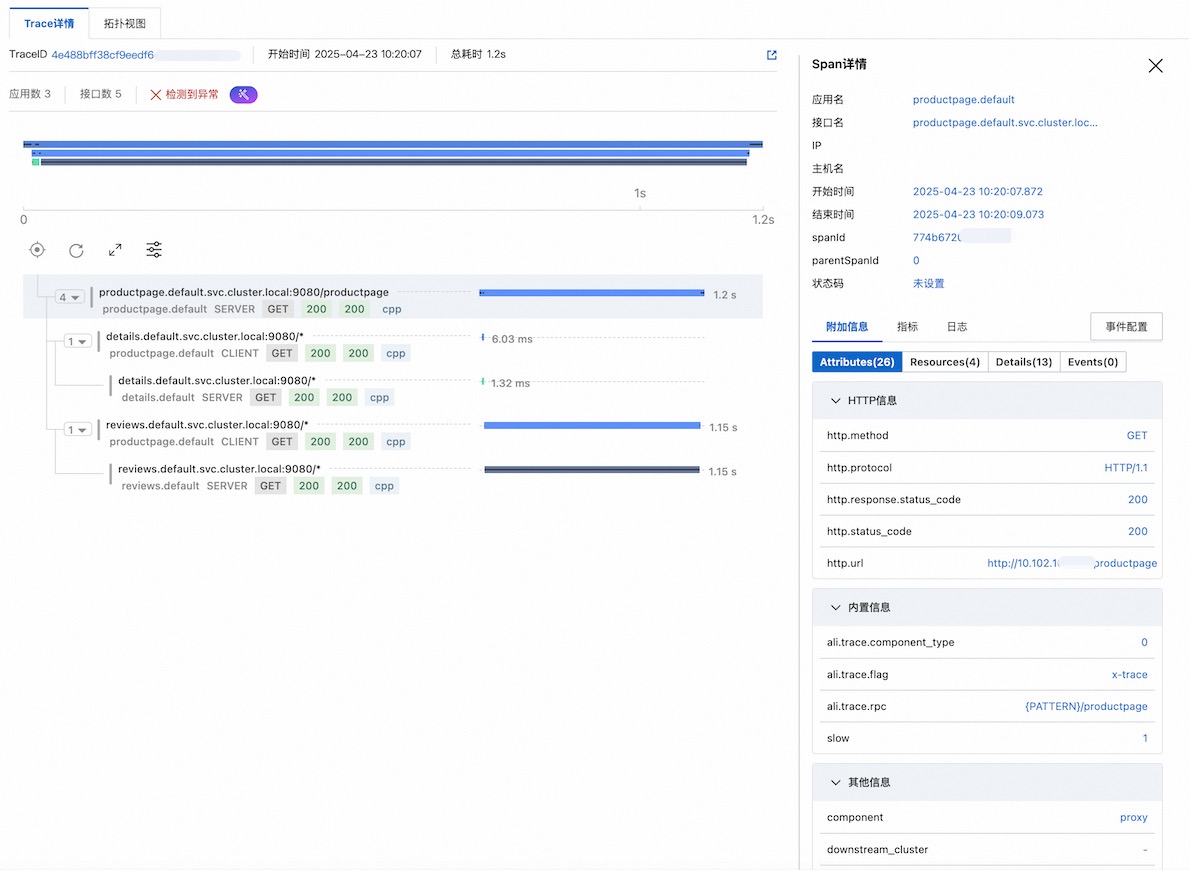
實踐教程
接下來將通過以下樣本示範如何採集 Istio 的調用鏈,並上報至Managed Service for OpenTelemetry。
1、安裝 Istio
curl -L https://istio.io/downloadIstio | sh -

cd istio-1.25.2

export PATH=$PWD/bin:$PATH
2、安裝 OpenTelemetry Collector
建立otel.yaml,需要替換 <gRPC-Endpoint> 和 <gRPC-Token> 為前提條件中擷取的存取點和鑒權 Token。
cat > otel.yaml <<EOF
apiVersion: v1
kind: ConfigMap
metadata:
  name: opentelemetry-collector-conf
  labels:
    app: opentelemetry-collector
data:
  opentelemetry-collector-config: |
    receivers:
      otlp:
        protocols:
          grpc:
          http:
    processors:
      batch:
    exporters:
      otlp:
        endpoint: "<gRPC-Endpoint>"
        headers:
          Authentication: "<gRPC-Token>"
        tls:
          insecure: true
      logging:
        loglevel: debug
    extensions:
      health_check:
        port: 13133
    service:
      extensions:
      - health_check
      pipelines:
        logs:
          receivers: [otlp]
          processors: [batch]
          exporters: [logging]
        traces:
          receivers:
          - otlp
          exporters:
          - logging
          - otlp
---
apiVersion: v1
kind: Service
metadata:
  name: opentelemetry-collector
  labels:
    app: opentelemetry-collector
spec:
  ports:
    - name: grpc-opencensus
      port: 55678
      protocol: TCP
      targetPort: 55678
    - name: grpc-otlp # Default endpoint for OpenTelemetry receiver.
      port: 4317
      protocol: TCP
      targetPort: 4317
    - name: http-otlp # HTTP endpoint for OpenTelemetry receiver.
      port: 4318
      protocol: TCP
      targetPort: 4318
  selector:
    app: opentelemetry-collector
---
apiVersion: apps/v1
kind: Deployment
metadata:
  name: opentelemetry-collector
spec:
  selector:
    matchLabels:
      app: opentelemetry-collector
  strategy:
    rollingUpdate:
      maxSurge: 1
      maxUnavailable: 1
    type: RollingUpdate
  template:
    metadata:
      labels:
        app: opentelemetry-collector
        sidecar.istio.io/inject: "false" # do not inject
    spec:
      containers:
        - command:
            - "/otelcol"
            - "--config=/conf/opentelemetry-collector-config.yaml"
          env:
            - name: POD_NAME
              valueFrom:
                fieldRef:
                  apiVersion: v1
                  fieldPath: metadata.name
            - name: POD_NAMESPACE
              valueFrom:
                fieldRef:
                  apiVersion: v1
                  fieldPath: metadata.namespace
          image: otel/opentelemetry-collector:0.54.0
          imagePullPolicy: IfNotPresent
          name: opentelemetry-collector
          ports:
            - containerPort: 4317
              protocol: TCP
            - containerPort: 4318
              protocol: TCP
            - name: grpc-opencensus
              containerPort: 55678
              protocol: TCP
          resources:
            limits:
              cpu: "2"
              memory: 4Gi
            requests:
              cpu: 200m
              memory: 400Mi
          terminationMessagePath: /dev/termination-log
          terminationMessagePolicy: File
          volumeMounts:
            - name: opentelemetry-collector-config-vol
              mountPath: /conf
      dnsPolicy: ClusterFirst
      restartPolicy: Always
      schedulerName: default-scheduler
      terminationGracePeriodSeconds: 30
      volumes:
        - configMap:
            defaultMode: 420
            items:
              - key: opentelemetry-collector-config
                path: opentelemetry-collector-config.yaml
            name: opentelemetry-collector-conf
          name: opentelemetry-collector-config-vol
EOF
建立命名空間 observability。
kubectl create namespace observability部署 OpenTelemetry Collector。
kubectl apply -f otel.yaml -n observability
3、設定 Istio 鏈路追蹤
在叢集中運行以下命令,Istio 的 Trace 資料將通過 OTLP/HTTP 匯出到 OpenTelemetry Collector。
cat <<EOF | istioctl install -y -f -
apiVersion: install.istio.io/v1alpha1
kind: IstioOperator
spec:
  meshConfig:
    enableTracing: true
    extensionProviders:
    - name: otel-tracing
      opentelemetry:
        port: 4317
        service: opentelemetry-collector.observability.svc.cluster.local
        resource_detectors:
          environment: {}
EOF
運行以下命令啟用 Istio 鏈路追蹤。
kubectl apply -f - <<EOF
apiVersion: telemetry.istio.io/v1
kind: Telemetry
metadata:
  name: otel-demo
spec:
  tracing:
  - providers:
    - name: otel-tracing
    randomSamplingPercentage: 100
EOF
4、部署 Demo
為 default 命名空間添加自動注入標籤。
Istio 將自動為該命名空間中新建立的 Pod 注入 sidecar 代理(istio-proxy 容器)。
kubectl label namespace default istio-injection=enabled部署 istio 內建的 Demo(在下載好的 istio 目錄中運行)。
kubectl apply -f samples/bookinfo/platform/kube/bookinfo.yaml查看容器組和服務狀態。
kubectl get pods
kubectl get services
驗證應用是否可訪問。
kubectl exec "$(kubectl get pod -l app=ratings -o jsonpath='{.items[0].metadata.name}')" -c ratings -- curl -sS productpage:9080/productpage | grep -o "<title>.*</title>"

# 預期輸出
<title>Simple Bookstore App</title>
5、建立 Demo 服務的對外訪問入口
建立 Demo 應用的入口網關配置。
kubectl apply -f samples/bookinfo/networking/bookinfo-gateway.yamlexport INGRESS_NAME=istio-ingressgateway export INGRESS_NS=istio-system export INGRESS_HOST=$(kubectl -n "$INGRESS_NS" get service "$INGRESS_NAME" -o jsonpath='{.status.loadBalancer.ingress[0].ip}') export INGRESS_PORT=$(kubectl -n "$INGRESS_NS" get service "$INGRESS_NAME" -o jsonpath='{.spec.ports[?(@.name=="http2")].port}') export SECURE_INGRESS_PORT=$(kubectl -n "$INGRESS_NS" get service "$INGRESS_NAME" -o jsonpath='{.spec.ports[?(@.name=="https")].port}') export TCP_INGRESS_PORT=$(kubectl -n "$INGRESS_NS" get service "$INGRESS_NAME" -o jsonpath='{.spec.ports[?(@.name=="tcp")].port}') export GATEWAY_URL=$INGRESS_HOST:$INGRESS_PORT # 查看產生的訪問地址 echo $GATEWAY_URL # 輸出樣本:192.168.1.100:80驗證 Demo 訪問地址。
curl -s "http://${GATEWAY_URL}/productpage" | grep -o "<title>.*</title>"

# 預期輸出
<title>Simple Bookstore App</title>
6、查看調用鏈
使用以下命令連續訪問 10 次 productpage 頁面,以產生測試流量。
for i in $(seq 1 10); do curl -s -o /dev/null "http://$GATEWAY_URL/productpage"; done前往可觀測鏈路 OpenTelemetry 版控制台查看 Istio 的調用鏈。
常見問題
問題:控制台未查詢到 Istio 的鏈路資料。
解決方案:
可查看 OpenTelemetry Collector 日誌,確認 OpenTelemetry Collector 正常運行並接收到了 Istio 上報的資料。
kubectl logs <collector-pod-name> -n <namespace>預期輸出:
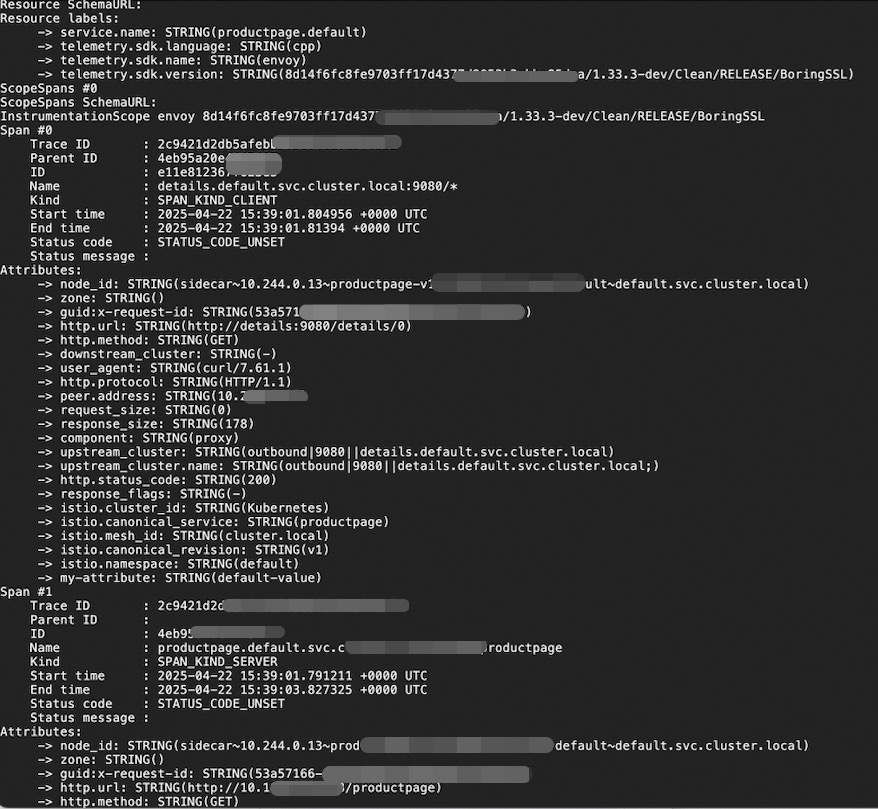
檢查 sidecar 是否注入成功。
kubectl get pod -n default -o custom-columns=NAME:.metadata.name,CONTAINERS:.spec.containers[*].name如果 CONTAINERS 中不包含 istio-proxy 容器,說明注入失敗。注入失敗的原因可能是:為命名空間設定
istio-injection=enabled自動注入標籤時,Pod 已經建立。該標籤只對新建立的 Pod 生效,已存在的 Pod 不受影響,需要重啟 Pod 後才會生效。檢查 Telemetry 資源是否正確配置。
使用以下命令檢查 Telemetry 配置。
kubectl get telemetry otel-demo -o yaml查看 Istio 的 ConfigMap 配置中與 OpenTelemetry 相關的部分是否正確。
kubectl get cm istio -n istio-system -o yaml | grep -A 10 extensionProviders