Gateway with Inference Extension組件支援將資料面指標輸出至 Prometheus。本文介紹如何使用Managed Service for Prometheus監控組件資料面的健全狀態。
前提條件
已安裝1.4.0版本的Gateway with Inference ExtensionGateway with Inference Extension並勾選啟用Gateway API推理擴充。操作入口,請參見安裝組件。
已開通阿里雲Prometheus監控。
指標採集方式
針對產生式AI推理服務,Gateway with Inference Extension的推理擴充提供了更全面的監控指標,包括首Token延遲(TTFT)、Token吞吐速率等資訊,指標格式滿足OpenTelemetry的產生式AI語義約定。
手動設定採集規則
手動設定採集規則無需開啟預設服務發現。
登入Prometheus控制台,在左側導覽列中單擊接入中心。
在搜尋方塊中搜尋“gateway”,單擊人工智慧下的Gateway with Inference Extension。
在右側彈出框中的選擇Container Service叢集的下拉框中選擇目的地組群,單擊確定。
彈出框中的配置保持預設即可。
您可以結合快速體驗中的mock應用來快速體驗。
自訂採集
手動設定採集規則預設會採集組件資料面的全部指標。您也可以通過新增自訂採集來自訂Gateway with Inference Extension組件相關的監控指標。以下為常用指標自訂配置樣本。
scrape_configs:
  - job_name: 'ack-gateway'
    kubernetes_sd_configs:
      - role: pod
        namespaces:
          names:
            - envoy-gateway-system
    relabel_configs:
      - source_labels: [__meta_kubernetes_pod_label_app_kubernetes_io_managed_by]
        regex: envoy-gateway
        action: keep
    scrape_interval: 15s
    metrics_path: /stats/prometheus
    scheme: http
    metric_relabel_configs:
      - source_labels: [__name__]
        regex: |
          (envoy_server_live|envoy_server_uptime|envoy_server_memory_allocated|envoy_server_memory_heap_size|
          envoy_cluster_membership_healthy|envoy_cluster_membership_total|envoy_cluster_upstream_cx_active|
          envoy_cluster_upstream_rq_total|envoy_cluster_upstream_cx_rx_bytes_total|envoy_cluster_upstream_cx_tx_bytes_total|
          envoy_http_downstream_cx_rx_bytes_total|envoy_http_downstream_cx_tx_bytes_total|envoy_cluster_upstream_rq_time_bucket|
          envoy_cluster_upstream_rq_xx|envoy_http_downstream_rq_total|envoy_http_downstream_cx_total|envoy_http_downstream_rq_time_bucket|
          envoy_listener_downstream_cx_active|envoy_tcp_downstream_cx_total|envoy_tcp_downstream_cx_rx_bytes_total|
          envoy_tcp_downstream_cx_tx_bytes_total|envoy_cluster_upstream_cx_total)
        action: keep
指標大盤
Gateway with Inference Extension同時也提供了對應的Grafana大盤,您可以通過叢集的查看組件對應的大盤。
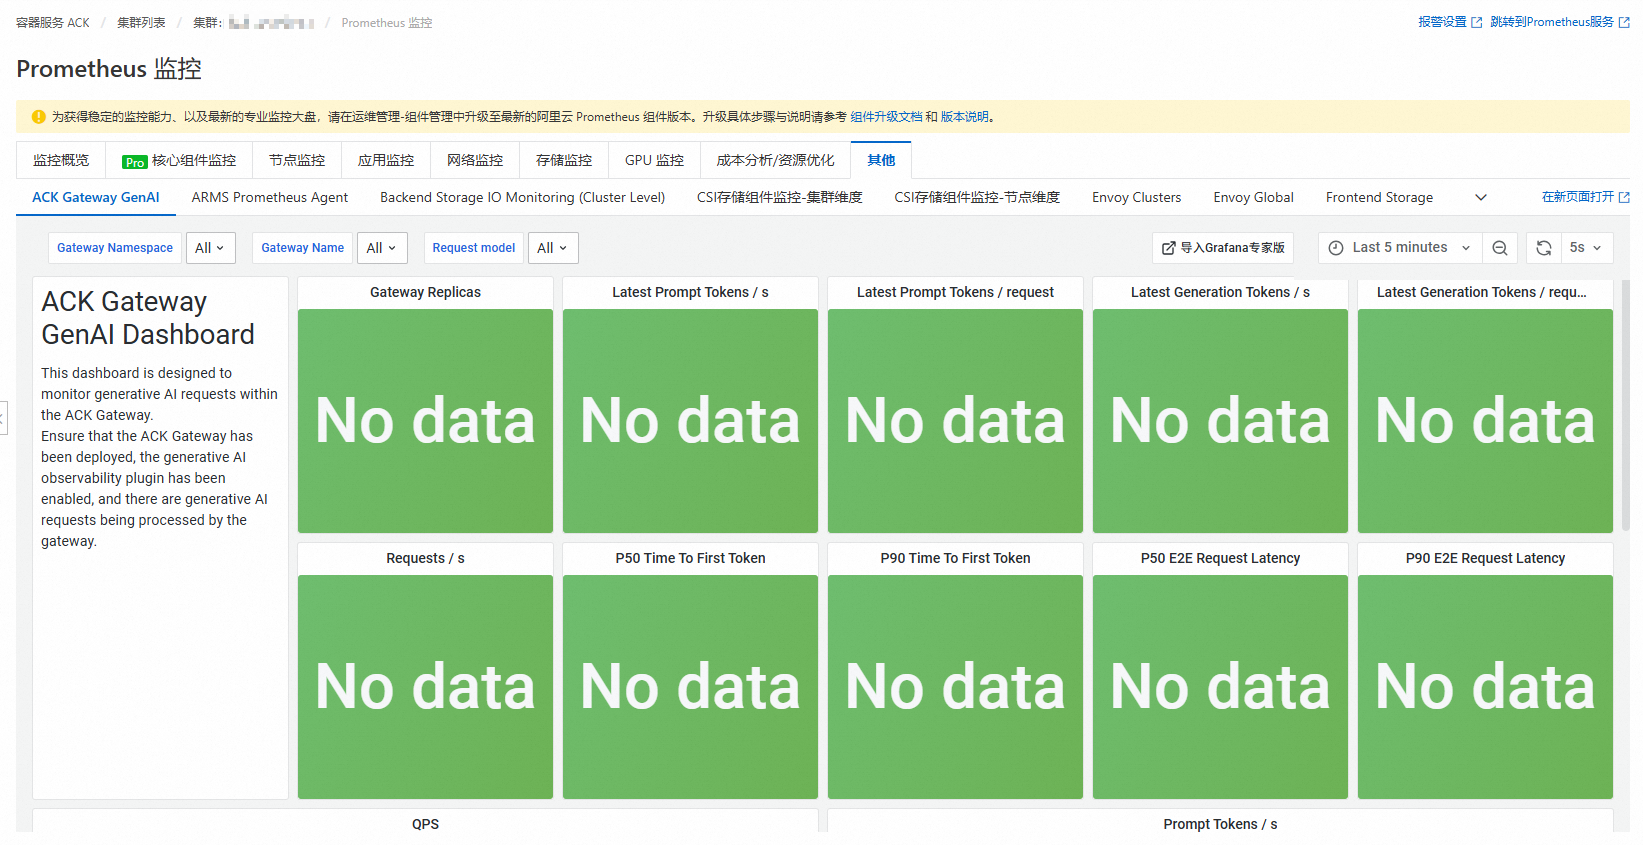
ACK Gateway GenAI:用於觀測當前叢集中產生式AI推理服務的各項指標。
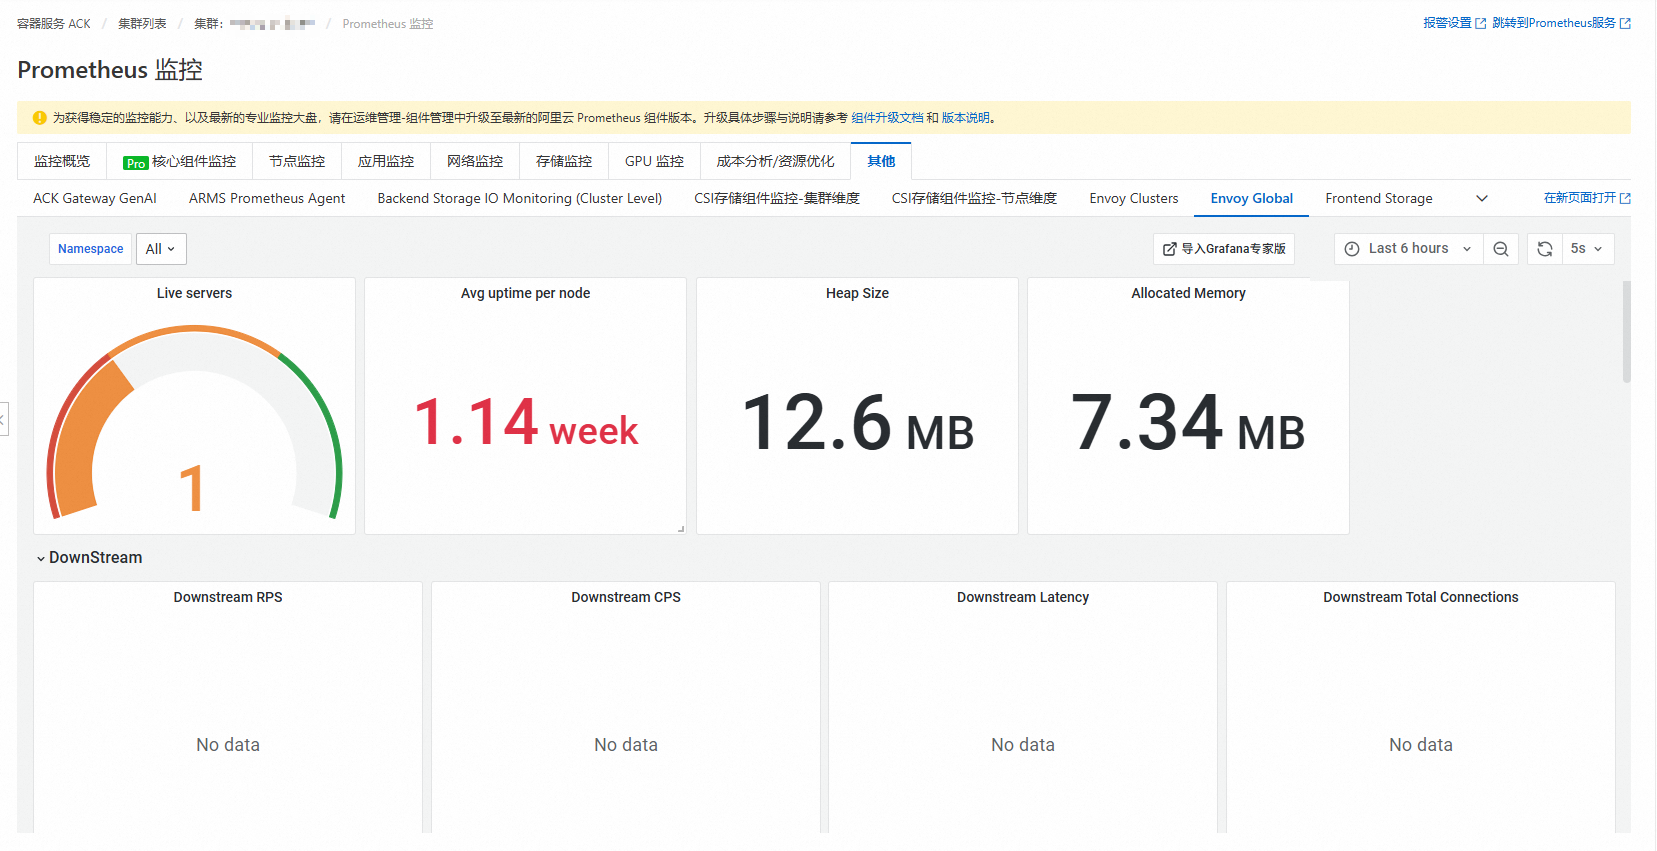
Envoy Global:提供了網關整體情況監控,主要包括網關資源使用方式、上下遊串連概覽以及端點健康情況等指標。
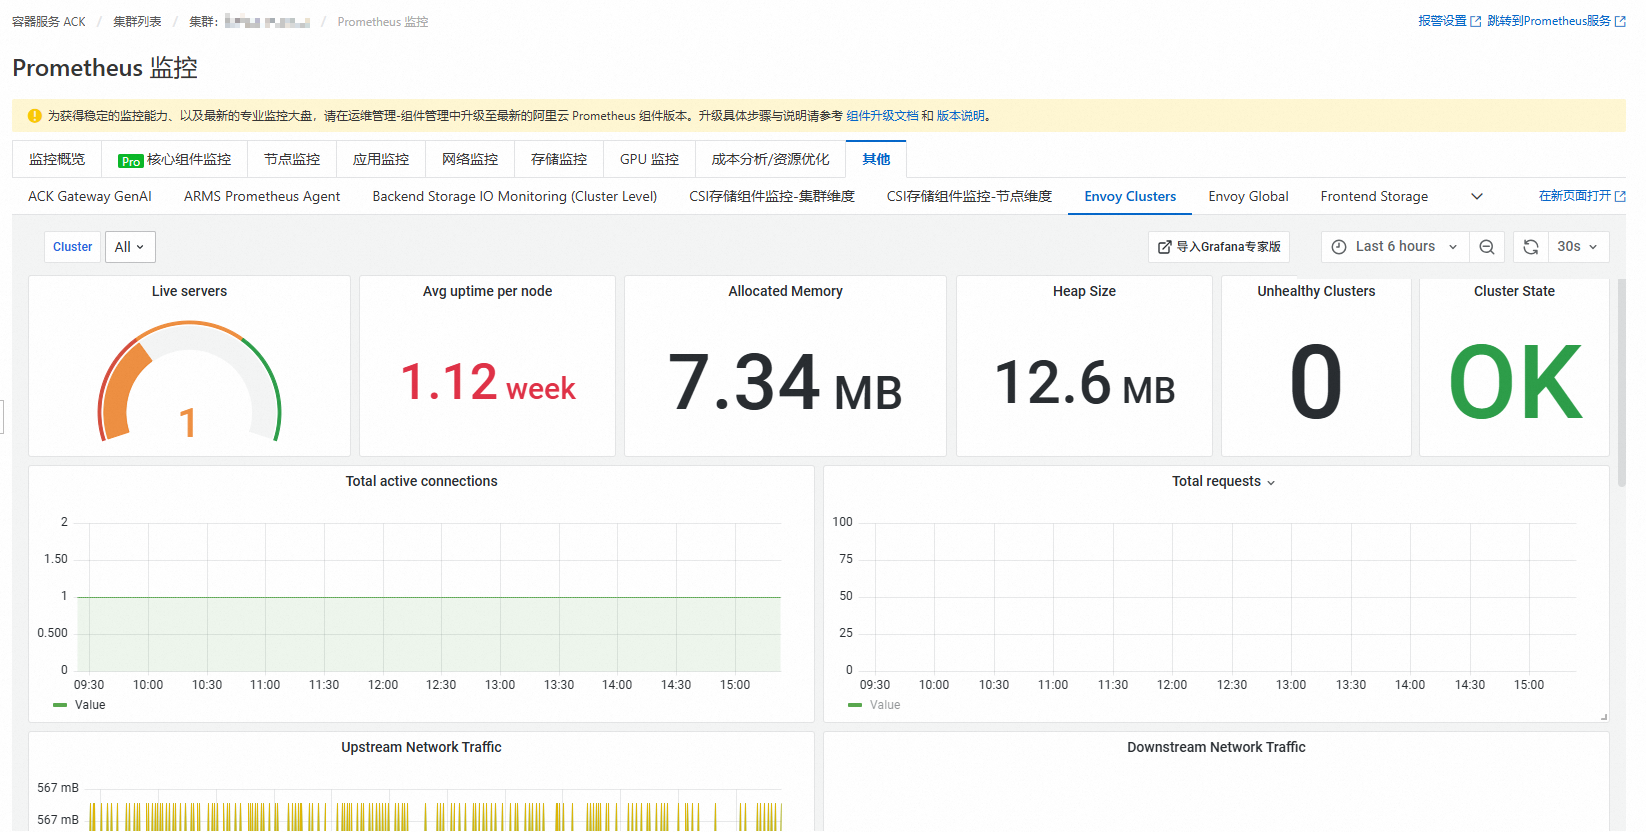
Envoy Clusters:Envoy Cluster層級的大盤。Cluster在Envoy中代表一組端點的集合。在Gateway with Inference Extension中,一個Cluster通常代表一個路由目標,比如HTTPRoute的第1條規則的第1個目標Service。這個大盤能提供更詳細的Cluster層級資訊。