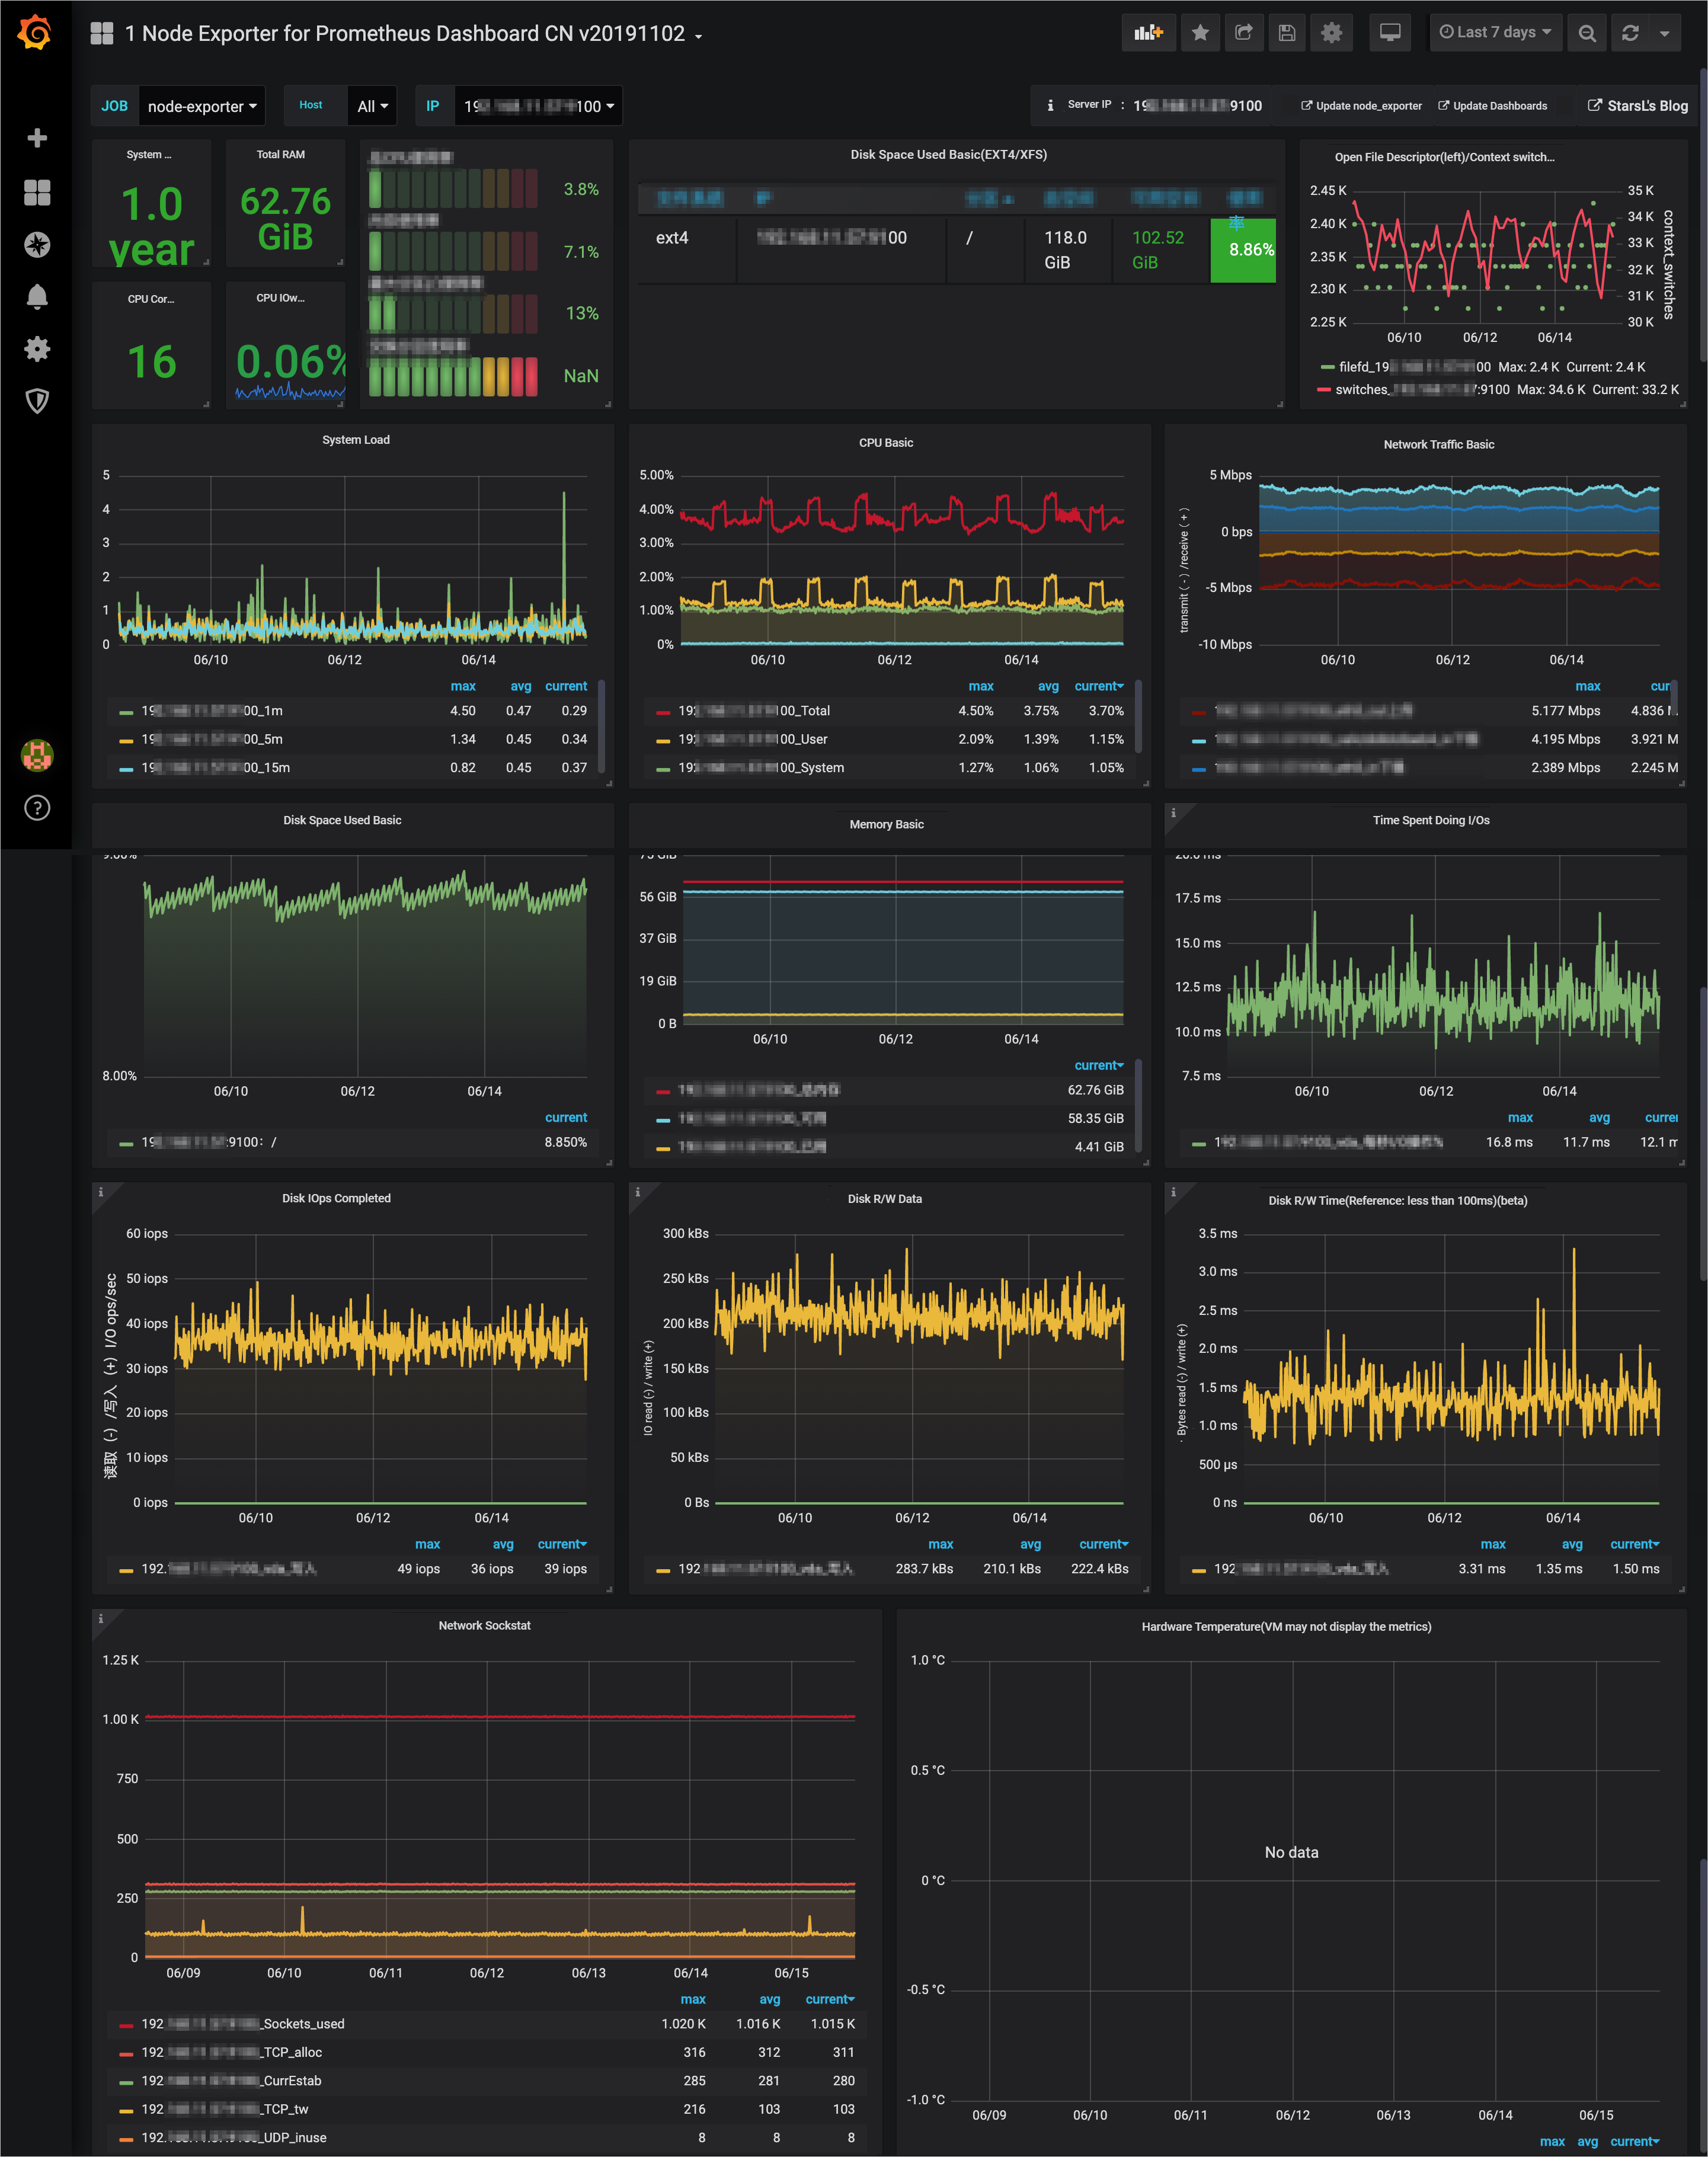
Implante o Prometheus no Kubernetes para coletar dados de monitoramento em um MetricStore do Simple Log Service e conecte o MetricStore ao Grafana para visualização.
Pré-requisitos
Você tem um cluster Kubernetes versão 1,10 ou posterior.
Um MetricStore foi criado. Para mais informações, consulte Criar um MetricStore.
O Grafana está instalado. Para mais informações, consulte Instalar o Grafana.
Contexto
O Prometheus é uma ferramenta de monitoramento nativa da nuvem com suporte integrado ao Kubernetes. A maioria dos componentes do Kubernetes expõe endpoints de métricas compatíveis com o Prometheus, o que o torna o padrão de fato para monitoramento nesse ambiente.
O Grafana é uma suíte de análise e visualização de código aberto compatível com modelos de painel do Prometheus. O Simple Log Service permite que o Grafana acesse dados de séries temporais. Conecte um MetricStore como fonte de dados do Prometheus no Grafana para visualizar seus dados de monitoramento.
Instalar o Prometheus em um Kubernetes autogerenciado
Se você utiliza um cluster Kubernetes autogerenciado, conecte-o à Alibaba Cloud como um cluster registrado. Para mais informações, consulte Visão geral de clusters registrados. Após registrar o cluster, siga as instruções em Instalar o Prometheus em um cluster ACK para instalar o Prometheus. Caso não utilize um cluster registrado, instale o Prometheus usando seu Helm chart. Antes da instalação, crie um secret e modifique as configurações padrão.
Instalar o Prometheus em um cluster ACK
Se você utiliza um cluster Container Service for Kubernetes (ACK), instale e configure o Prometheus a partir do Marketplace para armazenar dados no Simple Log Service.
Faça login no console do Container Service for Kubernetes (ACK).
Na página Clusters, clique no cluster desejado.
-
Crie um namespace.
No painel de navegação à esquerda, escolha Namespaces and Quotas.
Clique em Create.
Defina Name como monitoring e clique em OK.
-
Crie um secret.
No painel de navegação à esquerda, escolha .
No topo da página, selecione o namespace criado na Etapa 3, monitoring.
Clique em Create.
-
Configure os parâmetros a seguir e clique em OK.
Marque a caixa de seleção Encode data values in Base64.
Parâmetro
Descrição
Name
Defina como sls-sk.
Type
Selecione Opaque e adicione os seguintes pares chave-valor:
-
Name é username e Value é o AccessKey ID do seu usuário RAM.
-
Defina Name como password e Value como o AccessKey Secret do seu usuário RAM.
Utilize o par de AccessKeys de um usuário RAM com permissões somente de escrita no projeto do Simple Log Service. Para mais informações, consulte Conceder permissões de escrita em um projeto específico.
-
-
Crie o Prometheus Operator.
Retorne à página inicial do console ACK.
No painel de navegação à esquerda, escolha .
Clique em ack-prometheus-operator.
Clique em Deploy.
Na etapa Basic Information, selecione o cluster e o namespace desejados e clique em Next.
-
Na etapa Parameters, modifique os Parameters e clique em OK.
Altere a configuração
prometheusSpecretentionpara1dou12h.-
Substitua a configuração
remoteWrite. Para mais informações, consulte RemoteWriteSpec.O parâmetro
urlna configuraçãoremoteWriteespecifica o endpoint do seu MetricStore do Simple Log Service. Substitua o placeholder pela sua URL real. O formato da URL éhttps://{project}.{sls-endpoint}/prometheus/{project}/{metricstore}/api/v1/write. {sls-endpoint} é o endpoint do Simple Log Service. Para mais informações, consulte Endpoints. {project} e {metricstore} são os nomes do projeto e do MetricStore criados no Simple Log Service.NotaSe você estiver na rede interna da Alibaba Cloud, use o endpoint interno para obter melhor desempenho.
-
Caso o Prometheus processe um grande volume de dados, modifique as configurações de
queue_configconforme abaixo:batchSendDeadline: 30s capacity: 204800 maxBackoff: 5s maxSamplesPerSend: 4096 minBackoff: 100ms minShards: 100 maxShards: 2048
ImportantePara reduzir a transmissão de dados, adicione
writeRelabelConfigsà seçãoremoteWritepara descartar métricas não essenciais. A configuração padrão filtra muitas métricas de monitoramento do Kubernetes pouco utilizadas.remoteWrite: - basicAuth: username: name: sls-sk key: username password: name: sls-sk key: password queueConfig: batchSendDeadline: 30s capacity: 204800 maxBackoff: 5s maxSamplesPerSend: 4096 minBackoff: 100ms minShards: 100 maxShards: 2048 writeRelabelConfigs: - action: drop regex: APIServiceOpenAPIAggregationControllerQueue1_adds|APIServiceOpenAPIAggregationControllerQueue1_depth|APIServiceOpenAPIAggregationControllerQueue1_queue_latency|APIServiceOpenAPIAggregationControllerQueue1_queue_latency_count|APIServiceOpenAPIAggregationControllerQueue1_queue_latency_sum|APIServiceOpenAPIAggregationControllerQueue1_retries|APIServiceOpenAPIAggregationControllerQueue1_work_duration|APIServiceOpenAPIAggregationControllerQueue1_work_duration_count|APIServiceOpenAPIAggregationControllerQueue1_work_duration_sum|APIServiceRegistrationController_adds|APIServiceRegistrationController_depth|APIServiceRegistrationController_queue_latency|APIServiceRegistrationController_queue_latency_count|APIServiceRegistrationController_queue_latency_sum|APIServiceRegistrationController_retries|APIServiceRegistrationController_work_duration|APIServiceRegistrationController_work_duration_count|APIServiceRegistrationController_work_duration_sum|AvailableConditionController_adds|AvailableConditionController_depth|AvailableConditionController_queue_latency|AvailableConditionController_queue_latency_count|AvailableConditionController_queue_latency_sum|AvailableConditionController_retries|AvailableConditionController_work_duration|AvailableConditionController_work_duration_count|AvailableConditionController_work_duration_sum|DiscoveryController_adds|DiscoveryController_depth|DiscoveryController_queue_latency|DiscoveryController_queue_latency_count|DiscoveryController_queue_latency_sum|DiscoveryController_retries|DiscoveryController_work_duration|DiscoveryController_work_duration_count|DiscoveryController_work_duration_sum|admission_quota_controller_adds|admission_quota_controller_depth|admission_quota_controller_queue_latency|admission_quota_controller_queue_latency_count|admission_quota_controller_queue_latency_sum|admission_quota_controller_work_duration|admission_quota_controller_work_duration_count|admission_quota_controller_work_duration_sum|alertmanager_alerts|alertmanager_alerts_invalid_total|alertmanager_alerts_received_total|alertmanager_build_info|alertmanager_cluster_failed_peers|alertmanager_cluster_health_score|alertmanager_cluster_members|alertmanager_cluster_messages_pruned_total|alertmanager_cluster_messages_queued|alertmanager_cluster_messages_received_size_total|alertmanager_cluster_messages_received_total|alertmanager_cluster_messages_sent_size_total|alertmanager_cluster_messages_sent_total|alertmanager_cluster_peers_joined_total|alertmanager_cluster_peers_left_total|alertmanager_cluster_peers_update_total|alertmanager_cluster_reconnections_failed_total|alertmanager_cluster_reconnections_total|alertmanager_cluster_refresh_join_failed_total|alertmanager_cluster_refresh_join_total|alertmanager_config_hash|alertmanager_config_last_reload_success_timestamp_seconds|alertmanager_config_last_reload_successful|alertmanager_http_request_duration_seconds_bucket|alertmanager_http_request_duration_seconds_count|alertmanager_http_request_duration_seconds_sum|alertmanager_http_response_size_bytes_bucket|alertmanager_http_response_size_bytes_count|alertmanager_http_response_size_bytes_sum|alertmanager_nflog_gc_duration_seconds|alertmanager_nflog_gc_duration_seconds_count|alertmanager_nflog_gc_duration_seconds_sum|alertmanager_nflog_gossip_messages_propagated_total|alertmanager_nflog_queries_total|alertmanager_nflog_query_duration_seconds_bucket|alertmanager_nflog_query_duration_seconds_count|alertmanager_nflog_query_duration_seconds_sum|alertmanager_nflog_query_errors_total|alertmanager_nflog_snapshot_duration_seconds|alertmanager_nflog_snapshot_duration_seconds_count|alertmanager_nflog_snapshot_duration_seconds_sum|alertmanager_nflog_snapshot_size_bytes|alertmanager_notification_latency_seconds_bucket|alertmanager_notification_latency_seconds_count|alertmanager_notification_latency_seconds_sum|alertmanager_notifications_failed_total|alertmanager_notifications_total|alertmanager_oversize_gossip_message_duration_seconds_bucket|alertmanager_oversize_gossip_message_duration_seconds_count|alertmanager_oversize_gossip_message_duration_seconds_sum|alertmanager_oversized_gossip_message_dropped_total|alertmanager_oversized_gossip_message_failure_total|alertmanager_oversized_gossip_message_sent_total|alertmanager_peer_position|alertmanager_silences|alertmanager_silences_gc_duration_seconds|alertmanager_silences_gc_duration_seconds_count|alertmanager_silences_gc_duration_seconds_sum|alertmanager_silences_gossip_messages_propagated_total|alertmanager_silences_queries_total|alertmanager_silences_query_duration_seconds_bucket|alertmanager_silences_query_duration_seconds_count|alertmanager_silences_query_duration_seconds_sum|alertmanager_silences_query_errors_total|alertmanager_silences_snapshot_duration_seconds|alertmanager_silences_snapshot_duration_seconds_count|alertmanager_silences_snapshot_duration_seconds_sum|alertmanager_silences_snapshot_size_bytes|apiserver_admission_controller_admission_latencies_seconds_bucket|apiserver_admission_controller_admission_latencies_seconds_count|apiserver_admission_controller_admission_latencies_seconds_sum|apiserver_admission_step_admission_latencies_seconds_bucket|apiserver_admission_step_admission_latencies_seconds_count|apiserver_admission_step_admission_latencies_seconds_sum|apiserver_admission_step_admission_latencies_seconds_summary|apiserver_admission_step_admission_latencies_seconds_summary_count|apiserver_admission_step_admission_latencies_seconds_summary_sum|apiserver_admission_webhook_admission_latencies_seconds_bucket|apiserver_admission_webhook_admission_latencies_seconds_count|apiserver_admission_webhook_admission_latencies_seconds_sum|apiserver_audit_event_total|apiserver_audit_level_total|apiserver_client_certificate_expiration_seconds_bucket|apiserver_client_certificate_expiration_seconds_count|apiserver_client_certificate_expiration_seconds_sum|apiserver_current_inflight_requests|apiserver_registered_watchers|apiserver_request_latencies_bucket|apiserver_request_latencies_count|apiserver_request_latencies_sum|apiserver_request_latencies_summary_count|apiserver_request_latencies_summary_sum|apiserver_response_sizes_bucket|apiserver_response_sizes_count|apiserver_response_sizes_sum|apiserver_storage_data_key_generation_failures_total|apiserver_storage_data_key_generation_latencies_microseconds_bucket|apiserver_storage_data_key_generation_latencies_microseconds_count|apiserver_storage_data_key_generation_latencies_microseconds_sum|apiserver_storage_envelope_transformation_cache_misses_total|authenticated_user_requests|autoregister_adds|autoregister_depth|autoregister_queue_latency|autoregister_queue_latency_count|autoregister_queue_latency_sum|autoregister_retries|autoregister_work_duration|autoregister_work_duration_count|autoregister_work_duration_sum|cadvisor_version_info|container_cpu_cfs_periods_total|container_cpu_load_average_10s|container_cpu_system_seconds_total|container_cpu_user_seconds_total|container_fs_inodes_free|container_fs_inodes_total|container_fs_io_current|container_fs_io_time_seconds_total|container_fs_io_time_weighted_seconds_total|container_fs_reads_merged_total|container_fs_reads_total|container_fs_sector_reads_total|container_fs_sector_writes_total|container_fs_writes_merged_total|container_fs_writes_total|container_last_seen|container_memory_cache|container_memory_failcnt|container_memory_failures_total|container_memory_mapped_file|container_memory_max_usage_bytes|container_memory_swap|container_network_receive_errors_total|container_network_receive_packets_dropped_total|container_network_receive_packets_total|container_network_transmit_errors_total|container_network_transmit_packets_dropped_total|container_scrape_error|container_spec_cpu_period|container_spec_cpu_shares|container_spec_memory_reservation_limit_bytes|container_spec_memory_swap_limit_bytes|container_start_time_seconds|container_tasks_state|coredns_autopath_success_count_total|coredns_forward_request_count_total|coredns_forward_request_duration_seconds_bucket|coredns_forward_request_duration_seconds_count|coredns_forward_request_duration_seconds_sum|coredns_forward_response_rcode_count_total|coredns_forward_sockets_open|coredns_plugin_enabled|coredns_proxy_request_count_total|coredns_proxy_request_duration_seconds_bucket|coredns_proxy_request_duration_seconds_count|coredns_proxy_request_duration_seconds_sum|crdEstablishing_adds|crdEstablishing_depth|crdEstablishing_queue_latency_count|crdEstablishing_queue_latency_sum|crdEstablishing_retries|crdEstablishing_work_duration_count|crdEstablishing_work_duration_sum|etcd_helper_cache_entry_count|etcd_helper_cache_hit_count|etcd_helper_cache_miss_count|etcd_object_counts|etcd_request_cache_add_latencies_summary_count|etcd_request_cache_add_latencies_summary_sum|etcd_request_cache_get_latencies_summary_count|etcd_request_cache_get_latencies_summary_sum|get_token_count|get_token_fail_count|go_memstats_heap_released_bytes_total|grafana_alerting_active_alerts|grafana_alerting_execution_time_milliseconds_count|grafana_alerting_execution_time_milliseconds_sum|grafana_api_admin_user_created_total|grafana_api_dashboard_get_milliseconds_count|grafana_api_dashboard_get_milliseconds_sum|grafana_api_dashboard_save_milliseconds_count|grafana_api_dashboard_save_milliseconds_sum|grafana_api_dashboard_search_milliseconds_count|grafana_api_dashboard_search_milliseconds_sum|grafana_api_dashboard_snapshot_create_total|grafana_api_dashboard_snapshot_external_total|grafana_api_dashboard_snapshot_get_total|grafana_api_dataproxy_request_all_milliseconds_count|grafana_api_dataproxy_request_all_milliseconds_sum|grafana_api_login_oauth_total|grafana_api_login_post_total|grafana_api_models_dashboard_insert_total|grafana_api_org_create_total|grafana_api_response_status_total|grafana_api_user_signup_completed_total|grafana_api_user_signup_invite_total|grafana_api_user_signup_started_total|grafana_aws_cloudwatch_get_metric_data_total|grafana_aws_cloudwatch_get_metric_statistics_total|grafana_aws_cloudwatch_list_metrics_total|grafana_build_info|grafana_db_datasource_query_by_id_total|grafana_info|grafana_instance_start_total|grafana_page_response_status_total|grafana_proxy_response_status_total|grafana_stat_active_users|grafana_stat_total_orgs|grafana_stat_total_playlists|grafana_stat_total_users|grafana_stat_totals_dashboard|grpc_client_handled_total|grpc_client_msg_received_total|grpc_client_msg_sent_total|grpc_client_started_total|http_request_duration_microseconds|http_request_duration_microseconds_count|http_request_duration_microseconds_sum|http_request_duration_milliseconds_count|http_request_duration_milliseconds_sum|http_request_size_bytes|http_request_size_bytes_count|http_request_size_bytes_sum|http_request_total|http_requests_total|http_response_size_bytes|http_response_size_bytes_count|http_response_size_bytes_sum|kube_configmap_created|kube_configmap_info|kube_configmap_metadata_resource_version|kube_daemonset_labels|kube_daemonset_metadata_generation|kube_daemonset_status_current_number_scheduled|kube_daemonset_status_number_available|kube_daemonset_status_number_misscheduled|kube_daemonset_status_number_unavailable|kube_daemonset_updated_number_scheduled|kube_deployment_labels|kube_deployment_spec_paused|kube_deployment_spec_strategy_rollingupdate_max_surge|kube_endpoint_address_available|kube_endpoint_address_not_ready|kube_endpoint_created|kube_endpoint_info|kube_endpoint_labels|kube_ingress_created|kube_ingress_info|kube_ingress_labels|kube_ingress_metadata_resource_version|kube_job_complete|kube_job_created|kube_job_info|kube_job_labels|kube_job_owner|kube_job_spec_completions|kube_job_spec_parallelism|kube_job_status_active|kube_job_status_completion_time|kube_job_status_failed|kube_job_status_start_time|kube_job_status_succeeded|kube_namespace_annotations|kube_namespace_created|kube_namespace_labels|kube_namespace_status_phase|kube_node_created|kube_node_status_allocatable|kube_node_status_capacity|kube_node_status_capacity_pods|kube_pod_completion_time|kube_pod_container_resource_requests|kube_pod_container_status_last_terminated_reason|kube_pod_container_status_ready|kube_pod_container_status_terminated_reason|kube_pod_container_status_waiting_reason|kube_pod_created|kube_pod_start_time|kube_pod_status_ready|kube_pod_status_scheduled|kube_pod_status_scheduled_time|kube_replicaset_created|kube_replicaset_labels|kube_replicaset_metadata_generation|kube_replicaset_owner|kube_replicaset_spec_replicas|kube_replicaset_status_fully_labeled_replicas|kube_replicaset_status_observed_generation|kube_replicaset_status_ready_replicas|kube_replicaset_status_replicas|kube_secret_created|kube_secret_info|kube_secret_labels|kube_secret_metadata_resource_version|kube_secret_type|kube_service_created|kube_service_labels|kube_service_spec_type|kube_service_status_load_balancer_ingress|kube_statefulset_created|kube_statefulset_labels|kube_statefulset_metadata_generation|kube_statefulset_replicas|kube_statefulset_status_current_revision|kube_statefulset_status_observed_generation|kube_statefulset_status_replicas|kube_statefulset_status_replicas_current|kube_statefulset_status_replicas_ready|kube_statefulset_status_replicas_updated|kube_statefulset_status_update_revision|kubelet_certificate_manager_client_expiration_seconds|kubelet_cgroup_manager_latency_microseconds|kubelet_cgroup_manager_latency_microseconds_count|kubelet_cgroup_manager_latency_microseconds_sum|kubelet_containers_per_pod_count|kubelet_containers_per_pod_count_count|kubelet_containers_per_pod_count_sum|kubelet_docker_operations|kubelet_docker_operations_errors|kubelet_docker_operations_latency_microseconds|kubelet_docker_operations_latency_microseconds_count|kubelet_docker_operations_latency_microseconds_sum|kubelet_docker_operations_timeout|kubelet_eviction_stats_age_microseconds_count|kubelet_eviction_stats_age_microseconds_sum|kubelet_network_plugin_operations_latency_microseconds|kubelet_network_plugin_operations_latency_microseconds_count|kubelet_network_plugin_operations_latency_microseconds_sum|kubelet_node_config_error|kubelet_pleg_relist_interval_microseconds|kubelet_pleg_relist_interval_microseconds_count|kubelet_pleg_relist_interval_microseconds_sum|kubelet_pleg_relist_latency_microseconds|kubelet_pleg_relist_latency_microseconds_count|kubelet_pleg_relist_latency_microseconds_sum|kubelet_pod_start_latency_microseconds|kubelet_pod_start_latency_microseconds_count|kubelet_pod_start_latency_microseconds_sum|kubelet_pod_worker_latency_microseconds|kubelet_pod_worker_latency_microseconds_count|kubelet_pod_worker_latency_microseconds_sum|kubelet_pod_worker_start_latency_microseconds|kubelet_pod_worker_start_latency_microseconds_count|kubelet_pod_worker_start_latency_microseconds_sum|kubelet_running_container_count|kubelet_running_pod_count|kubelet_runtime_operations|kubelet_runtime_operations_errors|kubelet_runtime_operations_latency_microseconds|kubelet_runtime_operations_latency_microseconds_count|kubelet_runtime_operations_latency_microseconds_sum|kubernetes_build_info|net_conntrack_dialer_conn_attempted_total|net_conntrack_dialer_conn_closed_total|net_conntrack_dialer_conn_established_total|net_conntrack_dialer_conn_failed_total|net_conntrack_listener_conn_accepted_total|net_conntrack_listener_conn_closed_total|nginx_ingress_controller_leader_election_status|nginx_ingress_controller_ssl_expire_time_seconds|prometheus_api_remote_read_queries|prometheus_build_info|prometheus_config_last_reload_success_timestamp_seconds|prometheus_config_last_reload_successful|prometheus_engine_queries|prometheus_engine_queries_concurrent_max|prometheus_engine_query_duration_seconds|prometheus_engine_query_duration_seconds_count|prometheus_engine_query_duration_seconds_sum|prometheus_http_request_duration_seconds_bucket|prometheus_http_request_duration_seconds_count|prometheus_http_request_duration_seconds_sum|prometheus_http_response_size_bytes_bucket|prometheus_http_response_size_bytes_count|prometheus_http_response_size_bytes_sum|prometheus_notifications_alertmanagers_discovered|prometheus_notifications_dropped_total|prometheus_notifications_errors_total|prometheus_notifications_latency_seconds|prometheus_notifications_latency_seconds_count|prometheus_notifications_latency_seconds_sum|prometheus_notifications_queue_capacity|prometheus_notifications_queue_length|prometheus_notifications_sent_total|prometheus_operator_node_address_lookup_errors_total|prometheus_operator_reconcile_errors_total|prometheus_operator_spec_replicas|prometheus_operator_triggered_total|prometheus_remote_storage_dropped_samples_total|prometheus_remote_storage_enqueue_retries_total|prometheus_remote_storage_failed_samples_total|prometheus_remote_storage_highest_timestamp_in_seconds|prometheus_remote_storage_pending_samples|prometheus_remote_storage_queue_highest_sent_timestamp_seconds|prometheus_remote_storage_remote_read_queries|prometheus_remote_storage_retried_samples_total|prometheus_remote_storage_samples_in_total|prometheus_remote_storage_sent_batch_duration_seconds_bucket|prometheus_remote_storage_sent_batch_duration_seconds_count|prometheus_remote_storage_sent_batch_duration_seconds_sum|prometheus_remote_storage_shard_capacity|prometheus_remote_storage_shards|prometheus_remote_storage_succeeded_samples_total|prometheus_rule_evaluation_duration_seconds|prometheus_rule_evaluation_duration_seconds_count|prometheus_rule_evaluation_duration_seconds_sum|prometheus_rule_evaluation_failures_total|prometheus_rule_evaluations_total|prometheus_rule_group_duration_seconds|prometheus_rule_group_duration_seconds_count|prometheus_rule_group_duration_seconds_sum|prometheus_rule_group_interval_seconds|prometheus_rule_group_iterations_missed_total|prometheus_rule_group_iterations_total|prometheus_rule_group_last_duration_seconds|prometheus_rule_group_last_evaluation_timestamp_seconds|prometheus_rule_group_rules|prometheus_sd_consul_rpc_duration_seconds_count|prometheus_sd_consul_rpc_duration_seconds_sum|prometheus_sd_consul_rpc_failures_total|prometheus_sd_discovered_targets|prometheus_sd_dns_lookup_failures_total|prometheus_sd_dns_lookups_total|prometheus_sd_file_read_errors_total|prometheus_sd_file_scan_duration_seconds_count|prometheus_sd_file_scan_duration_seconds_sum|prometheus_sd_kubernetes_cache_last_resource_version|prometheus_sd_kubernetes_cache_list_duration_seconds_count|prometheus_sd_kubernetes_cache_list_duration_seconds_sum|prometheus_sd_kubernetes_cache_list_items_count|prometheus_sd_kubernetes_cache_list_items_sum|prometheus_sd_kubernetes_cache_list_total|prometheus_sd_kubernetes_cache_short_watches_total|prometheus_sd_kubernetes_cache_watch_duration_seconds_count|prometheus_sd_kubernetes_cache_watch_duration_seconds_sum|prometheus_sd_kubernetes_cache_watch_events_count|prometheus_sd_kubernetes_cache_watch_events_sum|prometheus_sd_kubernetes_cache_watches_total|prometheus_sd_kubernetes_events_total|prometheus_sd_kubernetes_http_request_duration_seconds_count|prometheus_sd_kubernetes_http_request_duration_seconds_sum|prometheus_sd_kubernetes_http_request_total|prometheus_sd_kubernetes_workqueue_depth|prometheus_sd_kubernetes_workqueue_items_total|prometheus_sd_kubernetes_workqueue_latency_seconds_count|prometheus_sd_kubernetes_workqueue_latency_seconds_sum|prometheus_sd_kubernetes_workqueue_longest_running_processor_seconds|prometheus_sd_kubernetes_workqueue_unfinished_work_seconds|prometheus_sd_kubernetes_workqueue_work_duration_seconds_count|prometheus_sd_kubernetes_workqueue_work_duration_seconds_sum|prometheus_sd_received_updates_total|prometheus_sd_updates_total|prometheus_target_interval_length_seconds|prometheus_target_interval_length_seconds_count|prometheus_target_interval_length_seconds_sum|prometheus_target_scrape_pool_reloads_failed_total|prometheus_target_scrape_pool_reloads_total|prometheus_target_scrape_pool_sync_total|prometheus_target_scrape_pools_failed_total|prometheus_target_scrape_pools_total|prometheus_target_scrapes_cache_flush_forced_total|prometheus_target_scrapes_exceeded_sample_limit_total|prometheus_target_scrapes_sample_duplicate_timestamp_total|prometheus_target_scrapes_sample_out_of_bounds_total|prometheus_target_scrapes_sample_out_of_order_total|prometheus_target_sync_length_seconds|prometheus_target_sync_length_seconds_count|prometheus_target_sync_length_seconds_sum|prometheus_template_text_expansion_failures_total|prometheus_template_text_expansions_total|prometheus_treecache_watcher_goroutines|prometheus_treecache_zookeeper_failures_total|prometheus_tsdb_blocks_loaded|prometheus_tsdb_checkpoint_creations_failed_total|prometheus_tsdb_checkpoint_creations_total|prometheus_tsdb_checkpoint_deletions_failed_total|prometheus_tsdb_checkpoint_deletions_total|prometheus_tsdb_compaction_chunk_range_seconds_bucket|prometheus_tsdb_compaction_chunk_range_seconds_count|prometheus_tsdb_compaction_chunk_range_seconds_sum|prometheus_tsdb_compaction_chunk_samples_bucket|prometheus_tsdb_compaction_chunk_samples_count|prometheus_tsdb_compaction_chunk_samples_sum|prometheus_tsdb_compaction_chunk_size_bytes_bucket|prometheus_tsdb_compaction_chunk_size_bytes_count|prometheus_tsdb_compaction_chunk_size_bytes_sum|prometheus_tsdb_compaction_duration_seconds_bucket|prometheus_tsdb_compaction_duration_seconds_count|prometheus_tsdb_compaction_duration_seconds_sum|prometheus_tsdb_compaction_populating_block|prometheus_tsdb_compactions_failed_total|prometheus_tsdb_compactions_total|prometheus_tsdb_compactions_triggered_total|prometheus_tsdb_head_active_appenders|prometheus_tsdb_head_chunks|prometheus_tsdb_head_chunks_created_total|prometheus_tsdb_head_chunks_removed_total|prometheus_tsdb_head_gc_duration_seconds_count|prometheus_tsdb_head_gc_duration_seconds_sum|prometheus_tsdb_head_max_time|prometheus_tsdb_head_max_time_seconds|prometheus_tsdb_head_min_time|prometheus_tsdb_head_min_time_seconds|prometheus_tsdb_head_samples_appended_total|prometheus_tsdb_head_series|prometheus_tsdb_head_series_created_total|prometheus_tsdb_head_series_not_found_total|prometheus_tsdb_head_series_removed_total|prometheus_tsdb_head_truncations_failed_total|prometheus_tsdb_head_truncations_total|prometheus_tsdb_lowest_timestamp|prometheus_tsdb_lowest_timestamp_seconds|prometheus_tsdb_reloads_failures_total|prometheus_tsdb_reloads_total|prometheus_tsdb_size_retentions_total|prometheus_tsdb_storage_blocks_bytes|prometheus_tsdb_symbol_table_size_bytes|prometheus_tsdb_time_retentions_total|prometheus_tsdb_tombstone_cleanup_seconds_bucket|prometheus_tsdb_tombstone_cleanup_seconds_count|prometheus_tsdb_tombstone_cleanup_seconds_sum|prometheus_tsdb_vertical_compactions_total|prometheus_tsdb_wal_completed_pages_total|prometheus_tsdb_wal_corruptions_total|prometheus_tsdb_wal_fsync_duration_seconds_count|prometheus_tsdb_wal_fsync_duration_seconds_sum|prometheus_tsdb_wal_page_flushes_total|prometheus_tsdb_wal_truncate_duration_seconds_count|prometheus_tsdb_wal_truncate_duration_seconds_sum|prometheus_tsdb_wal_truncations_failed_total|prometheus_tsdb_wal_truncations_total|prometheus_wal_watcher_current_segment|prometheus_wal_watcher_record_decode_failures_total|prometheus_wal_watcher_records_read_total|prometheus_wal_watcher_samples_sent_pre_tailing_total|reflector_items_per_list_count|reflector_items_per_list_sum|reflector_items_per_watch|reflector_items_per_watch_count|reflector_items_per_watch_sum|reflector_last_resource_version|reflector_list_duration_seconds_count|reflector_list_duration_seconds_sum|reflector_lists_total|reflector_short_watches_total|reflector_watch_duration_seconds|reflector_watch_duration_seconds_count|reflector_watch_duration_seconds_sum|reflector_watches_total|rest_client_request_latency_seconds_bucket|rest_client_request_latency_seconds_count|rest_client_request_latency_seconds_sum|ssh_tunnel_open_count|ssh_tunnel_open_fail_count|storage_operation_duration_seconds_bucket|storage_operation_duration_seconds_count|storage_operation_duration_seconds_sum|storage_operation_errors_total|volume_manager_total_volumesapiserver_current_inflight_requests sourceLabels: - __name__ ### The URL format is https://{project}.{sls-endpoint}/prometheus/{project}/{metricstore}/api/v1/write ### {sls-endpoint} is the endpoint for Simple Log Service. For more information, see Endpoints. ### Replace {project} and {metricstore} with the names of your Simple Log Service project and MetricStore. url: https://sls-prometheus-test.cn-beijing.log.aliyuncs.com/prometheus/sls-prometheus-test/prometheus-raw/api/v1/write
Acessar dados do Prometheus no Grafana
Faça login no Grafana.
No painel de navegação à esquerda, clique em
 > Data Sources.
Na aba Data Sources, clique em Add data source.
Na seção Prometheus, clique em Select.
-
Na aba Settings, configure os seguintes parâmetros.
Parâmetro
Descrição
Name
Insira um nome para a fonte de dados, como
Prometheus-01.HTTP
-
URL: A URL do seu MetricStore do Simple Log Service no formato
https://{project}.{sls-endpoint}/prometheus/{project}/{metricstore}. Substitua {sls-endpoint} pelo endpoint do Simple Log Service (para mais informações, consulte Endpoints) e substitua {project} e {metricstore} pelos nomes do seu projeto e MetricStore. Exemplo:https://sls-prometheus-test.cn-hangzhou.log.aliyuncs.com/prometheus/sls-prometheus-test/prometheus.Importante-
Se você estiver na rede interna da Alibaba Cloud, utilize o endpoint interno.
-
Para garantir a segurança dos dados, é obrigatório usar HTTPS.
-
-
Whitelisted Cookies: Adicione cookies à lista de permissões. Este parâmetro é opcional.
Auth
Ative Basic auth.
Basic Auth Details
-
User: O AccessKey ID do seu usuário RAM.
-
Password: O AccessKey Secret do seu usuário RAM.
Utilize o par de AccessKeys de um usuário RAM com permissões somente de leitura no projeto do Simple Log Service. Para mais informações, consulte Conceder permissões somente de leitura em um projeto específico.
-
-
Clique em Save & Test.
Após concluir a configuração, visualize seus dados em um painel do Grafana.