Após usar o Managed Service for OpenTelemetry da Alibaba Cloud para instrumentar um aplicativo e relatar os dados de rastreamento ao Managed Service for OpenTelemetry, o monitoramento do aplicativo é iniciado. Você pode visualizar dados como topologia do aplicativo, traces, transações anômalas, transações lentas e análise de SQL. Este tópico descreve como usar o Managed Service for OpenTelemetry para instrumentar um aplicativo Swift e relatar seus dados de rastreamento.
Antes de começar
Faça login no console do Managed Service for OpenTelemetry.
No painel de navegação à esquerda, clique em Cluster Configurations. Na página exibida, clique em a aba Access point information.
Na barra de navegação superior, selecione uma região. Na seção Cluster Information, ative a opção Show Token.
-
Defina o parâmetro Client como OpenTelemetry.
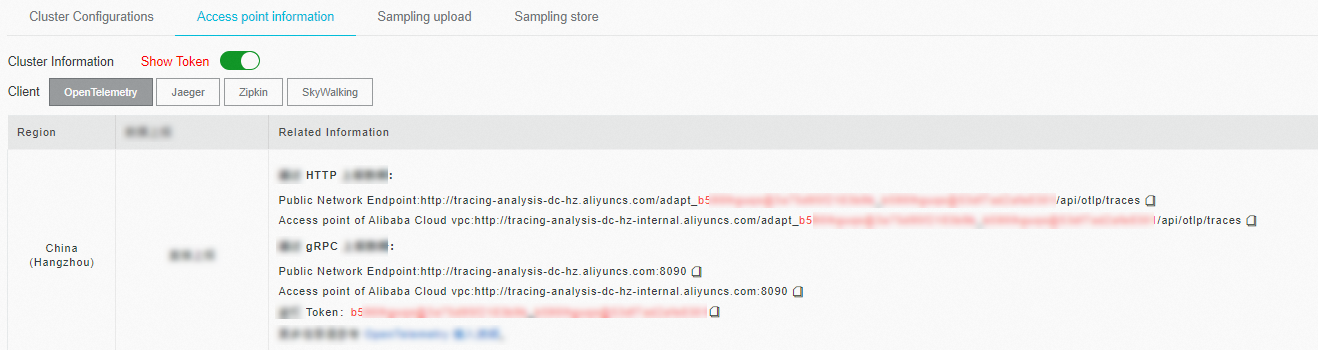
Obtenha o endpoint do Managed Service for OpenTelemetry na coluna Related Information da tabela na parte inferior.
 Nota
NotaSe o seu aplicativo estiver implantado em um ambiente de produção da Alibaba Cloud, utilize o endpoint da Virtual Private Cloud (VPC). Caso contrário, use o endpoint público.
Código de exemplo
Neste exemplo, o Managed Service for OpenTelemetry relata os dados de rastreamento de um aplicativo de linha de comando macOS escrito em Swift. O método apresentado aqui também se aplica a aplicativos iOS.
Baixe o código de exemplo em opentelemetry-swift-demo.
Etapa 1: Crie um aplicativo e adicionar dependências
-
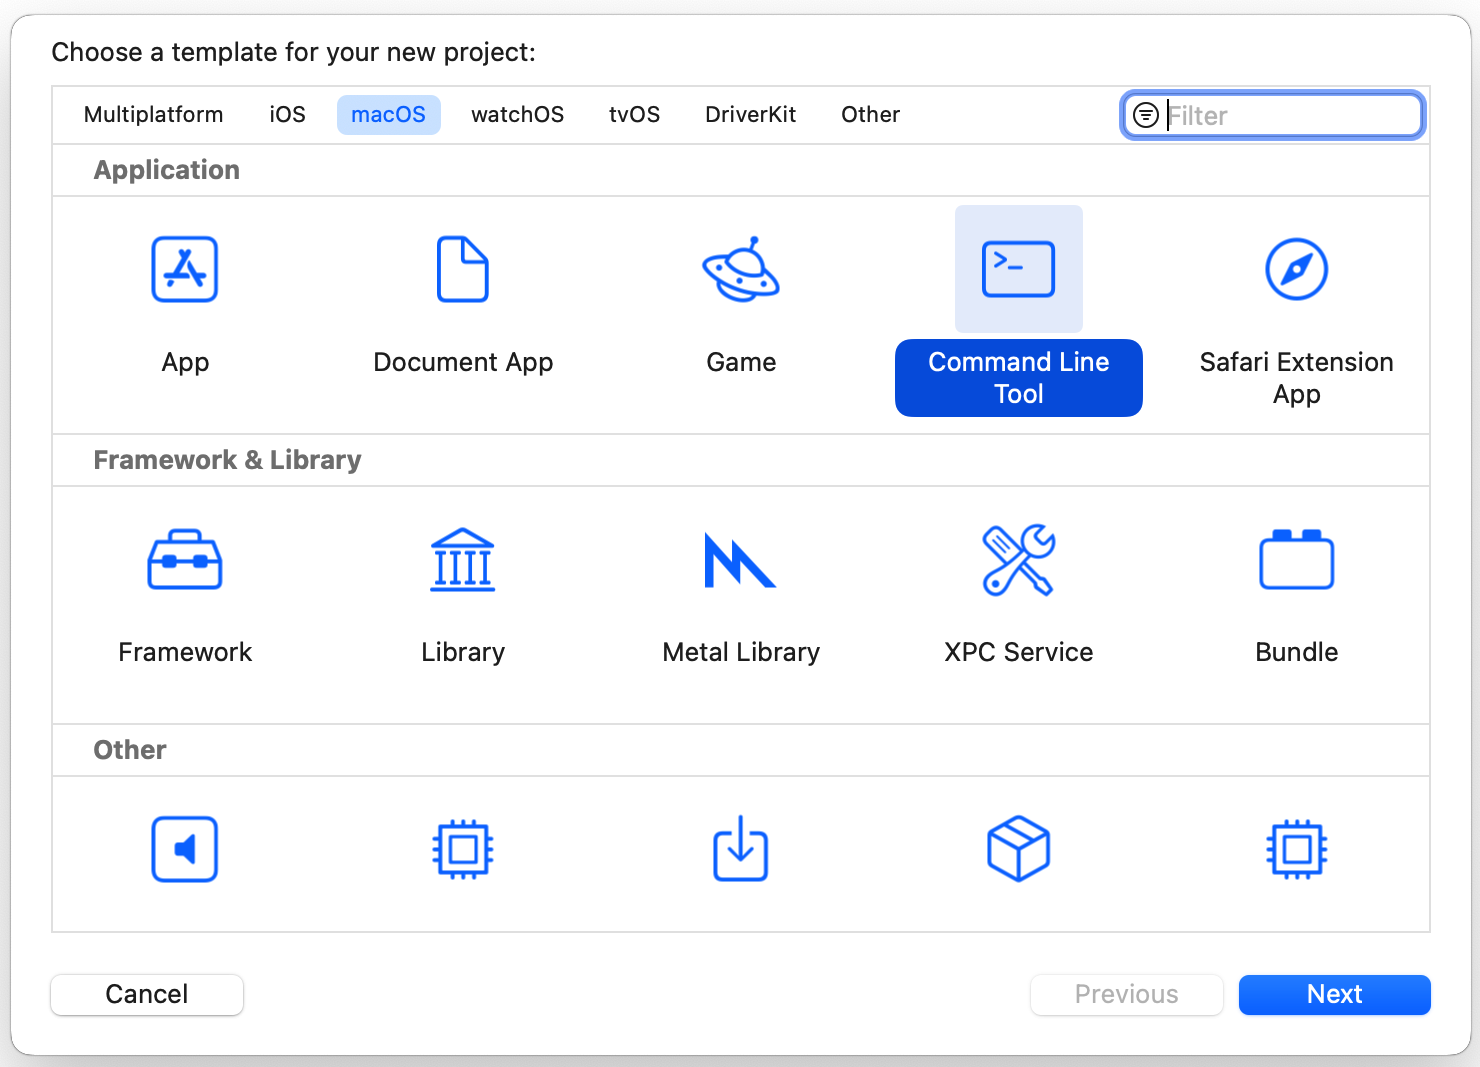
Selecione o tipo de aplicativo que deseja criar. Por exemplo, escolha macOS > Command Line Tool.
-
No XCode, escolha , insira
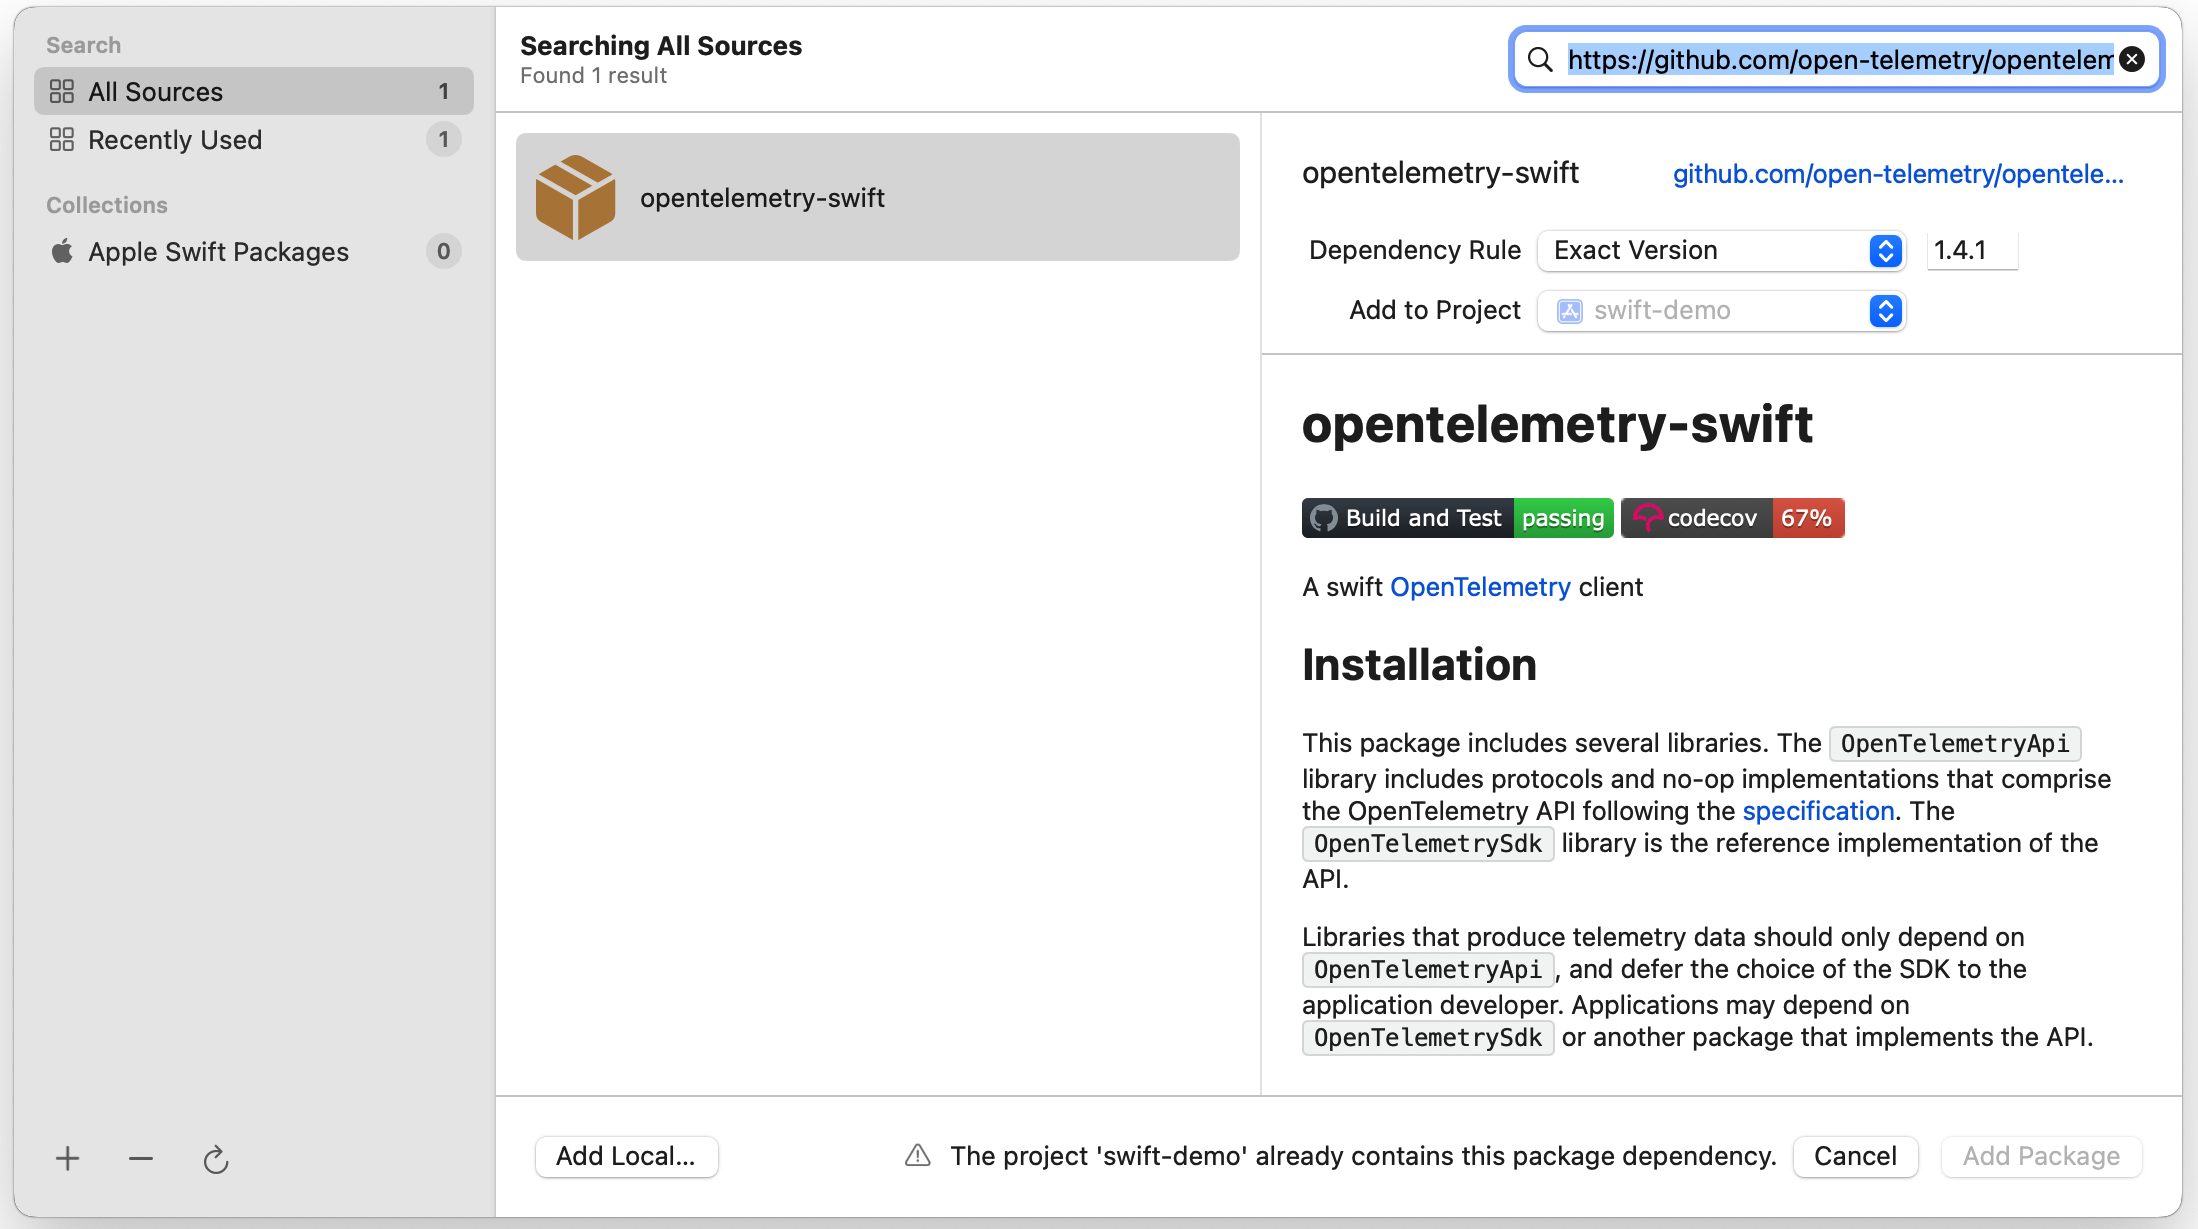
https://github.com/open-telemetry/opentelemetry-swiftna caixa de pesquisa e selecione a versão 1.4.1.NotaPara mais informações sobre as versões, visite a página do opentelemetry-swift no GitHub.
-
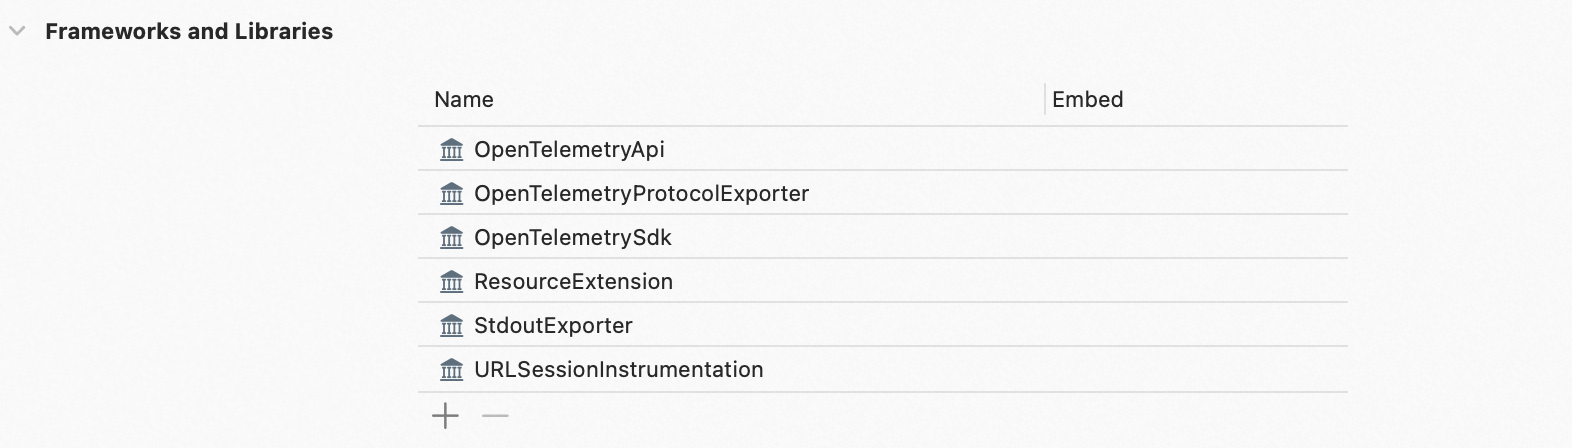
Selecione os pacotes necessários.
A figura a seguir mostra os pacotes utilizados neste exemplo.
Etapa 2: Inicializar o OpenTelemetry
-
Crie um exporter para exportar os dados de monitoramento.
Escolha um dos métodos a seguir para relatar os dados de rastreamento:
-
Método 1: Relatar dados de rastreamento usando o protocolo gRPC
Substitua
<gRPC-endpoint>e<gRPC-port>pelo endpoint e número de porta obtidos na seção "Antes de começar" deste tópico. Neste exemplo, utiliza-sehost: "http://tracing-analysis-dc-hz.aliyuncs.com", port:8090.Substitua
<your-token>pelo token de autenticação obtido na seção "Antes de começar" deste tópico.
let grpcChannel = ClientConnection( configuration: ClientConnection.Configuration.default( target: .hostAndPort("<gRPC-endpoint>", 8090), // Specify the endpoint that does not contain the http:// prefix. In this example, tracing-analysis-dc-hz.aliyuncs.com is used. eventLoopGroup: MultiThreadedEventLoopGroup(numberOfThreads: 1) ) ) let otlpGrpcConfiguration = OtlpConfiguration( timeout: OtlpConfiguration.DefaultTimeoutInterval, headers: [ ("Authentication","xxxxxx") ] ) let otlpGrpcTraceExporter = OtlpTraceExporter(channel: grpcChannel, config: otlpGrpcConfiguration) -
Método 2: Relatar dados de rastreamento usando o protocolo HTTP
Substitua
<HTTP-endpoint>pelo endpoint obtido na seção "Antes de começar" deste tópico. Neste exemplo, utiliza-sehttp://tracing-analysis-dc-hz.aliyuncs.com/adapt_xxxx@xxxx_xxxx@xxxx/api/otlp/traces.let url = URL(string: "<HTTP-endpoint>") let otlpHttpTraceExporter = OtlpHttpTraceExporter(endpoint: url!) -
Método 3: Obter dados de rastreamento na linha de comando
let consoleTraceExporter = StdoutExporter(isDebug: true)
-
-
Obtenha o tracer usado para criar um span.
Substitua
<your-service-name>pelo nome do aplicativo cujos dados você deseja relatar e<your-host-name>pelo nome do host.-
Substitua
<trace-exporter>por valores diferentes conforme o método escolhido para relatar os dados de rastreamento na Etapa 1.Método 1: Substitua
<trace-exporter>porotlpGrpcTraceExporter.Método 2: Substitua
<trace-exporter>porotlpHttpTraceExporter.Método 3: Substitua
<trace-exporter>porconsoleTraceExporter.
// Specify the application name and the hostname.
let resource = Resource(attributes: [
    ResourceAttributes.serviceName.rawValue: AttributeValue.string("<your-service-name>"),
    ResourceAttributes.hostName.rawValue: AttributeValue.string("<your-host-name>")
])

// Configure the TracerProvider.
OpenTelemetry.registerTracerProvider(tracerProvider: TracerProviderBuilder()
                                     .add(spanProcessor: BatchSpanProcessor(spanExporter: <trace-exporter>)) // Report data to Managed Service for OpenTelemetry.
                                     .with(resource: resource)
                                     .build())

// Obtain the tracer that is used to create a span.
let tracer = OpenTelemetry.instance.tracerProvider.get(instrumentationName: "instrumentation-library-name", instrumentationVersion: "1.0.0")
Etapa 3: Crie um span para rastrear dados de trace
-
Crie um span, configure atributos e um evento para ele e obtenha o ID de rastreamento do span.
let span = tracer.spanBuilder(spanName: "first span").startSpan() // Configure attributes. span.setAttribute(key: "http.method", value: "GET") span.setAttribute(key: "http.url", value: "www.aliyun.com") let attributes = [ "key": AttributeValue.string("value"), "result": AttributeValue.int(100) ] // your code... // Configure an event. span.addEvent(name: "computation complete", attributes: attributes) // Display the trace ID. print(span.context.traceId.hexString) // your code... // End the current span. span.end() -
Crie um span aninhado.
let parentSpan = tracer.spanBuilder(spanName: "parent span").startSpan() // your code... let childSpan = tracer.spanBuilder(spanName: "child span").setParent(parentSpan).startSpan() // your code... childSpan.end() // your code... parentSpan.end() -
Inicie o aplicativo.
Na página Applications do console do Managed Service for OpenTelemetry, clique em o nome do aplicativo. Na página exibida, visualize os dados de rastreamento.
Faça login no console do ARMS. No painel de navegação à esquerda, escolha . Na página Applications, clique em o nome do aplicativo. Na página exibida, visualize os dados de rastreamento.
NotaSe o ícone
 aparecer na coluna Language, o aplicativo está conectado ao Application Monitoring. Se um hífen (-) for exibido, o aplicativo está conectado ao Managed Service for OpenTelemetry.
Etapa 4: Conectar o aplicativo cliente e o aplicativo servidor
-
Altere o formato para transmitir dados de rastreamento no cabeçalho da solicitação HTTP.
Protocolos diferentes utilizam cabeçalhos de solicitação HTTP distintos para passar o contexto de rastreamento. Por exemplo, o OpenTelemetry usa o formato W3C Trace Context por padrão, mas suporta outros formatos, enquanto o Zipkin utiliza o formato B3 ou B3 Multi. Para mais detalhes, consulte Configurar formatos de propagação de contexto de rastreamento.
-
Configure o formato de transmissão de dados de rastreamento do aplicativo cliente com base no protocolo utilizado pelo aplicativo servidor. Dessa forma, o aplicativo cliente iOS e o aplicativo servidor poderão se comunicar.
Caso o aplicativo servidor utilize o formato W3C Trace Context do OpenTelemetry, não é necessário especificar os parâmetros textPropagators e baggagePropagator para o aplicativo cliente.
-
Se o aplicativo servidor usar o formato B3 ou B3 Multi do Zipkin, defina o parâmetro textPropagators como B3Propagator e o parâmetro baggagePropagator como ZipkinBaggagePropagator no aplicativo cliente.
// Specify the B3 format to pass trace data. OpenTelemetry.registerPropagators(textPropagators: [B3Propagator()], baggagePropagator: ZipkinBaggagePropagator()) -
Quando o aplicativo servidor utilizar o protocolo Jaeger, será necessário definir o parâmetro textPropagators como JaegerPropagator e o parâmetro baggagePropagator como JaegerBaggagePropagator no aplicativo cliente.
// Specify the Jaeger format to pass trace data. OpenTelemetry.registerPropagators(textPropagators: [JaegerPropagator()], baggagePropagator: JaegerBaggagePropagator()) -
Também é possível especificar múltiplos formatos para a transmissão dos dados de rastreamento.
// Specify the W3C Trace Context, B3, and Jaeger formats to pass trace data.
OpenTelemetry.registerPropagators(textPropagators: [W3CTraceContextPropagator(),
                                                    B3Propagator(),
                                                    JaegerPropagator()],
                                  baggagePropagator: W3CBaggagePropagator())
-
Importe o plug-in URLSessionInstrumentation.
O URLSessionInstrumentation é um plug-in de instrumentação automática fornecido pelo OpenTelemetry para a classe URLSession. Ele intercepta automaticamente todas as solicitações de rede enviadas pela classe URLSession e cria traces.
import URLSessionInstrumentation ... let networkInstrumentation = URLSessionInstrumentation(configuration: URLSessionInstrumentationConfiguration()) -
Utilize a classe URLSession para enviar uma solicitação de acesso ao aplicativo servidor.
let url = URL(string: "<Server address>")! let request = URLRequest(url: url) let semaphore = DispatchSemaphore(value: 0) let task = URLSession.shared.dataTask(with: request) { data, _, _ in if let data = data { let string = String(decoding: data, as: UTF8.self) print(string) } semaphore.signal() } task.resume() semaphore.wait() -
Inicie o aplicativo e visualize o rastreamento entre o aplicativo cliente e o servidor na página Trace Explorer.
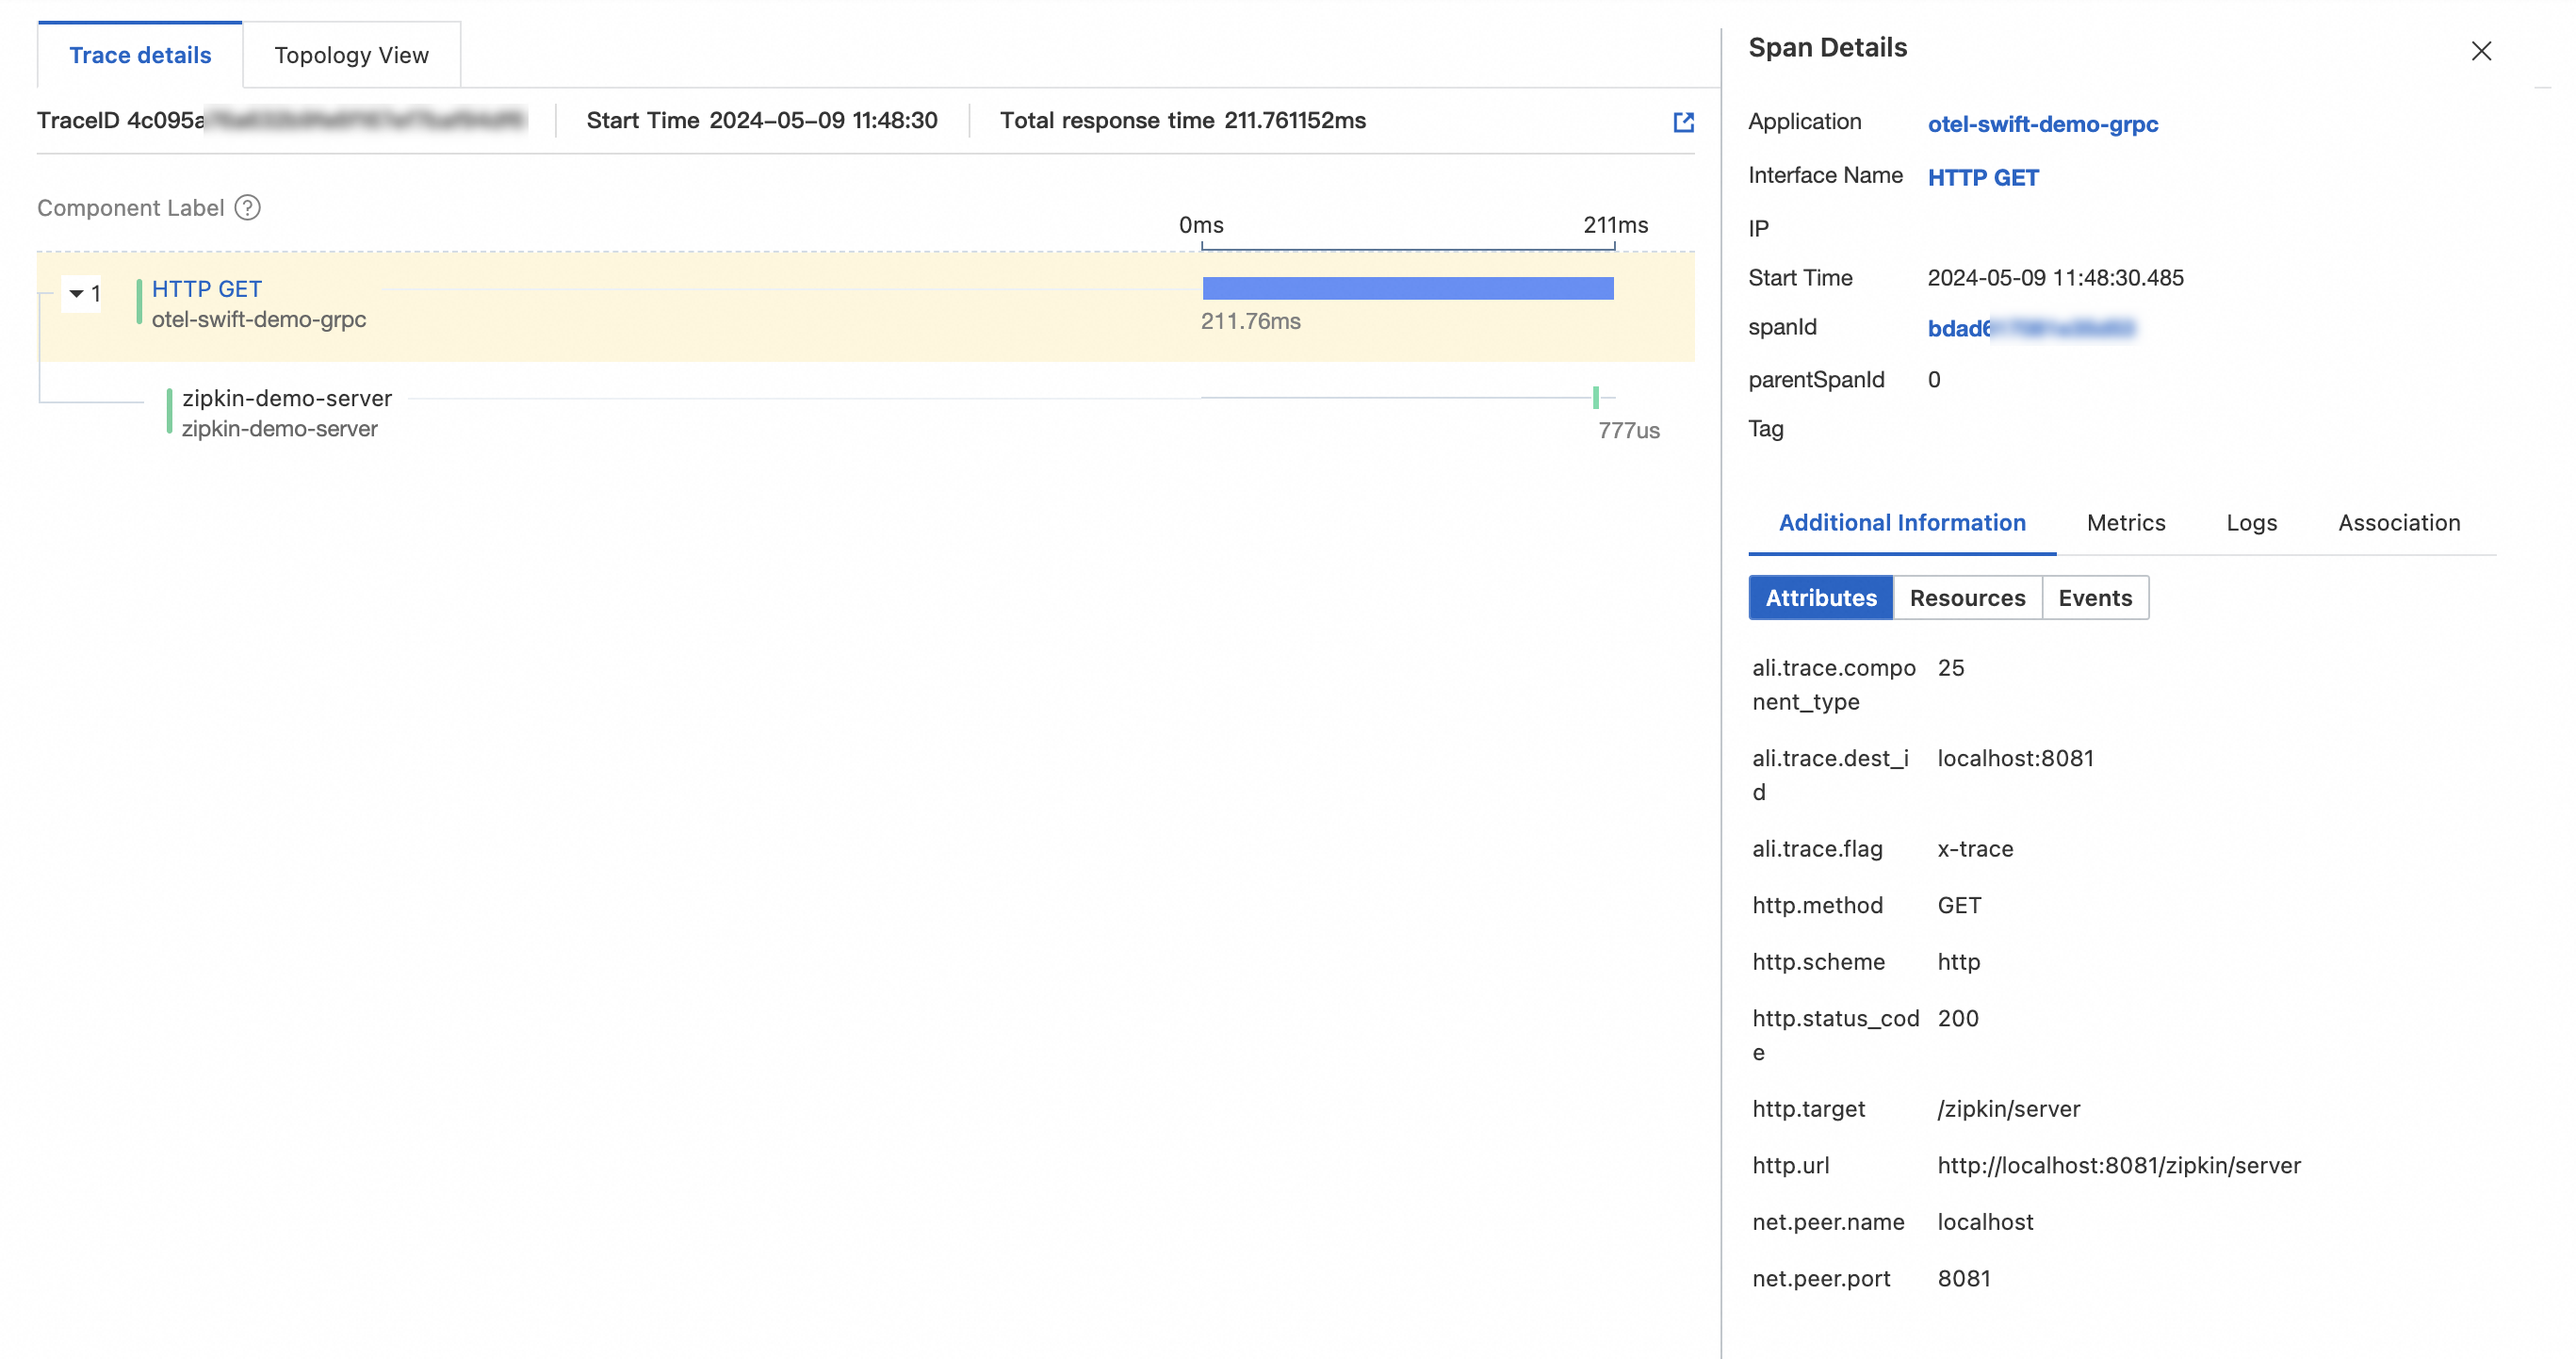
A figura a seguir mostra um exemplo. Nele,
HTTP GETrepresenta um aplicativo iOS ezipkin-demo-serveré o aplicativo servidor.