Todos os produtos
Search
Central de documentação

Alibaba Cloud Service Mesh:Use ConcurrencySchedulingPolicy para implementar agendamento de requisições baseado em prioridade com concorrência controlada

Última atualização: Jun 28, 2026

A ConcurrencySchedulingPolicy, fornecida pelo conjunto de agendamento de tráfego, permite agendar requisições por prioridade sob concorrência controlada.

Informações de fundo

A ConcurrencySchedulingPolicy determina se há sobrecarga de tráfego com base nos limites de requisições simultâneas. Quando o número de requisições simultâneas excede o limite superior especificado, as requisições subsequentes entram em fila e são agendadas conforme suas prioridades. O fluxo geral é o seguinte:

  • Um limitador de concorrência registra o número de requisições em andamento e verifica se o limite superior de concorrência foi atingido.

  • Ao atingir o limite superior de concorrência, as requisições seguintes são enfileiradas e encaminhadas ao serviço de destino à medida que as anteriores são concluídas. Requisições de alta prioridade saem da fila primeiro, garantindo atendimento antes das de menor prioridade.

Diferentemente da ConcurrencyLimitingPolicy, que rejeita requisições ao alcançar o limiar, a ConcurrencySchedulingPolicy coloca o excesso de requisições em uma fila de prioridades em vez de descartá-las. Em seguida, o sistema agenda essas requisições por prioridade, mantendo o volume de requisições simultâneas dentro do limite superior estabelecido.

Pré-requisitos

Etapa 1: Crie ConcurrencySchedulingPolicy

  1. Use kubectl para conectar-se à sua instância ASM. Para mais informações, consulte Acessar recursos Istio com kubectl.

  2. Crie um arquivo concurrencyschedulingpoilcy.yaml com o seguinte conteúdo:

    apiVersion: istio.alibabacloud.com/v1
    kind: ConcurrencySchedulingPolicy
    metadata:
      name: concurrencyscheduling
      namespace: istio-system
    spec:
      concurrency_scheduler:
        max_concurrency: 10
        concurrency_limiter:
          max_inflight_duration: 60s
        scheduler:
          workloads:
            - label_matcher:
                match_labels:
                  http.request.header.user_type: guest
              parameters:
                priority: 50.0
              name: guest
            - label_matcher:
                match_labels:
                  http.request.header.user_type: subscriber
              parameters:
                priority: 200.0
              name: subscriber
        selectors:
        - service: httpbin.default.svc.cluster.local

    A tabela a seguir descreve alguns parâmetros. Para obter mais detalhes sobre os itens de configuração, consulte Campos da ConcurrencySchedulingPolicy.

    Campo

    Descrição

    max_concurrency

    Número máximo de requisições simultâneas. Neste exemplo, o campo está definido como 10, indicando que o serviço pode processar 10 requisições por vez.

    max_inflight_duration

    Tempo limite para processamento de requisições. Devido a eventos inesperados, como reinicialização de pods no cluster, o conjunto de agendamento de tráfego ASM pode falhar ao registrar eventos de término de requisição. Para evitar que tais requisições afetem o julgamento do algoritmo de limitação de concorrência, especifique o tempo limite de processamento. Caso as requisições não recebam resposta antes desse período, o sistema considera que foram processadas. Defina este campo avaliando o tempo máximo esperado de resposta de uma requisição. Neste exemplo, o valor é 60s.

    workloads

    Dois tipos de requisição são definidos com base no user_type nos cabeçalhos: guest e subscriber. A prioridade de uma requisição do tipo guest é 50, enquanto a do tipo subscriber é 200.

    selectors

    Serviços aos quais a política de limitação se aplica. Neste exemplo, usa-se service: httpbin.default.svc.cluster.local, indicando que a política de limitação de concorrência afeta o serviço httpbin.default.svc.cluster.local.

  3. Execute o comando abaixo para criar a ConcurrencySchedulingPolicy:

    kubectl apply -f concurrencyschedulingpoilcy.yaml

Etapa 2: Verifique o resultado do agendamento de requisições baseado em prioridade em cenários de concorrência controlada

Este exemplo utiliza a ferramenta de teste de estresse Fortio. Para mais informações, veja a seção Installation do Fortio no GitHub.

  1. Abra dois terminais e execute simultaneamente os comandos de teste de estresse a seguir. Durante todo o processo, garanta que ambos os terminais funcionem corretamente. Nos testes dos dois terminais, 10 requisições simultâneas são enviadas ao serviço com um QPS (consultas por segundo) de 10.000, valor que supera significativamente a capacidade de requisições simultâneas suportada pelo serviço.

    fortio load -c 10 -qps 10000  -H "user_type:guest" -t 30s -timeout 60s -a http://${IP address of the ASM ingress gateway}/status/201
    fortio load -c 10 -qps 10000  -H "user_type:subscriber" -t 30s -timeout 60s -a http://${IP address of the ASM ingress gateway}/status/202
    Nota

    Substitua ${IP address of the ASM gateway} nos comandos acima pelo endereço IP do seu gateway de entrada ASM. Para saber como obter esse endereço, consulte a subetapa 1 da Etapa 3 no tópico Roteamento de tráfego baseado em versão com Istio.

    Saída esperada do teste 1:

    ...
    # target 50% 4.35294
    # target 75% 5.39689
    # target 90% 5.89697
    # target 99% 6.19701
    # target 99.9% 6.22702
    Sockets used: 10 (for perfect keepalive, would be 10)
    Uniform: false, Jitter: false
    Code 201 : 84 (100.0 %)
    Response Header Sizes : count 84 avg 249.88095 +/- 0.3587 min 248 max 250 sum 20990
    Response Body/Total Sizes : count 84 avg 249.88095 +/- 0.3587 min 248 max 250 sum 20990
    All done 84 calls (plus 10 warmup) 3802.559 ms avg, 2.6 qps
    Successfully wrote 5186 bytes of Json data to xxxxxx.json

    Anote o nome do arquivo JSON gerado pelo teste 1, por exemplo, xxxxxx.json.

    Saída esperada do teste 2:

    ...
    # target 50% 1.18121
    # target 75% 1.63423
    # target 90% 1.90604
    # target 99% 2.22941
    # target 99.9% 2.28353
    Sockets used: 10 (for perfect keepalive, would be 10)
    Uniform: false, Jitter: false
    Code 202 : 270 (100.0 %)
    Response Header Sizes : count 270 avg 250.52963 +/- 0.5418 min 249 max 251 sum 67643
    Response Body/Total Sizes : count 270 avg 250.52963 +/- 0.5418 min 249 max 251 sum 67643
    All done 270 calls (plus 10 warmup) 1117.614 ms avg, 8.8 qps
    Successfully wrote 5305 bytes of Json data to yyyyyy.json

    Anote o nome do arquivo JSON gerado pelo teste 2, por exemplo, yyyyyy.json.

    As saídas acima mostram que a latência média das requisições do teste 2 corresponde a aproximadamente 1/4 da latência do teste 1, enquanto o QPS é cerca de quatro vezes maior. Isso ocorre porque, na política definida anteriormente, a prioridade das requisições do tipo subscriber é quatro vezes superior à das requisições do tipo guest.

  2. (Opcional) Visualize os resultados graficamente.

    1. No diretório local onde você executou os dois comandos na etapa anterior, execute o comando a seguir para iniciar o servidor Fortio local:

      fortio server
    2. Acesse http://localhost:8080/fortio/browse em um navegador e clique em no nome do arquivo JSON correspondente anotado na subetapa 1 para visualizar os resultados do teste.

      Exemplo de resultados visuais do teste 1:

      image

      Exemplo de resultados visuais do teste 2:

      image

      Os resultados visuais indicam que, exceto por algumas requisições sem restrição, a maioria das requisições do tipo guest apresenta latência entre 4.000 e 6.000 ms. Por outro lado, grande parte das requisições do tipo subscriber tem latência entre 1.000 e 2.000 ms. Quando as requisições ao serviço ultrapassam o limite superior, as do tipo subscriber recebem resposta prioritariamente. Além disso, as requisições simultâneas enviadas ao serviço permanecem limitadas a um valor específico.

Referências

Para verificar se a ConcurrencySchedulingPolicy entrou em vigor, utilize o Grafana. Certifique-se de que a instância Prometheus do Grafana esteja configurada com o conjunto de agendamento de tráfego ASM.

Importe o conteúdo abaixo no Grafana para criar um painel para a ConcurrencySchedulingPolicy.

Clique em para ver detalhes

{
  "annotations": {
    "list": [
      {
        "builtIn": 1,
        "datasource": {
          "type": "grafana",
          "uid": "-- Grafana --"
        },
        "enable": true,
        "hide": true,
        "iconColor": "rgba(0, 211, 255, 1)",
        "name": "Annotations & Alerts",
        "type": "dashboard"
      }
    ]
  },
  "editable": true,
  "fiscalYearStartMonth": 0,
  "graphTooltip": 0,
  "id": 42,
  "links": [],
  "liveNow": false,
  "panels": [
    {
      "datasource": {
        "type": "prometheus",
        "uid": "${datasource}"
      },
      "description": "Signal derived from periodic execution of query: (sum(rate(workload_requests_total{policy_name=\"concurrencyscheduling\",component_id=\"root.0\",decision_type=\"DECISION_TYPE_ACCEPTED\"}[30s])) / sum(rate(workload_requests_total{policy_name=\"concurrencyscheduling\",component_id=\"root.0\"}[30s]))) * 100",
      "fieldConfig": {
        "defaults": {
          "color": {
            "mode": "palette-classic"
          },
          "custom": {
            "axisCenteredZero": false,
            "axisColorMode": "text",
            "axisLabel": "",
            "axisPlacement": "auto",
            "barAlignment": 0,
            "drawStyle": "line",
            "fillOpacity": 10,
            "gradientMode": "none",
            "hideFrom": {
              "legend": false,
              "tooltip": false,
              "viz": false
            },
            "lineInterpolation": "linear",
            "lineWidth": 1,
            "pointSize": 5,
            "scaleDistribution": {
              "type": "linear"
            },
            "showPoints": "auto",
            "spanNulls": false,
            "stacking": {
              "group": "A",
              "mode": "none"
            },
            "thresholdsStyle": {
              "mode": "off"
            }
          },
          "mappings": [],
          "thresholds": {
            "mode": "absolute",
            "steps": [
              {
                "color": "green",
                "value": null
              },
              {
                "color": "red",
                "value": 80
              }
            ]
          },
          "unit": ""
        },
        "overrides": []
      },
      "gridPos": {
        "h": 10,
        "w": 24,
        "x": 0,
        "y": 0
      },
      "id": 1,
      "interval": "10s",
      "options": {
        "legend": {
          "calcs": [],
          "displayMode": "list",
          "placement": "bottom",
          "showLegend": true
        },
        "tooltip": {
          "mode": "single",
          "sort": "none"
        }
      },
      "pluginVersion": "v10.1.0",
      "targets": [
        {
          "datasource": {
            "type": "prometheus",
            "uid": "${datasource}"
          },
          "editorMode": "code",
          "expr": "(sum by (policy_name)(rate(workload_requests_total{component_id=\"root.0\",decision_type=\"DECISION_TYPE_ACCEPTED\"}[30s])) / sum by (policy_name)(rate(workload_requests_total{component_id=\"root.0\"}[30s]))) * 100",
          "intervalFactor": 1,
          "legendFormat": "policy={{policy_name}}",
          "range": true,
          "refId": "A"
        }
      ],
      "title": "Accept Percentage",
      "type": "timeseries"
    },
    {
      "datasource": {
        "type": "prometheus",
        "uid": "${datasource}"
      },
      "description": "",
      "fieldConfig": {
        "defaults": {
          "color": {
            "mode": "palette-classic"
          },
          "custom": {
            "axisCenteredZero": false,
            "axisColorMode": "text",
            "axisLabel": "Decisions",
            "axisPlacement": "auto",
            "barAlignment": 0,
            "drawStyle": "line",
            "fillOpacity": 10,
            "gradientMode": "none",
            "hideFrom": {
              "legend": false,
              "tooltip": false,
              "viz": false
            },
            "lineInterpolation": "linear",
            "lineWidth": 1,
            "pointSize": 5,
            "scaleDistribution": {
              "type": "linear"
            },
            "showPoints": "auto",
            "spanNulls": false,
            "stacking": {
              "group": "A",
              "mode": "none"
            },
            "thresholdsStyle": {
              "mode": "off"
            }
          },
          "mappings": [],
          "thresholds": {
            "mode": "absolute",
            "steps": [
              {
                "color": "green",
                "value": null
              },
              {
                "color": "red",
                "value": 80
              }
            ]
          },
          "unit": "reqps"
        },
        "overrides": []
      },
      "gridPos": {
        "h": 10,
        "w": 24,
        "x": 0,
        "y": 10
      },
      "id": 2,
      "interval": "10s",
      "options": {
        "legend": {
          "calcs": [],
          "displayMode": "list",
          "placement": "bottom",
          "showLegend": true
        },
        "tooltip": {
          "mode": "single",
          "sort": "none"
        }
      },
      "pluginVersion": "v10.1.0",
      "targets": [
        {
          "datasource": {
            "type": "prometheus",
            "uid": "${datasource}"
          },
          "editorMode": "code",
          "expr": "sum by(decision_type, policy_name) (rate(workload_requests_total{component_id=\"root.0\"}[$__rate_interval]))",
          "intervalFactor": 1,
          "range": true,
          "refId": "A"
        }
      ],
      "title": "Workload Decisions",
      "type": "timeseries"
    },
    {
      "datasource": {
        "type": "prometheus",
        "uid": "${datasource}"
      },
      "description": "",
      "fieldConfig": {
        "defaults": {
          "color": {
            "mode": "palette-classic"
          },
          "custom": {
            "axisCenteredZero": false,
            "axisColorMode": "text",
            "axisLabel": "Decisions",
            "axisPlacement": "auto",
            "barAlignment": 0,
            "drawStyle": "line",
            "fillOpacity": 10,
            "gradientMode": "none",
            "hideFrom": {
              "legend": false,
              "tooltip": false,
              "viz": false
            },
            "lineInterpolation": "linear",
            "lineWidth": 1,
            "pointSize": 5,
            "scaleDistribution": {
              "type": "linear"
            },
            "showPoints": "auto",
            "spanNulls": false,
            "stacking": {
              "group": "A",
              "mode": "none"
            },
            "thresholdsStyle": {
              "mode": "off"
            }
          },
          "mappings": [],
          "thresholds": {
            "mode": "absolute",
            "steps": [
              {
                "color": "green",
                "value": null
              },
              {
                "color": "red",
                "value": 80
              }
            ]
          },
          "unit": "reqps"
        },
        "overrides": []
      },
      "gridPos": {
        "h": 10,
        "w": 24,
        "x": 0,
        "y": 20
      },
      "id": 3,
      "interval": "10s",
      "options": {
        "legend": {
          "calcs": [],
          "displayMode": "list",
          "placement": "bottom",
          "showLegend": true
        },
        "tooltip": {
          "mode": "single",
          "sort": "none"
        }
      },
      "pluginVersion": "v10.1.0",
      "targets": [
        {
          "datasource": {
            "type": "prometheus",
            "uid": "${datasource}"
          },
          "editorMode": "code",
          "expr": "sum by(workload_index, decision_type, policy_name) (rate(workload_requests_total{component_id=\"root.0\",decision_type=\"DECISION_TYPE_ACCEPTED\"}[$__rate_interval]))",
          "intervalFactor": 1,
          "range": true,
          "refId": "A"
        }
      ],
      "title": "Workload Decisions (accepted)",
      "type": "timeseries"
    },
    {
      "datasource": {
        "type": "prometheus",
        "uid": "${datasource}"
      },
      "description": "",
      "fieldConfig": {
        "defaults": {
          "color": {
            "mode": "palette-classic"
          },
          "custom": {
            "axisCenteredZero": false,
            "axisColorMode": "text",
            "axisLabel": "Decisions",
            "axisPlacement": "auto",
            "barAlignment": 0,
            "drawStyle": "line",
            "fillOpacity": 10,
            "gradientMode": "none",
            "hideFrom": {
              "legend": false,
              "tooltip": false,
              "viz": false
            },
            "lineInterpolation": "linear",
            "lineWidth": 1,
            "pointSize": 5,
            "scaleDistribution": {
              "type": "linear"
            },
            "showPoints": "auto",
            "spanNulls": false,
            "stacking": {
              "group": "A",
              "mode": "none"
            },
            "thresholdsStyle": {
              "mode": "off"
            }
          },
          "mappings": [],
          "thresholds": {
            "mode": "absolute",
            "steps": [
              {
                "color": "green",
                "value": null
              },
              {
                "color": "red",
                "value": 80
              }
            ]
          },
          "unit": "reqps"
        },
        "overrides": []
      },
      "gridPos": {
        "h": 10,
        "w": 24,
        "x": 0,
        "y": 30
      },
      "id": 4,
      "interval": "10s",
      "options": {
        "legend": {
          "calcs": [],
          "displayMode": "list",
          "placement": "bottom",
          "showLegend": true
        },
        "tooltip": {
          "mode": "single",
          "sort": "none"
        }
      },
      "pluginVersion": "v10.1.0",
      "targets": [
        {
          "datasource": {
            "type": "prometheus",
            "uid": "${datasource}"
          },
          "editorMode": "code",
          "expr": "sum by(workload_index, decision_type, policy_name) (rate(workload_requests_total{component_id=\"root.0\",decision_type=\"DECISION_TYPE_REJECTED\"}[$__rate_interval]))",
          "intervalFactor": 1,
          "range": true,
          "refId": "A"
        }
      ],
      "title": "Workload Decisions (rejected)",
      "type": "timeseries"
    },
    {
      "datasource": {
        "type": "prometheus",
        "uid": "${datasource}"
      },
      "fieldConfig": {
        "defaults": {
          "color": {
            "mode": "thresholds"
          },
          "mappings": [],
          "noValue": "No data",
          "thresholds": {
            "mode": "absolute",
            "steps": [
              {
                "color": "blue",
                "value": null
              }
            ]
          },
          "unit": "short"
        },
        "overrides": []
      },
      "gridPos": {
        "h": 10,
        "w": 8,
        "x": 0,
        "y": 40
      },
      "id": 5,
      "options": {
        "colorMode": "value",
        "graphMode": "area",
        "justifyMode": "center",
        "orientation": "horizontal",
        "reduceOptions": {
          "calcs": [
            "lastNotNull"
          ],
          "fields": "",
          "values": false
        },
        "textMode": "auto"
      },
      "pluginVersion": "10.0.9",
      "targets": [
        {
          "datasource": {
            "type": "prometheus",
            "uid": "${datasource}"
          },
          "editorMode": "code",
          "expr": "sum by (policy_name)(increase(workload_requests_total{component_id=\"root.0\"}[$__range]))",
          "instant": false,
          "intervalFactor": 1,
          "legendFormat": "{{ policy_name }}",
          "range": true,
          "refId": "A"
        }
      ],
      "title": "Total Requests",
      "type": "stat"
    },
    {
      "datasource": {
        "type": "prometheus",
        "uid": "${datasource}"
      },
      "fieldConfig": {
        "defaults": {
          "color": {
            "mode": "thresholds"
          },
          "mappings": [],
          "noValue": "No data",
          "thresholds": {
            "mode": "absolute",
            "steps": [
              {
                "color": "green",
                "value": null
              }
            ]
          },
          "unit": "short"
        },
        "overrides": []
      },
      "gridPos": {
        "h": 10,
        "w": 8,
        "x": 8,
        "y": 40
      },
      "id": 6,
      "options": {
        "colorMode": "value",
        "graphMode": "area",
        "justifyMode": "center",
        "orientation": "horizontal",
        "reduceOptions": {
          "calcs": [
            "lastNotNull"
          ],
          "fields": "",
          "values": false
        },
        "textMode": "auto"
      },
      "pluginVersion": "10.0.9",
      "targets": [
        {
          "datasource": {
            "type": "prometheus",
            "uid": "${datasource}"
          },
          "editorMode": "code",
          "expr": "sum by (policy_name)(increase(workload_requests_total{component_id=\"root.0\",decision_type=\"DECISION_TYPE_ACCEPTED\"}[$__range]))",
          "instant": false,
          "intervalFactor": 1,
          "legendFormat": "{{ policy_name }}",
          "range": true,
          "refId": "A"
        }
      ],
      "title": "Total Accepted Requests",
      "type": "stat"
    },
    {
      "datasource": {
        "type": "prometheus",
        "uid": "${datasource}"
      },
      "fieldConfig": {
        "defaults": {
          "color": {
            "mode": "thresholds"
          },
          "mappings": [],
          "noValue": "No rejected requests",
          "thresholds": {
            "mode": "absolute",
            "steps": [
              {
                "color": "red",
                "value": null
              }
            ]
          },
          "unit": "short"
        },
        "overrides": []
      },
      "gridPos": {
        "h": 10,
        "w": 8,
        "x": 16,
        "y": 40
      },
      "id": 7,
      "options": {
        "colorMode": "value",
        "graphMode": "area",
        "justifyMode": "center",
        "orientation": "horizontal",
        "reduceOptions": {
          "calcs": [
            "lastNotNull"
          ],
          "fields": "",
          "values": false
        },
        "textMode": "auto"
      },
      "pluginVersion": "10.0.9",
      "targets": [
        {
          "datasource": {
            "type": "prometheus",
            "uid": "${datasource}"
          },
          "editorMode": "code",
          "expr": "sum by (policy_name)(increase(workload_requests_total{component_id=\"root.0\",decision_type=\"DECISION_TYPE_REJECTED\"}[$__range]))",
          "instant": false,
          "intervalFactor": 1,
          "legendFormat": "{{ policy_name }}",
          "range": true,
          "refId": "A"
        }
      ],
      "title": "Total Rejected Requests",
      "type": "stat"
    },
    {
      "datasource": {
        "type": "prometheus",
        "uid": "${datasource}"
      },
      "description": "",
      "fieldConfig": {
        "defaults": {
          "color": {
            "mode": "palette-classic"
          },
          "custom": {
            "axisCenteredZero": false,
            "axisColorMode": "text",
            "axisLabel": "Latency",
            "axisPlacement": "auto",
            "barAlignment": 0,
            "drawStyle": "line",
            "fillOpacity": 10,
            "gradientMode": "none",
            "hideFrom": {
              "legend": false,
              "tooltip": false,
              "viz": false
            },
            "lineInterpolation": "linear",
            "lineWidth": 1,
            "pointSize": 5,
            "scaleDistribution": {
              "type": "linear"
            },
            "showPoints": "auto",
            "spanNulls": false,
            "stacking": {
              "group": "A",
              "mode": "none"
            },
            "thresholdsStyle": {
              "mode": "off"
            }
          },
          "mappings": [],
          "thresholds": {
            "mode": "absolute",
            "steps": [
              {
                "color": "green",
                "value": null
              },
              {
                "color": "red",
                "value": 80
              }
            ]
          },
          "unit": "ms"
        },
        "overrides": []
      },
      "gridPos": {
        "h": 10,
        "w": 24,
        "x": 0,
        "y": 50
      },
      "id": 8,
      "interval": "10s",
      "options": {
        "legend": {
          "calcs": [],
          "displayMode": "list",
          "placement": "bottom",
          "showLegend": true
        },
        "tooltip": {
          "mode": "single",
          "sort": "none"
        }
      },
      "pluginVersion": "v10.1.0",
      "targets": [
        {
          "datasource": {
            "type": "prometheus",
            "uid": "${datasource}"
          },
          "editorMode": "code",
          "expr": "(sum by (workload_index, policy_name) (increase(workload_latency_ms_sum{component_id=\"root.0\"}[$__rate_interval])))/(sum by (workload_index, policy_name) (increase(workload_latency_ms_count{component_id=\"root.0\"}[$__rate_interval])))",
          "intervalFactor": 1,
          "range": true,
          "refId": "A"
        }
      ],
      "title": "Workload Latency",
      "type": "timeseries"
    },
    {
      "datasource": {
        "type": "prometheus",
        "uid": "${datasource}"
      },
      "description": "",
      "fieldConfig": {
        "defaults": {
          "color": {
            "mode": "palette-classic"
          },
          "custom": {
            "axisCenteredZero": false,
            "axisColorMode": "text",
            "axisLabel": "Wait Time",
            "axisPlacement": "auto",
            "barAlignment": 0,
            "drawStyle": "line",
            "fillOpacity": 10,
            "gradientMode": "none",
            "hideFrom": {
              "legend": false,
              "tooltip": false,
              "viz": false
            },
            "lineInterpolation": "linear",
            "lineWidth": 1,
            "pointSize": 5,
            "scaleDistribution": {
              "type": "linear"
            },
            "showPoints": "auto",
            "spanNulls": false,
            "stacking": {
              "group": "A",
              "mode": "none"
            },
            "thresholdsStyle": {
              "mode": "off"
            }
          },
          "mappings": [],
          "thresholds": {
            "mode": "absolute",
            "steps": [
              {
                "color": "green",
                "value": null
              },
              {
                "color": "red",
                "value": 80
              }
            ]
          },
          "unit": "ms"
        },
        "overrides": []
      },
      "gridPos": {
        "h": 10,
        "w": 12,
        "x": 0,
        "y": 60
      },
      "id": 9,
      "interval": "10s",
      "options": {
        "legend": {
          "calcs": [],
          "displayMode": "list",
          "placement": "bottom",
          "showLegend": true
        },
        "tooltip": {
          "mode": "single",
          "sort": "none"
        }
      },
      "pluginVersion": "v10.1.0",
      "targets": [
        {
          "datasource": {
            "type": "prometheus",
            "uid": "${datasource}"
          },
          "editorMode": "code",
          "expr": "(sum by (workload_index, policy_name) (increase(request_in_queue_duration_ms_sum{component_id=\"root.0\"}[$__rate_interval])))/ ((sum by (workload_index, policy_name) (increase(request_in_queue_duration_ms_count{component_id=\"root.0\"}[$__rate_interval]))) != 0)",
          "intervalFactor": 1,
          "range": true,
          "refId": "A"
        }
      ],
      "title": "Request in Queue Duration",
      "type": "timeseries"
    },
    {
      "datasource": {
        "type": "prometheus",
        "uid": "${datasource}"
      },
      "fieldConfig": {
        "defaults": {
          "color": {
            "mode": "palette-classic"
          },
          "custom": {
            "axisCenteredZero": false,
            "axisColorMode": "text",
            "axisGridShow": true,
            "axisLabel": "",
            "axisPlacement": "hidden",
            "fillOpacity": 80,
            "gradientMode": "none",
            "hideFrom": {
              "legend": false,
              "tooltip": false,
              "viz": false
            },
            "lineWidth": 1,
            "scaleDistribution": {
              "type": "linear"
            },
            "thresholdsStyle": {
              "mode": "off"
            }
          },
          "mappings": [],
          "thresholds": {
            "mode": "absolute",
            "steps": [
              {
                "color": "green",
                "value": null
              },
              {
                "color": "red",
                "value": 80
              }
            ]
          },
          "unit": "ms"
        },
        "overrides": []
      },
      "gridPos": {
        "h": 10,
        "w": 12,
        "x": 12,
        "y": 60
      },
      "id": 10,
      "options": {
        "barRadius": 0,
        "barWidth": 0.97,
        "colorByField": "",
        "fullHighlight": false,
        "groupWidth": 0.7,
        "legend": {
          "calcs": [],
          "displayMode": "list",
          "placement": "bottom",
          "showLegend": true
        },
        "orientation": "horizontal",
        "showValue": "auto",
        "stacking": "none",
        "tooltip": {
          "mode": "single",
          "sort": "sort"
        },
        "xTickLabelRotation": 0,
        "xTickLabelSpacing": 0
      },
      "pluginVersion": "v10.1.0",
      "targets": [
        {
          "datasource": {
            "type": "prometheus",
            "uid": "${datasource}"
          },
          "editorMode": "code",
          "expr": "topk(10, (sum by(workload_index, policy_name) (increase(request_in_queue_duration_ms_sum{component_id=\"root.0\"}[$__range])) ) / ((sum by(workload_index, policy_name) (increase(request_in_queue_duration_ms_count{component_id=\"root.0\"}[$__range])) )) != 0)",
          "format": "time_series",
          "instant": true,
          "intervalFactor": 1,
          "legendFormat": "",
          "range": false,
          "refId": "A"
        }
      ],
      "title": "Request in Queue Duration",
      "type": "barchart"
    },
    {
      "datasource": {
        "type": "prometheus",
        "uid": "${datasource}"
      },
      "description": "",
      "fieldConfig": {
        "defaults": {
          "color": {
            "mode": "palette-classic"
          },
          "custom": {
            "axisCenteredZero": false,
            "axisColorMode": "text",
            "axisLabel": "Token Rate",
            "axisPlacement": "auto",
            "barAlignment": 0,
            "drawStyle": "line",
            "fillOpacity": 10,
            "gradientMode": "none",
            "hideFrom": {
              "legend": false,
              "tooltip": false,
              "viz": false
            },
            "lineInterpolation": "linear",
            "lineWidth": 1,
            "pointSize": 5,
            "scaleDistribution": {
              "type": "linear"
            },
            "showPoints": "auto",
            "spanNulls": false,
            "stacking": {
              "group": "A",
              "mode": "none"
            },
            "thresholdsStyle": {
              "mode": "off"
            }
          },
          "mappings": [],
          "thresholds": {
            "mode": "absolute",
            "steps": [
              {
                "color": "green",
                "value": null
              },
              {
                "color": "red",
                "value": 80
              }
            ]
          },
          "unit": ""
        },
        "overrides": []
      },
      "gridPos": {
        "h": 8,
        "w": 12,
        "x": 0,
        "y": 70
      },
      "id": 13,
      "interval": "10s",
      "options": {
        "legend": {
          "calcs": [],
          "displayMode": "list",
          "placement": "bottom",
          "showLegend": true
        },
        "tooltip": {
          "mode": "single",
          "sort": "none"
        }
      },
      "pluginVersion": "v10.1.0",
      "targets": [
        {
          "datasource": {
            "type": "prometheus",
            "uid": "${datasource}"
          },
          "editorMode": "code",
          "expr": "sum by (policy_name)(rate(incoming_tokens_total{component_id=\"root.0\"}[$__rate_interval]))",
          "intervalFactor": 1,
          "range": true,
          "refId": "A"
        }
      ],
      "title": "Incoming Token Rate",
      "type": "timeseries"
    },
    {
      "datasource": {
        "type": "prometheus",
        "uid": "${datasource}"
      },
      "description": "",
      "fieldConfig": {
        "defaults": {
          "color": {
            "mode": "palette-classic"
          },
          "custom": {
            "axisCenteredZero": false,
            "axisColorMode": "text",
            "axisLabel": "Token Rate",
            "axisPlacement": "auto",
            "barAlignment": 0,
            "drawStyle": "line",
            "fillOpacity": 10,
            "gradientMode": "none",
            "hideFrom": {
              "legend": false,
              "tooltip": false,
              "viz": false
            },
            "lineInterpolation": "linear",
            "lineWidth": 1,
            "pointSize": 5,
            "scaleDistribution": {
              "type": "linear"
            },
            "showPoints": "auto",
            "spanNulls": false,
            "stacking": {
              "group": "A",
              "mode": "none"
            },
            "thresholdsStyle": {
              "mode": "off"
            }
          },
          "mappings": [],
          "thresholds": {
            "mode": "absolute",
            "steps": [
              {
                "color": "green",
                "value": null
              },
              {
                "color": "red",
                "value": 80
              }
            ]
          },
          "unit": ""
        },
        "overrides": []
      },
      "gridPos": {
        "h": 8,
        "w": 12,
        "x": 12,
        "y": 70
      },
      "id": 14,
      "interval": "10s",
      "options": {
        "legend": {
          "calcs": [],
          "displayMode": "list",
          "placement": "bottom",
          "showLegend": true
        },
        "tooltip": {
          "mode": "single",
          "sort": "none"
        }
      },
      "pluginVersion": "v10.1.0",
      "targets": [
        {
          "datasource": {
            "type": "prometheus",
            "uid": "${datasource}"
          },
          "editorMode": "code",
          "expr": "sum by (policy_name)(rate(accepted_tokens_total{component_id=\"root.0\"}[$__rate_interval]))",
          "intervalFactor": 1,
          "legendFormat": "Accepted Token Rate",
          "range": true,
          "refId": "A"
        },
        {
          "datasource": {
            "type": "prometheus",
            "uid": "${datasource}"
          },
          "editorMode": "code",
          "expr": "sum by (policy_name)(rate(rejected_tokens_total{component_id=\"root.0\"}[$__rate_interval]))",
          "intervalFactor": 1,
          "legendFormat": "Rejected Token Rate",
          "range": true,
          "refId": "B"
        }
      ],
      "title": "Accepted Token Rate vs Rejected Token Rate",
      "type": "timeseries"
    },
    {
      "datasource": {
        "type": "prometheus",
        "uid": "${datasource}"
      },
      "fieldConfig": {
        "defaults": {
          "color": {
            "mode": "thresholds"
          },
          "mappings": [],
          "noValue": "No data",
          "thresholds": {
            "mode": "absolute",
            "steps": [
              {
                "color": "blue",
                "value": null
              }
            ]
          },
          "unit": "short"
        },
        "overrides": []
      },
      "gridPos": {
        "h": 10,
        "w": 8,
        "x": 0,
        "y": 78
      },
      "id": 15,
      "options": {
        "colorMode": "value",
        "graphMode": "area",
        "justifyMode": "center",
        "orientation": "horizontal",
        "reduceOptions": {
          "calcs": [
            "lastNotNull"
          ],
          "fields": "",
          "values": false
        },
        "textMode": "auto"
      },
      "pluginVersion": "10.0.9",
      "targets": [
        {
          "datasource": {
            "type": "prometheus",
            "uid": "${datasource}"
          },
          "editorMode": "code",
          "expr": "sum by (policy_name)(increase(incoming_tokens_total{component_id=\"root.0\"}[$__range]))",
          "instant": false,
          "intervalFactor": 1,
          "legendFormat": "{{ policy_name }}",
          "range": true,
          "refId": "A"
        }
      ],
      "title": "Total Incoming Tokens",
      "type": "stat"
    },
    {
      "datasource": {
        "type": "prometheus",
        "uid": "${datasource}"
      },
      "fieldConfig": {
        "defaults": {
          "color": {
            "mode": "thresholds"
          },
          "mappings": [],
          "noValue": "No data",
          "thresholds": {
            "mode": "absolute",
            "steps": [
              {
                "color": "green",
                "value": null
              }
            ]
          },
          "unit": "short"
        },
        "overrides": []
      },
      "gridPos": {
        "h": 10,
        "w": 8,
        "x": 8,
        "y": 78
      },
      "id": 16,
      "options": {
        "colorMode": "value",
        "graphMode": "area",
        "justifyMode": "center",
        "orientation": "horizontal",
        "reduceOptions": {
          "calcs": [
            "lastNotNull"
          ],
          "fields": "",
          "values": false
        },
        "textMode": "auto"
      },
      "pluginVersion": "10.0.9",
      "targets": [
        {
          "datasource": {
            "type": "prometheus",
            "uid": "${datasource}"
          },
          "editorMode": "code",
          "expr": "sum by (policy_name)(increase(accepted_tokens_total{component_id=\"root.0\"}[$__range]))",
          "instant": false,
          "intervalFactor": 1,
          "legendFormat": "{{ instance }} - {{ policy_name }}",
          "range": true,
          "refId": "A"
        }
      ],
      "title": "Total Accepted Tokens",
      "type": "stat"
    },
    {
      "datasource": {
        "type": "prometheus",
        "uid": "${datasource}"
      },
      "fieldConfig": {
        "defaults": {
          "color": {
            "mode": "thresholds"
          },
          "mappings": [],
          "noValue": "No data",
          "thresholds": {
            "mode": "absolute",
            "steps": [
              {
                "color": "red",
                "value": null
              }
            ]
          },
          "unit": "short"
        },
        "overrides": []
      },
      "gridPos": {
        "h": 10,
        "w": 8,
        "x": 16,
        "y": 78
      },
      "id": 17,
      "options": {
        "colorMode": "value",
        "graphMode": "area",
        "justifyMode": "center",
        "orientation": "horizontal",
        "reduceOptions": {
          "calcs": [
            "lastNotNull"
          ],
          "fields": "",
          "values": false
        },
        "textMode": "auto"
      },
      "pluginVersion": "10.0.9",
      "targets": [
        {
          "datasource": {
            "type": "prometheus",
            "uid": "${datasource}"
          },
          "editorMode": "code",
          "expr": "sum by (policy_name)(increase(rejected_tokens_total{component_id=\"root.0\"}[$__range]))",
          "instant": false,
          "intervalFactor": 1,
          "legendFormat": "{{ policy_name }}",
          "range": true,
          "refId": "A"
        }
      ],
      "title": "Total Rejected Tokens",
      "type": "stat"
    }
  ],
  "refresh": "",
  "schemaVersion": 38,
  "style": "dark",
  "tags": [],
  "templating": {
    "list": [
      {
        "hide": 0,
        "includeAll": false,
        "label": "Data Source",
        "multi": false,
        "name": "datasource",
        "options": [],
        "query": "prometheus",
        "refresh": 1,
        "regex": "",
        "skipUrlSync": false,
        "type": "datasource"
      }
    ]
  },
  "time": {
    "from": "now-5m",
    "to": "now"
  },
  "timepicker": {},
  "timezone": "browser",
  "title": "Policy Summary - concurrencyscheduling",
  "version": 2,
  "weekStart": ""
}

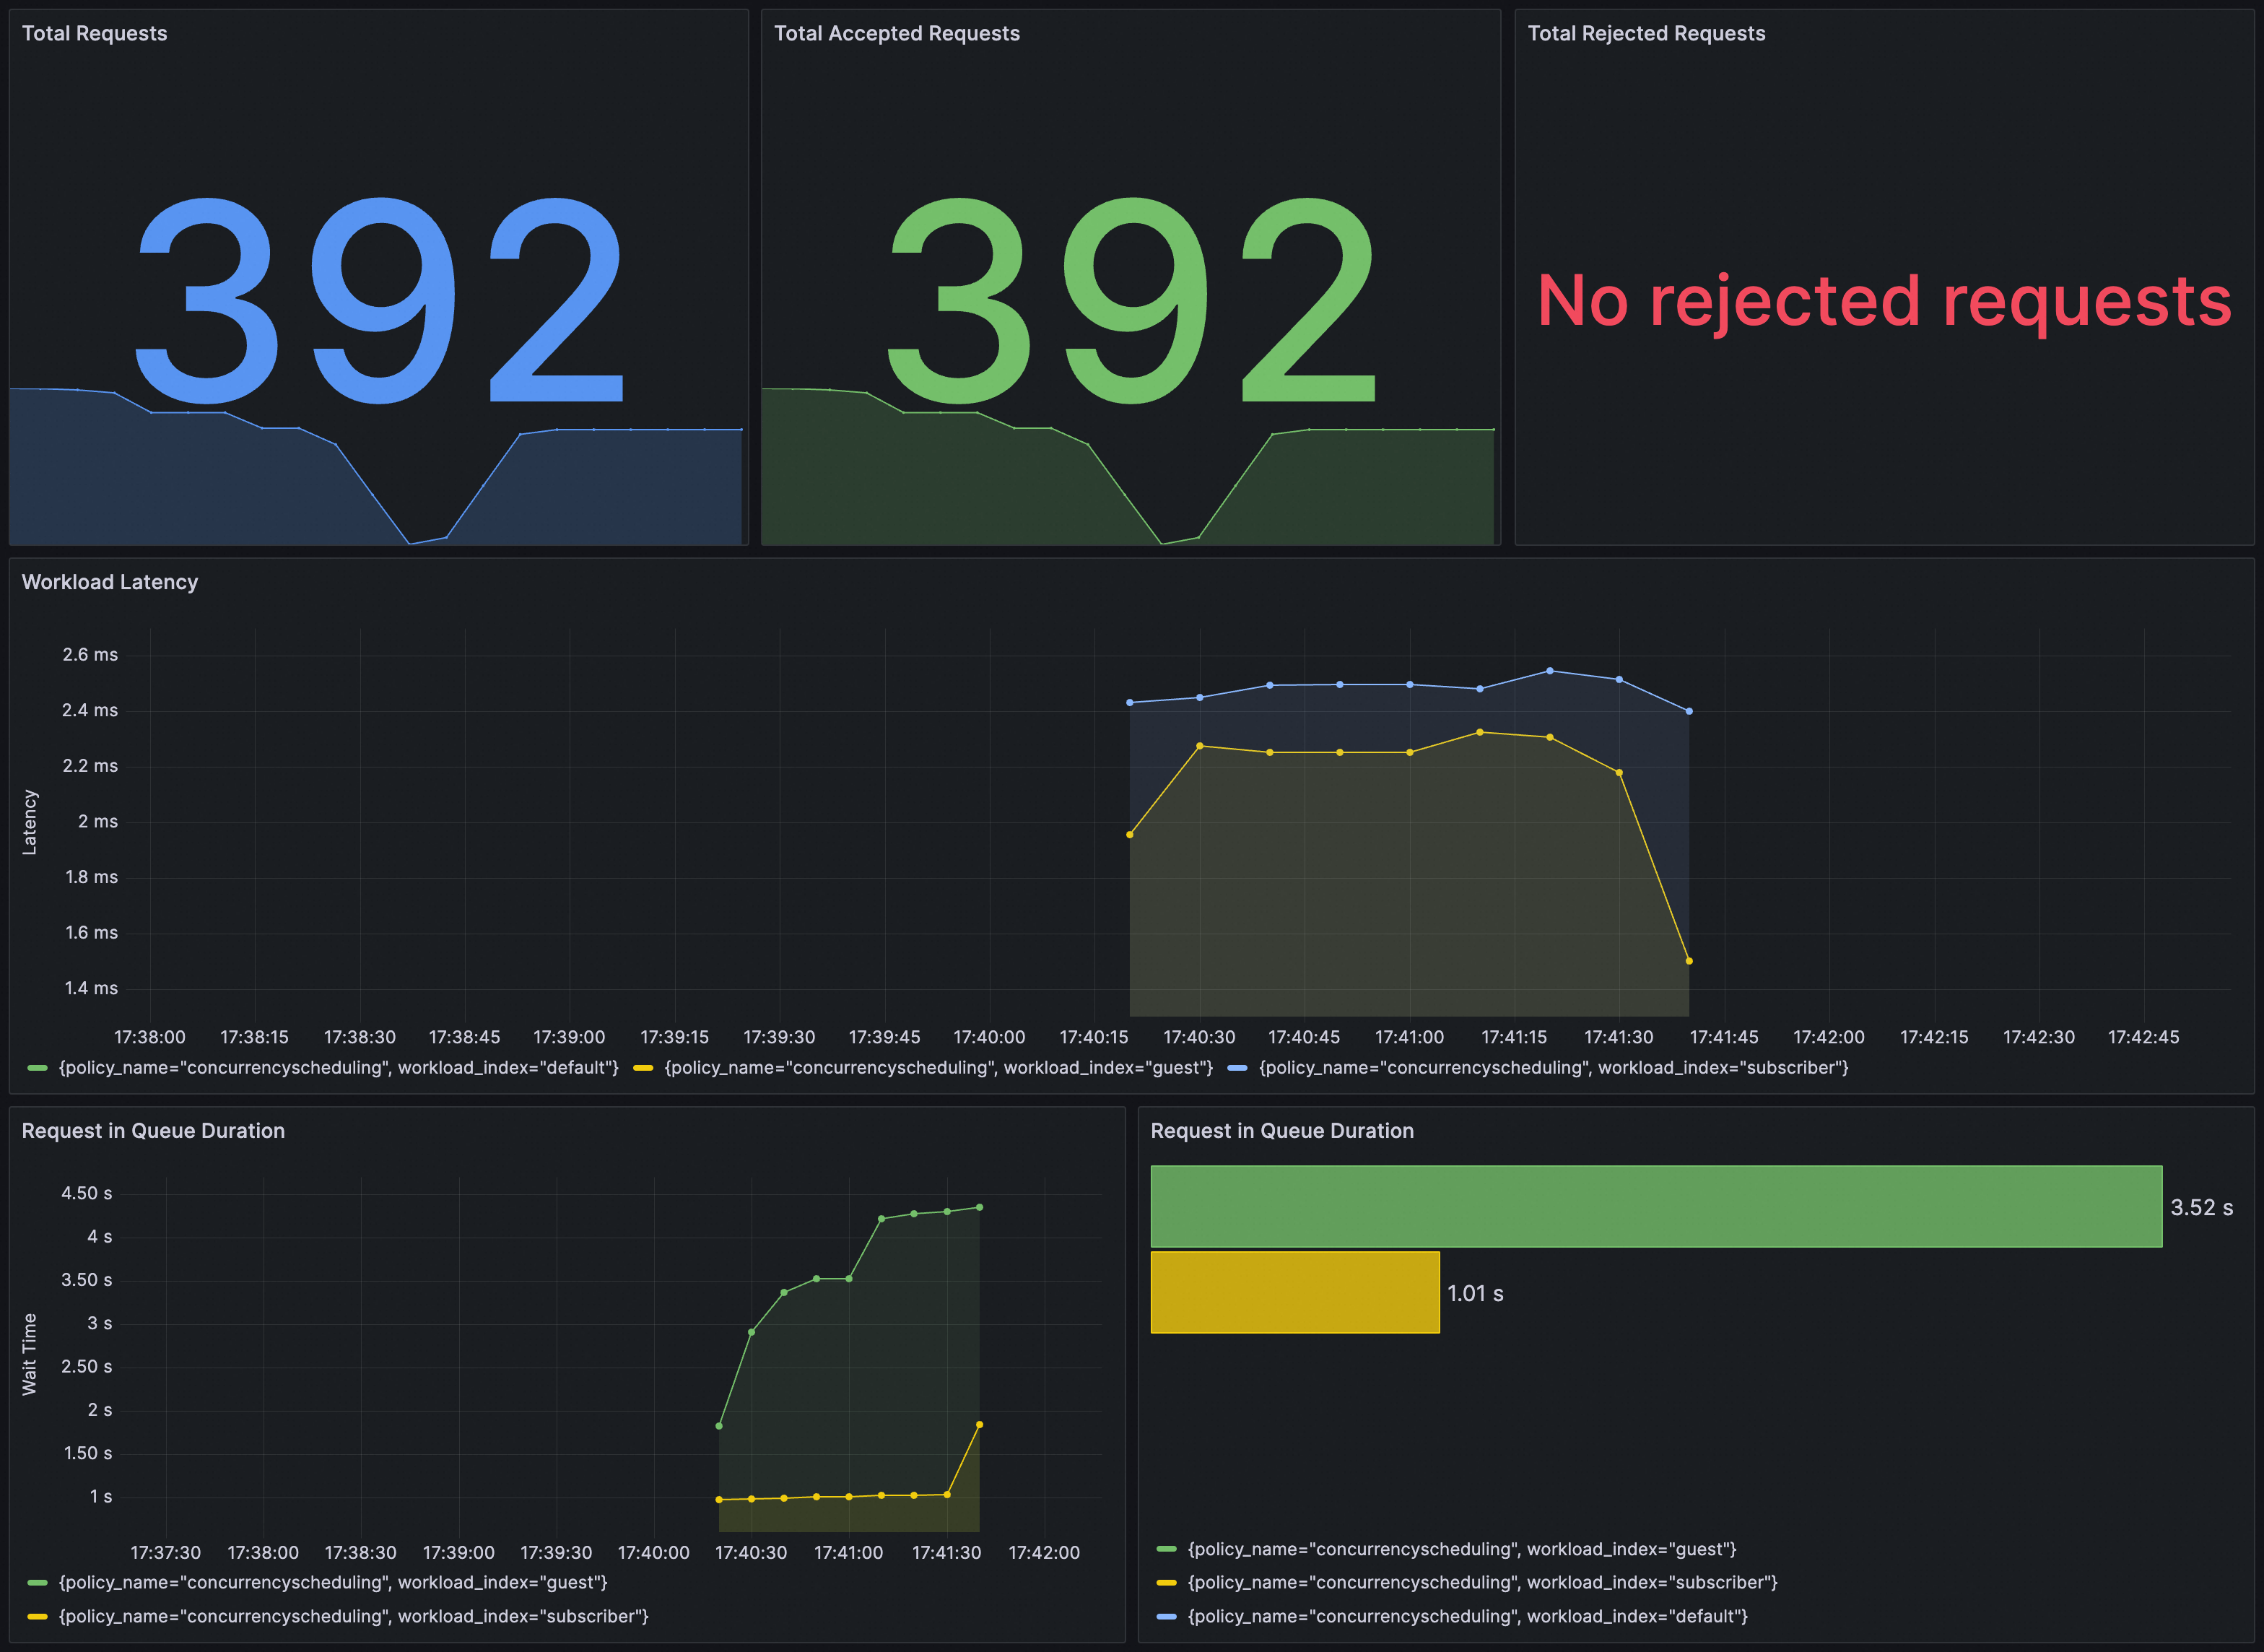
A figura a seguir mostra um exemplo de painel.
image