Todos os produtos
Search
Central de documentação

Container Service for Kubernetes:Intelligent routing and traffic management with Gateway with Inference Extension

Última atualização: Oct 13, 2026

O balanceamento de carga tradicional costuma ser insuficiente para serviços de inferência de LLM em clusters Kubernetes, pois depende de uma alocação simples de tráfego incapaz de lidar com requisições complexas e a carga dinâmica da inferência de LLM. Este tópico explica como usar o add-on Gateway with Inference Extension para configurar uma extensão de service de inferência voltada ao roteamento inteligente e ao gerenciamento eficiente de tráfego.

Informações básicas

Modelos de linguagem grandes (LLMs)

Os modelos de linguagem grandes (LLMs) são modelos baseados em redes neurais com bilhões de parâmetros, como GPT, Qwen e Llama. Esses modelos são treinados em conjuntos de dados diversificados e extensos — incluindo textos da web, literatura técnica e código — e são usados principalmente para tarefas de geração de texto, como conclusão e diálogo.

Para aproveitar os LLMs na criação de aplicações, você pode:

  • Usar serviços externos de API de LLM de plataformas como OpenAI, Alibaba Cloud Model Studio ou Moonshot.

  • Criar seus próprios serviços de inferência de LLM usando modelos e frameworks open source ou proprietários, como o vLLM, e implantá-los em um cluster Kubernetes. Essa abordagem é adequada para cenários que exigem controle sobre o service de inferência ou alta personalização das capacidades de inferência do LLM.

vLLM

vLLM é um framework projetado para a construção eficiente e simplificada de serviços de inferência de LLM. Ele oferece suporte a vários modelos de linguagem grandes, incluindo o Qwen, e otimiza a eficiência da inferência por meio de técnicas como PagedAttention, inferência em lote dinâmica (Continuous Batching) e quantização de modelos.

KV cache

Durante a inferência, armazenar em cache as chaves e valores gerados pelo modelo permite acesso rápido às informações contextuais de requisições anteriores, melhorando a eficiência da geração de texto. Um KV cache evita cálculos redundantes, acelerando significativamente a inferência e reduzindo a latência de resposta.

Fluxo de trabalho

O diagrama a seguir ilustra o fluxo de trabalho.

image
  1. No inference-gateway, a porta 8080 usa uma rota HTTP padrão para encaminhar requisições ao service de inferência de backend. Já a porta 8081 direciona as requisições para a extensão do service de inferência (LLM Route), que então as encaminha ao service de inferência de backend.

  2. Em uma rota HTTP, configure um recurso InferencePool para declarar um grupo de workloads do service de inferência de LLM em execução no cluster e um recurso InferenceModel para especificar a política de distribuição de tráfego de um modelo específico dentro do InferencePool. Essa configuração roteia as requisições da porta 8081 do inference-gateway para os workloads especificados, utilizando um algoritmo de balanceamento de carga aprimorado para serviços de inferência.

Pré-requisitos

É necessário ter um cluster gerenciado ACK com um pool de nós GPU. Como alternativa, instale o add-on ACK Virtual Node no seu cluster gerenciado ACK para utilizar o poder de computação GPU do ACS.

Procedimento

Etapa 1: Implante um service de inferência de exemplo

  1. Crie um arquivo chamado vllm-service.yaml com o seguinte conteúdo.

    Nota

    Para a imagem deste artigo, use as placas A10 em clusters Container Service for Kubernetes (ACK) e o tipo de placa L20(GN8IS) no Alibaba Cloud Container Compute Service (ACS).

    Como a imagem do LLM é grande, transfira-a para o Container Registry (ACR) e faça o pull usando um endereço de rede interna. O pull pela rede pública pode ser lento, pois a velocidade é limitada pela largura de banda do elastic IP address (EIP) do cluster.

    YAML

    apiVersion: apps/v1
    kind: Deployment
    metadata:
      labels:
        app: qwen
      name: qwen
    spec:
      replicas: 5
      selector:
        matchLabels:
          app: qwen
      template:
        metadata:
          annotations:
            prometheus.io/path: /metrics
            prometheus.io/port: "8000"
            prometheus.io/scrape: "true"
          labels:
            app: qwen
        spec:
          containers:
          - command:
            - sh
            - -c
            - vllm serve /models/Qwen-2.5-7B-Instruct --port 8000 --trust-remote-code --served-model-name /model/qwen --max-model-len 8192 --gpu-memory-utilization 0.95 --enforce-eager --enable-lora --max-loras 2 --max-cpu-loras 4 --lora-modules travel-helper-v1=/models/Qwen-TravelHelper-Lora travel-helper-v2=/models/Qwen-TravelHelper-Lora-v2
            image: registry-cn-hangzhou.ack.aliyuncs.com/dev/qwen-2.5-7b-instruct-lora:v0.1
            imagePullPolicy: IfNotPresent
            name: custom-serving
            ports:
            - containerPort: 8000
              name: http
              protocol: TCP
            readinessProbe:
              failureThreshold: 3
              initialDelaySeconds: 30
              periodSeconds: 30
              successThreshold: 1
              tcpSocket:
                port: 8000
              timeoutSeconds: 1
            resources:
              limits:
                nvidia.com/gpu: "1"
            terminationMessagePath: /dev/termination-log
            terminationMessagePolicy: File
            volumeMounts:
            - mountPath: /dev/shm
              name: dshm
          dnsPolicy: ClusterFirst
          restartPolicy: Always
          schedulerName: default-scheduler
          securityContext: {}
          terminationGracePeriodSeconds: 30
          volumes:
          - emptyDir:
              medium: Memory
              sizeLimit: 30Gi
            name: dshm
    ---
    apiVersion: v1
    kind: Service
    metadata:
      labels:
        app: qwen
      name: qwen
    spec:
      ports:
      - name: http-serving
        port: 8000
        protocol: TCP
        targetPort: 8000
      selector:
        app: qwen
  2. Implante o service de inferência de exemplo.

    kubectl apply -f vllm-service.yaml

Etapa 2: Instale o Gateway with Inference Extension

Install the ACK Gateway with Inference Extension add-on e certifique-se de que a opção Enable Gateway API Inference Extension (Requires a deployed inference service) esteja selecionada.

Na configuração de parâmetros, defina as réplicas de implantação (contagem de réplicas do plano de controle) como replicas do deployment para 2. Em envoyGateway > resources > limits, defina a CPU como 500m e a memória como 1Gi. Em requests, defina a CPU como 100m e a memória como 256Mi.

Etapa 3: Implante o roteamento de inferência

Esta etapa cria os recursos InferencePool e InferenceModel.

  1. Crie o arquivo inference-pool.yaml.

    apiVersion: inference.networking.x-k8s.io/v1alpha2
    kind: InferencePool
    metadata:
      name: vllm-qwen-pool
    spec:
      targetPortNumber: 8000
      selector:
        app: qwen
      extensionRef:
        name: inference-gateway-ext-proc
    ---
    apiVersion: inference.networking.x-k8s.io/v1alpha2
    kind: InferenceModel
    metadata:
      name: inferencemodel-qwen
    spec:
      modelName: /model/qwen
      criticality: Critical
      poolRef:
        group: inference.networking.x-k8s.io
        kind: InferencePool
        name: vllm-qwen-pool
      targetModels:
      - name: /model/qwen
        weight: 100
  2. Aplique a configuração.

    kubectl apply -f inference-pool.yaml

Etapa 4: Implante e verifique o gateway

Esta etapa cria um gateway que escuta nas portas 8080 e 8081.

  1. Crie o arquivo inference-gateway.yaml.

    apiVersion: gateway.networking.k8s.io/v1
    kind: GatewayClass
    metadata:
      name: qwen-inference-gateway-class
    spec:
      controllerName: gateway.envoyproxy.io/gatewayclass-controller
    ---
    apiVersion: gateway.networking.k8s.io/v1
    kind: Gateway
    metadata:
      name: qwen-inference-gateway
    spec:
      gatewayClassName: qwen-inference-gateway-class
      listeners:
        - name: http
          protocol: HTTP
          port: 8080
        - name: llm-gw
          protocol: HTTP
          port: 8081
    ---
    apiVersion: gateway.networking.k8s.io/v1
    kind: HTTPRoute
    metadata:
      name: qwen-backend
    spec:
      parentRefs:
        - name: qwen-inference-gateway
          sectionName: llm-gw
      rules:
        - backendRefs:
            - group: inference.networking.x-k8s.io
              kind: InferencePool
              name: vllm-qwen-pool
          matches:
            - path:
                type: PathPrefix
                value: /
    ---
    apiVersion: gateway.networking.k8s.io/v1
    kind: HTTPRoute
    metadata:
      name: qwen-backend-no-inference
    spec:
      parentRefs:
      - group: gateway.networking.k8s.io
        kind: Gateway
        name: qwen-inference-gateway
        sectionName: http
      rules:
      - backendRefs:
        - group: ""
          kind: Service
          name: qwen
          port: 8000
          weight: 1
        matches:
        - path:
            type: PathPrefix
            value: /
    ---
    apiVersion: gateway.envoyproxy.io/v1alpha1
    kind: BackendTrafficPolicy
    metadata:
      name: backend-timeout
    spec:
      timeout:
        http:
          requestTimeout: 1h
      targetRef:
        group: gateway.networking.k8s.io
        kind: Gateway
        name: qwen-inference-gateway
  2. Implante o gateway.

    kubectl apply -f inference-gateway.yaml

    Essa configuração cria um namespace chamado envoy-gateway-system e um service chamado envoy-default-inference-gateway-645xxxxx no cluster.

  3. Obtenha o endereço IP público do gateway.

    export GATEWAY_HOST=$(kubectl get gateway/qwen-inference-gateway -o jsonpath='{.status.addresses[0].value}')
  4. Verifique se o gateway roteia para o service de inferência via roteamento HTTP padrão na porta 8080.

    curl -X POST ${GATEWAY_HOST}:8080/v1/chat/completions -H 'Content-Type: application/json' -d '{
        "model": "/model/qwen",
        "max_completion_tokens": 100,
        "temperature": 0,
        "messages": [
          {
            "role": "user",
            "content": "Write as if you were a critic: San Francisco"
          }
        ]
    }'

    Saída esperada:

    {"id":"chatcmpl-aa6438e2-d65b-4211-afb8-ae8e76e7a692","object":"chat.completion","created":1747191180,"model":"/model/qwen","choices":[{"index":0,"message":{"role":"assistant","reasoning_content":null,"content":"San Francisco, a city that has long been a beacon of innovation, culture, and diversity, continues to captivate the world with its unique charm and character. As a critic, I find myself both enamored and occasionally perplexed by the city's multifaceted personality.\n\nSan Francisco's architecture is a testament to its rich history and progressive spirit. The iconic cable cars, Victorian houses, and the Golden Gate Bridge are not just tourist attractions but symbols of the city's enduring appeal. However, the","tool_calls":[]},"logprobs":null,"finish_reason":"length","stop_reason":null}],"usage":{"prompt_tokens":39,"total_tokens":139,"completion_tokens":100,"prompt_tokens_details":null},"prompt_logprobs":null}
  5. Verifique se o gateway roteia para o service de inferência por meio da extensão do service de inferência na porta 8081.

    curl -X POST ${GATEWAY_HOST}:8081/v1/chat/completions -H 'Content-Type: application/json' -d '{
        "model": "/model/qwen",
        "max_completion_tokens": 100,
        "temperature": 0,
        "messages": [
          {
            "role": "user",
            "content": "Write as if you were a critic: Los Angeles"
          }
        ]
    }'

    Saída esperada:

    {"id":"chatcmpl-cc4fcd0a-6a66-4684-8dc9-284d4eb77bb7","object":"chat.completion","created":1747191969,"model":"/model/qwen","choices":[{"index":0,"message":{"role":"assistant","reasoning_content":null,"content":"Los Angeles, the sprawling metropolis often referred to as \"L.A.,\" is a city that defies easy description. It is a place where dreams are made and broken, where the sun never sets, and where the line between reality and fantasy is as blurred as the smog that often hangs over its valleys. As a critic, I find myself both captivated and perplexed by this city that is as much a state of mind as it is a physical place.\n\nOn one hand, Los","tool_calls":[]},"logprobs":null,"finish_reason":"length","stop_reason":null}],"usage":{"prompt_tokens":39,"total_tokens":139,"completion_tokens":100,"prompt_tokens_details":null},"prompt_logprobs":null}

(Opcional) Etapa 5: Configure métricas de observabilidade e painel

Nota

Você deve ativar e integrate Managed Service for Prometheus com o cluster, o que pode gerar custos adicionais.

  1. Adicione annotations ao pod do service vLLM, permitindo que o Prometheus use seu default service discovery para coletar metrics e monitorar o estado interno do service.

    ...
    annotations:
      prometheus.io/path: /metrics # The HTTP path for the metrics endpoint.
      prometheus.io/port: "8000" # The port for the metrics endpoint, which is the vLLM server's listening port.
      prometheus.io/scrape: "true" # Specifies whether Prometheus scrapes metrics from this pod.
    ...

    A tabela a seguir lista as principais metrics de monitoramento do service vLLM.

    Métrica

    Descrição

    vllm:gpu_cache_usage_perc

    A porcentagem de cache da GPU usada pelo vLLM. Quando o vLLM inicia, ele pré-aloca o máximo possível de GPU video memory para o KV cache. Em servidores vLLM, uma porcentagem de utilização menor indica que a GPU tem espaço suficiente para novas requisições.

    vllm:request_queue_time_seconds_sum

    O tempo total que as requisições passam aguardando na fila. As requisições de inferência de LLM recebidas podem não ser processadas imediatamente. Elas precisam esperar que o vLLM scheduler as agende para prefill e decode.

    vllm:num_requests_running

    vllm:num_requests_waiting

    vllm:num_requests_swapped

    O número de requisições atualmente em processamento, aguardando ou transferidas para a memória. Use esses valores para avaliar a carga atual de requisições do service vLLM.

    vllm:avg_generation_throughput_toks_per_s

    vllm:avg_prompt_throughput_toks_per_s

    O número de tokens por segundo consumidos durante a fase de prefill e gerados durante a fase de decode.

    vllm:time_to_first_token_seconds_bucket

    A latency entre o envio de uma requisição ao service vLLM e o recebimento do primeiro token. Essa metric, também conhecida como Time to First Token (TTFT), é fundamental para a experiência do usuário, pois mede o tempo de espera do cliente pela resposta inicial.

    Utilize essas metrics de monitoramento para configurar alert rules voltadas ao monitoramento em tempo real e à anomaly detection do seu service de LLM.

  2. Configure um painel do Grafana para monitorar em tempo real um service de inferência de LLM implantado com vLLM. Esse painel permite:

    • Observar a taxa de requisições e o throughput total de tokens do service de LLM.

    • Observar o estado interno do workload de inferência.

    Certifique-se de que sua instância do Prometheus, que serve como fonte de dados para o Grafana, tenha coletado as métricas de monitoramento do vLLM. Para criar o painel, importe o seguinte conteúdo JSON no Grafana.

    Conteúdo JSON

    {
      "annotations": {
        "list": [
          {
            "builtIn": 1,
            "datasource": {
              "type": "grafana",
              "uid": "-- Grafana --"
            },
            "enable": true,
            "hide": true,
            "iconColor": "rgba(0, 211, 255, 1)",
            "name": "Annotations & Alerts",
            "target": {
              "limit": 100,
              "matchAny": false,
              "tags": [],
              "type": "dashboard"
            },
            "type": "dashboard"
          }
        ]
      },
      "description": "Monitoring vLLM Inference Server",
      "editable": true,
      "fiscalYearStartMonth": 0,
      "graphTooltip": 0,
      "id": 1,
      "links": [],
      "liveNow": false,
      "panels": [
        {
          "datasource": {
            "type": "prometheus",
            "uid": "${DS_PROMETHEUS}"
          },
          "description": "End to end request latency measured in seconds.",
          "fieldConfig": {
            "defaults": {
              "color": {
                "mode": "palette-classic"
              },
              "custom": {
                "axisBorderShow": false,
                "axisCenteredZero": false,
                "axisColorMode": "text",
                "axisLabel": "",
                "axisPlacement": "auto",
                "barAlignment": 0,
                "barWidthFactor": 0.6,
                "drawStyle": "line",
                "fillOpacity": 0,
                "gradientMode": "none",
                "hideFrom": {
                  "legend": false,
                  "tooltip": false,
                  "viz": false
                },
                "insertNulls": false,
                "lineInterpolation": "linear",
                "lineWidth": 1,
                "pointSize": 5,
                "scaleDistribution": {
                  "type": "linear"
                },
                "showPoints": "auto",
                "spanNulls": false,
                "stacking": {
                  "group": "A",
                  "mode": "none"
                },
                "thresholdsStyle": {
                  "mode": "off"
                }
              },
              "mappings": [],
              "thresholds": {
                "mode": "absolute",
                "steps": [
                  {
                    "color": "green",
                    "value": null
                  },
                  {
                    "color": "red",
                    "value": 80
                  }
                ]
              },
              "unit": "s"
            },
            "overrides": []
          },
          "gridPos": {
            "h": 8,
            "w": 12,
            "x": 0,
            "y": 0
          },
          "id": 9,
          "options": {
            "legend": {
              "calcs": [],
              "displayMode": "list",
              "placement": "bottom",
              "showLegend": true
            },
            "tooltip": {
              "mode": "single",
              "sort": "none"
            }
          },
          "targets": [
            {
              "datasource": {
                "type": "prometheus",
                "uid": "${DS_PROMETHEUS}"
              },
              "disableTextWrap": false,
              "editorMode": "builder",
              "expr": "histogram_quantile(0.99, sum by(le) (rate(vllm:e2e_request_latency_seconds_bucket{model_name=\"$model_name\"}[$__rate_interval])))",
              "fullMetaSearch": false,
              "includeNullMetadata": false,
              "instant": false,
              "legendFormat": "P99",
              "range": true,
              "refId": "A",
              "useBackend": false
            },
            {
              "datasource": {
                "type": "prometheus",
                "uid": "${DS_PROMETHEUS}"
              },
              "disableTextWrap": false,
              "editorMode": "builder",
              "expr": "histogram_quantile(0.95, sum by(le) (rate(vllm:e2e_request_latency_seconds_bucket{model_name=\"$model_name\"}[$__rate_interval])))",
              "fullMetaSearch": false,
              "hide": false,
              "includeNullMetadata": false,
              "instant": false,
              "legendFormat": "P95",
              "range": true,
              "refId": "B",
              "useBackend": false
            },
            {
              "datasource": {
                "type": "prometheus",
                "uid": "${DS_PROMETHEUS}"
              },
              "disableTextWrap": false,
              "editorMode": "builder",
              "expr": "histogram_quantile(0.9, sum by(le) (rate(vllm:e2e_request_latency_seconds_bucket{model_name=\"$model_name\"}[$__rate_interval])))",
              "fullMetaSearch": false,
              "hide": false,
              "includeNullMetadata": false,
              "instant": false,
              "legendFormat": "P90",
              "range": true,
              "refId": "C",
              "useBackend": false
            },
            {
              "datasource": {
                "type": "prometheus",
                "uid": "${DS_PROMETHEUS}"
              },
              "disableTextWrap": false,
              "editorMode": "builder",
              "expr": "histogram_quantile(0.5, sum by(le) (rate(vllm:e2e_request_latency_seconds_bucket{model_name=\"$model_name\"}[$__rate_interval])))",
              "fullMetaSearch": false,
              "hide": false,
              "includeNullMetadata": false,
              "instant": false,
              "legendFormat": "P50",
              "range": true,
              "refId": "D",
              "useBackend": false
            },
            {
              "datasource": {
                "type": "prometheus",
                "uid": "${DS_PROMETHEUS}"
              },
              "editorMode": "code",
              "expr": "rate(vllm:e2e_request_latency_seconds_sum{model_name=\"$model_name\"}[$__rate_interval])\n/\nrate(vllm:e2e_request_latency_seconds_count{model_name=\"$model_name\"}[$__rate_interval])",
              "hide": false,
              "instant": false,
              "legendFormat": "Average",
              "range": true,
              "refId": "E"
            }
          ],
          "title": "E2E Request Latency",
          "type": "timeseries"
        },
        {
          "datasource": {
            "type": "prometheus",
            "uid": "${DS_PROMETHEUS}"
          },
          "description": "Number of tokens processed per second",
          "fieldConfig": {
            "defaults": {
              "color": {
                "mode": "palette-classic"
              },
              "custom": {
                "axisBorderShow": false,
                "axisCenteredZero": false,
                "axisColorMode": "text",
                "axisLabel": "",
                "axisPlacement": "auto",
                "barAlignment": 0,
                "barWidthFactor": 0.6,
                "drawStyle": "line",
                "fillOpacity": 0,
                "gradientMode": "none",
                "hideFrom": {
                  "legend": false,
                  "tooltip": false,
                  "viz": false
                },
                "insertNulls": false,
                "lineInterpolation": "linear",
                "lineWidth": 1,
                "pointSize": 5,
                "scaleDistribution": {
                  "type": "linear"
                },
                "showPoints": "auto",
                "spanNulls": false,
                "stacking": {
                  "group": "A",
                  "mode": "none"
                },
                "thresholdsStyle": {
                  "mode": "off"
                }
              },
              "mappings": [],
              "thresholds": {
                "mode": "absolute",
                "steps": [
                  {
                    "color": "green",
                    "value": null
                  },
                  {
                    "color": "red",
                    "value": 80
                  }
                ]
              }
            },
            "overrides": []
          },
          "gridPos": {
            "h": 8,
            "w": 12,
            "x": 12,
            "y": 0
          },
          "id": 8,
          "options": {
            "legend": {
              "calcs": [],
              "displayMode": "list",
              "placement": "bottom",
              "showLegend": true
            },
            "tooltip": {
              "mode": "single",
              "sort": "none"
            }
          },
          "targets": [
            {
              "datasource": {
                "type": "prometheus",
                "uid": "${DS_PROMETHEUS}"
              },
              "disableTextWrap": false,
              "editorMode": "builder",
              "expr": "rate(vllm:prompt_tokens_total{model_name=\"$model_name\"}[$__rate_interval])",
              "fullMetaSearch": false,
              "includeNullMetadata": false,
              "instant": false,
              "legendFormat": "Prompt Tokens/Sec",
              "range": true,
              "refId": "A",
              "useBackend": false
            },
            {
              "datasource": {
                "type": "prometheus",
                "uid": "${DS_PROMETHEUS}"
              },
              "disableTextWrap": false,
              "editorMode": "builder",
              "expr": "rate(vllm:generation_tokens_total{model_name=\"$model_name\"}[$__rate_interval])",
              "fullMetaSearch": false,
              "hide": false,
              "includeNullMetadata": false,
              "instant": false,
              "legendFormat": "Generation Tokens/Sec",
              "range": true,
              "refId": "B",
              "useBackend": false
            }
          ],
          "title": "Token Throughput",
          "type": "timeseries"
        },
        {
          "datasource": {
            "type": "prometheus",
            "uid": "${DS_PROMETHEUS}"
          },
          "description": "Inter token latency in seconds.",
          "fieldConfig": {
            "defaults": {
              "color": {
                "mode": "palette-classic"
              },
              "custom": {
                "axisBorderShow": false,
                "axisCenteredZero": false,
                "axisColorMode": "text",
                "axisLabel": "",
                "axisPlacement": "auto",
                "barAlignment": 0,
                "barWidthFactor": 0.6,
                "drawStyle": "line",
                "fillOpacity": 0,
                "gradientMode": "none",
                "hideFrom": {
                  "legend": false,
                  "tooltip": false,
                  "viz": false
                },
                "insertNulls": false,
                "lineInterpolation": "linear",
                "lineWidth": 1,
                "pointSize": 5,
                "scaleDistribution": {
                  "type": "linear"
                },
                "showPoints": "auto",
                "spanNulls": false,
                "stacking": {
                  "group": "A",
                  "mode": "none"
                },
                "thresholdsStyle": {
                  "mode": "off"
                }
              },
              "mappings": [],
              "thresholds": {
                "mode": "absolute",
                "steps": [
                  {
                    "color": "green",
                    "value": null
                  },
                  {
                    "color": "red",
                    "value": 80
                  }
                ]
              },
              "unit": "s"
            },
            "overrides": []
          },
          "gridPos": {
            "h": 8,
            "w": 12,
            "x": 0,
            "y": 8
          },
          "id": 10,
          "options": {
            "legend": {
              "calcs": [],
              "displayMode": "list",
              "placement": "bottom",
              "showLegend": true
            },
            "tooltip": {
              "mode": "single",
              "sort": "none"
            }
          },
          "targets": [
            {
              "datasource": {
                "type": "prometheus",
                "uid": "${DS_PROMETHEUS}"
              },
              "disableTextWrap": false,
              "editorMode": "builder",
              "expr": "histogram_quantile(0.99, sum by(le) (rate(vllm:time_per_output_token_seconds_bucket{model_name=\"$model_name\"}[$__rate_interval])))",
              "fullMetaSearch": false,
              "includeNullMetadata": false,
              "instant": false,
              "legendFormat": "P99",
              "range": true,
              "refId": "A",
              "useBackend": false
            },
            {
              "datasource": {
                "type": "prometheus",
                "uid": "${DS_PROMETHEUS}"
              },
              "disableTextWrap": false,
              "editorMode": "builder",
              "expr": "histogram_quantile(0.95, sum by(le) (rate(vllm:time_per_output_token_seconds_bucket{model_name=\"$model_name\"}[$__rate_interval])))",
              "fullMetaSearch": false,
              "hide": false,
              "includeNullMetadata": false,
              "instant": false,
              "legendFormat": "P95",
              "range": true,
              "refId": "B",
              "useBackend": false
            },
            {
              "datasource": {
                "type": "prometheus",
                "uid": "${DS_PROMETHEUS}"
              },
              "disableTextWrap": false,
              "editorMode": "builder",
              "expr": "histogram_quantile(0.9, sum by(le) (rate(vllm:time_per_output_token_seconds_bucket{model_name=\"$model_name\"}[$__rate_interval])))",
              "fullMetaSearch": false,
              "hide": false,
              "includeNullMetadata": false,
              "instant": false,
              "legendFormat": "P90",
              "range": true,
              "refId": "C",
              "useBackend": false
            },
            {
              "datasource": {
                "type": "prometheus",
                "uid": "${DS_PROMETHEUS}"
              },
              "disableTextWrap": false,
              "editorMode": "builder",
              "expr": "histogram_quantile(0.5, sum by(le) (rate(vllm:time_per_output_token_seconds_bucket{model_name=\"$model_name\"}[$__rate_interval])))",
              "fullMetaSearch": false,
              "hide": false,
              "includeNullMetadata": false,
              "instant": false,
              "legendFormat": "P50",
              "range": true,
              "refId": "D",
              "useBackend": false
            },
            {
              "datasource": {
                "type": "prometheus",
                "uid": "${DS_PROMETHEUS}"
              },
              "editorMode": "code",
              "expr": "rate(vllm:time_per_output_token_seconds_sum{model_name=\"$model_name\"}[$__rate_interval])\n/\nrate(vllm:time_per_output_token_seconds_count{model_name=\"$model_name\"}[$__rate_interval])",
              "hide": false,
              "instant": false,
              "legendFormat": "Mean",
              "range": true,
              "refId": "E"
            }
          ],
          "title": "Time Per Output Token Latency",
          "type": "timeseries"
        },
        {
          "datasource": {
            "type": "prometheus",
            "uid": "${DS_PROMETHEUS}"
          },
          "description": "Number of requests in RUNNING, WAITING, and SWAPPED state",
          "fieldConfig": {
            "defaults": {
              "color": {
                "mode": "palette-classic"
              },
              "custom": {
                "axisBorderShow": false,
                "axisCenteredZero": false,
                "axisColorMode": "text",
                "axisLabel": "",
                "axisPlacement": "auto",
                "barAlignment": 0,
                "barWidthFactor": 0.6,
                "drawStyle": "line",
                "fillOpacity": 0,
                "gradientMode": "none",
                "hideFrom": {
                  "legend": false,
                  "tooltip": false,
                  "viz": false
                },
                "insertNulls": false,
                "lineInterpolation": "linear",
                "lineWidth": 1,
                "pointSize": 5,
                "scaleDistribution": {
                  "type": "linear"
                },
                "showPoints": "auto",
                "spanNulls": false,
                "stacking": {
                  "group": "A",
                  "mode": "none"
                },
                "thresholdsStyle": {
                  "mode": "off"
                }
              },
              "mappings": [],
              "thresholds": {
                "mode": "absolute",
                "steps": [
                  {
                    "color": "green",
                    "value": null
                  },
                  {
                    "color": "red",
                    "value": 80
                  }
                ]
              },
              "unit": "none"
            },
            "overrides": []
          },
          "gridPos": {
            "h": 8,
            "w": 12,
            "x": 12,
            "y": 8
          },
          "id": 3,
          "options": {
            "legend": {
              "calcs": [],
              "displayMode": "list",
              "placement": "bottom",
              "showLegend": true
            },
            "tooltip": {
              "mode": "single",
              "sort": "none"
            }
          },
          "targets": [
            {
              "datasource": {
                "type": "prometheus",
                "uid": "${DS_PROMETHEUS}"
              },
              "disableTextWrap": false,
              "editorMode": "builder",
              "expr": "vllm:num_requests_running{model_name=\"$model_name\"}",
              "fullMetaSearch": false,
              "includeNullMetadata": true,
              "instant": false,
              "legendFormat": "Num Running",
              "range": true,
              "refId": "A",
              "useBackend": false
            },
            {
              "datasource": {
                "type": "prometheus",
                "uid": "${DS_PROMETHEUS}"
              },
              "disableTextWrap": false,
              "editorMode": "builder",
              "expr": "vllm:num_requests_swapped{model_name=\"$model_name\"}",
              "fullMetaSearch": false,
              "hide": false,
              "includeNullMetadata": true,
              "instant": false,
              "legendFormat": "Num Swapped",
              "range": true,
              "refId": "B",
              "useBackend": false
            },
            {
              "datasource": {
                "type": "prometheus",
                "uid": "${DS_PROMETHEUS}"
              },
              "disableTextWrap": false,
              "editorMode": "builder",
              "expr": "vllm:num_requests_waiting{model_name=\"$model_name\"}",
              "fullMetaSearch": false,
              "hide": false,
              "includeNullMetadata": true,
              "instant": false,
              "legendFormat": "Num Waiting",
              "range": true,
              "refId": "C",
              "useBackend": false
            }
          ],
          "title": "Scheduler State",
          "type": "timeseries"
        },
        {
          "datasource": {
            "type": "prometheus",
            "uid": "${DS_PROMETHEUS}"
          },
          "description": "P50, P90, P95, and P99 TTFT latency in seconds.",
          "fieldConfig": {
            "defaults": {
              "color": {
                "mode": "palette-classic"
              },
              "custom": {
                "axisBorderShow": false,
                "axisCenteredZero": false,
                "axisColorMode": "text",
                "axisLabel": "",
                "axisPlacement": "auto",
                "barAlignment": 0,
                "barWidthFactor": 0.6,
                "drawStyle": "line",
                "fillOpacity": 0,
                "gradientMode": "none",
                "hideFrom": {
                  "legend": false,
                  "tooltip": false,
                  "viz": false
                },
                "insertNulls": false,
                "lineInterpolation": "linear",
                "lineWidth": 1,
                "pointSize": 5,
                "scaleDistribution": {
                  "type": "linear"
                },
                "showPoints": "auto",
                "spanNulls": false,
                "stacking": {
                  "group": "A",
                  "mode": "none"
                },
                "thresholdsStyle": {
                  "mode": "off"
                }
              },
              "mappings": [],
              "thresholds": {
                "mode": "absolute",
                "steps": [
                  {
                    "color": "green",
                    "value": null
                  },
                  {
                    "color": "red",
                    "value": 80
                  }
                ]
              },
              "unit": "s"
            },
            "overrides": []
          },
          "gridPos": {
            "h": 8,
            "w": 12,
            "x": 0,
            "y": 16
          },
          "id": 5,
          "options": {
            "legend": {
              "calcs": [],
              "displayMode": "list",
              "placement": "bottom",
              "showLegend": true
            },
            "tooltip": {
              "mode": "single",
              "sort": "none"
            }
          },
          "targets": [
            {
              "datasource": {
                "type": "prometheus",
                "uid": "${DS_PROMETHEUS}"
              },
              "disableTextWrap": false,
              "editorMode": "builder",
              "expr": "histogram_quantile(0.99, sum by(le) (rate(vllm:time_to_first_token_seconds_bucket{model_name=\"$model_name\"}[$__rate_interval])))",
              "fullMetaSearch": false,
              "hide": false,
              "includeNullMetadata": false,
              "instant": false,
              "legendFormat": "P99",
              "range": true,
              "refId": "A",
              "useBackend": false
            },
            {
              "datasource": {
                "type": "prometheus",
                "uid": "${DS_PROMETHEUS}"
              },
              "disableTextWrap": false,
              "editorMode": "builder",
              "expr": "histogram_quantile(0.95, sum by(le) (rate(vllm:time_to_first_token_seconds_bucket{model_name=\"$model_name\"}[$__rate_interval])))",
              "fullMetaSearch": false,
              "includeNullMetadata": false,
              "instant": false,
              "legendFormat": "P95",
              "range": true,
              "refId": "B",
              "useBackend": false
            },
            {
              "datasource": {
                "type": "prometheus",
                "uid": "${DS_PROMETHEUS}"
              },
              "disableTextWrap": false,
              "editorMode": "builder",
              "expr": "histogram_quantile(0.9, sum by(le) (rate(vllm:time_to_first_token_seconds_bucket{model_name=\"$model_name\"}[$__rate_interval])))",
              "fullMetaSearch": false,
              "hide": false,
              "includeNullMetadata": false,
              "instant": false,
              "legendFormat": "P90",
              "range": true,
              "refId": "C",
              "useBackend": false
            },
            {
              "datasource": {
                "type": "prometheus",
                "uid": "${DS_PROMETHEUS}"
              },
              "disableTextWrap": false,
              "editorMode": "builder",
              "expr": "histogram_quantile(0.5, sum by(le) (rate(vllm:time_to_first_token_seconds_bucket{model_name=\"$model_name\"}[$__rate_interval])))",
              "fullMetaSearch": false,
              "hide": false,
              "includeNullMetadata": false,
              "instant": false,
              "legendFormat": "P50",
              "range": true,
              "refId": "D",
              "useBackend": false
            },
            {
              "datasource": {
                "type": "prometheus",
                "uid": "${DS_PROMETHEUS}"
              },
              "editorMode": "code",
              "expr": "rate(vllm:time_to_first_token_seconds_sum{model_name=\"$model_name\"}[$__rate_interval])\n/\nrate(vllm:time_to_first_token_seconds_count{model_name=\"$model_name\"}[$__rate_interval])",
              "hide": false,
              "instant": false,
              "legendFormat": "Average",
              "range": true,
              "refId": "E"
            }
          ],
          "title": "Time To First Token Latency",
          "type": "timeseries"
        },
        {
          "datasource": {
            "type": "prometheus",
            "uid": "${DS_PROMETHEUS}"
          },
          "description": "Percentage of used cache blocks by vLLM.",
          "fieldConfig": {
            "defaults": {
              "color": {
                "mode": "palette-classic"
              },
              "custom": {
                "axisBorderShow": false,
                "axisCenteredZero": false,
                "axisColorMode": "text",
                "axisLabel": "",
                "axisPlacement": "auto",
                "barAlignment": 0,
                "barWidthFactor": 0.6,
                "drawStyle": "line",
                "fillOpacity": 0,
                "gradientMode": "none",
                "hideFrom": {
                  "legend": false,
                  "tooltip": false,
                  "viz": false
                },
                "insertNulls": false,
                "lineInterpolation": "linear",
                "lineWidth": 1,
                "pointSize": 5,
                "scaleDistribution": {
                  "type": "linear"
                },
                "showPoints": "auto",
                "spanNulls": false,
                "stacking": {
                  "group": "A",
                  "mode": "none"
                },
                "thresholdsStyle": {
                  "mode": "off"
                }
              },
              "mappings": [],
              "thresholds": {
                "mode": "absolute",
                "steps": [
                  {
                    "color": "green",
                    "value": null
                  },
                  {
                    "color": "red",
                    "value": 80
                  }
                ]
              },
              "unit": "percentunit"
            },
            "overrides": []
          },
          "gridPos": {
            "h": 8,
            "w": 12,
            "x": 12,
            "y": 16
          },
          "id": 4,
          "options": {
            "legend": {
              "calcs": [],
              "displayMode": "list",
              "placement": "bottom",
              "showLegend": true
            },
            "tooltip": {
              "mode": "single",
              "sort": "none"
            }
          },
          "targets": [
            {
              "datasource": {
                "type": "prometheus",
                "uid": "${DS_PROMETHEUS}"
              },
              "editorMode": "code",
              "expr": "vllm:gpu_cache_usage_perc{model_name=\"$model_name\"}",
              "instant": false,
              "legendFormat": "GPU Cache Usage({{ kubernetes_pod_name }})",
              "range": true,
              "refId": "A"
            },
            {
              "datasource": {
                "type": "prometheus",
                "uid": "${DS_PROMETHEUS}"
              },
              "editorMode": "code",
              "expr": "vllm:cpu_cache_usage_perc{model_name=\"$model_name\"}",
              "hide": false,
              "instant": false,
              "legendFormat": "CPU Cache Usage({{ kubernetes_pod_name }})",
              "range": true,
              "refId": "B"
            }
          ],
          "title": "Cache Utilization",
          "type": "timeseries"
        },
        {
          "datasource": {
            "type": "prometheus",
            "uid": "${DS_PROMETHEUS}"
          },
          "description": "Heatmap of request prompt length",
          "fieldConfig": {
            "defaults": {
              "custom": {
                "hideFrom": {
                  "legend": false,
                  "tooltip": false,
                  "viz": false
                },
                "scaleDistribution": {
                  "type": "linear"
                }
              }
            },
            "overrides": []
          },
          "gridPos": {
            "h": 8,
            "w": 12,
            "x": 0,
            "y": 24
          },
          "id": 12,
          "options": {
            "calculate": false,
            "cellGap": 1,
            "cellValues": {
              "unit": "none"
            },
            "color": {
              "exponent": 0.5,
              "fill": "dark-orange",
              "min": 0,
              "mode": "scheme",
              "reverse": false,
              "scale": "exponential",
              "scheme": "Spectral",
              "steps": 64
            },
            "exemplars": {
              "color": "rgba(255,0,255,0.7)"
            },
            "filterValues": {
              "le": 1e-9
            },
            "legend": {
              "show": true
            },
            "rowsFrame": {
              "layout": "auto",
              "value": "Request count"
            },
            "tooltip": {
              "mode": "single",
              "showColorScale": false,
              "yHistogram": true
            },
            "yAxis": {
              "axisLabel": "Prompt Length",
              "axisPlacement": "left",
              "reverse": false,
              "unit": "none"
            }
          },
          "pluginVersion": "11.2.0",
          "targets": [
            {
              "datasource": {
                "type": "prometheus",
                "uid": "${DS_PROMETHEUS}"
              },
              "disableTextWrap": false,
              "editorMode": "builder",
              "expr": "sum by(le) (increase(vllm:request_prompt_tokens_bucket{model_name=\"$model_name\"}[$__rate_interval]))",
              "format": "heatmap",
              "fullMetaSearch": false,
              "includeNullMetadata": true,
              "instant": false,
              "legendFormat": "{{le}}",
              "range": true,
              "refId": "A",
              "useBackend": false
            }
          ],
          "title": "Request Prompt Length",
          "type": "heatmap"
        },
        {
          "datasource": {
            "type": "prometheus",
            "uid": "${DS_PROMETHEUS}"
          },
          "description": "Heatmap of request generation length",
          "fieldConfig": {
            "defaults": {
              "custom": {
                "hideFrom": {
                  "legend": false,
                  "tooltip": false,
                  "viz": false
                },
                "scaleDistribution": {
                  "type": "linear"
                }
              }
            },
            "overrides": []
          },
          "gridPos": {
            "h": 8,
            "w": 12,
            "x": 12,
            "y": 24
          },
          "id": 13,
          "options": {
            "calculate": false,
            "cellGap": 1,
            "cellValues": {
              "unit": "none"
            },
            "color": {
              "exponent": 0.5,
              "fill": "dark-orange",
              "min": 0,
              "mode": "scheme",
              "reverse": false,
              "scale": "exponential",
              "scheme": "Spectral",
              "steps": 64
            },
            "exemplars": {
              "color": "rgba(255,0,255,0.7)"
            },
            "filterValues": {
              "le": 1e-9
            },
            "legend": {
              "show": true
            },
            "rowsFrame": {
              "layout": "auto",
              "value": "Request count"
            },
            "tooltip": {
              "mode": "single",
              "showColorScale": false,
              "yHistogram": true
            },
            "yAxis": {
              "axisLabel": "Generation Length",
              "axisPlacement": "left",
              "reverse": false,
              "unit": "none"
            }
          },
          "pluginVersion": "11.2.0",
          "targets": [
            {
              "datasource": {
                "type": "prometheus",
                "uid": "${DS_PROMETHEUS}"
              },
              "disableTextWrap": false,
              "editorMode": "builder",
              "expr": "sum by(le) (increase(vllm:request_generation_tokens_bucket{model_name=\"$model_name\"}[$__rate_interval]))",
              "format": "heatmap",
              "fullMetaSearch": false,
              "includeNullMetadata": true,
              "instant": false,
              "legendFormat": "{{le}}",
              "range": true,
              "refId": "A",
              "useBackend": false
            }
          ],
          "title": "Request Generation Length",
          "type": "heatmap"
        },
        {
          "datasource": {
            "type": "prometheus",
            "uid": "${DS_PROMETHEUS}"
          },
          "description": "Number of finished requests by their finish reason: either an EOS token was generated or the max sequence length was reached.",
          "fieldConfig": {
            "defaults": {
              "color": {
                "mode": "palette-classic"
              },
              "custom": {
                "axisBorderShow": false,
                "axisCenteredZero": false,
                "axisColorMode": "text",
                "axisLabel": "",
                "axisPlacement": "auto",
                "barAlignment": 0,
                "barWidthFactor": 0.6,
                "drawStyle": "line",
                "fillOpacity": 0,
                "gradientMode": "none",
                "hideFrom": {
                  "legend": false,
                  "tooltip": false,
                  "viz": false
                },
                "insertNulls": false,
                "lineInterpolation": "linear",
                "lineWidth": 1,
                "pointSize": 5,
                "scaleDistribution": {
                  "type": "linear"
                },
                "showPoints": "auto",
                "spanNulls": false,
                "stacking": {
                  "group": "A",
                  "mode": "none"
                },
                "thresholdsStyle": {
                  "mode": "off"
                }
              },
              "mappings": [],
              "thresholds": {
                "mode": "absolute",
                "steps": [
                  {
                    "color": "green"
                  },
                  {
                    "color": "red",
                    "value": 80
                  }
                ]
              }
            },
            "overrides": []
          },
          "gridPos": {
            "h": 8,
            "w": 12,
            "x": 0,
            "y": 32
          },
          "id": 11,
          "options": {
            "legend": {
              "calcs": [],
              "displayMode": "list",
              "placement": "bottom",
              "showLegend": true
            },
            "tooltip": {
              "mode": "single",
              "sort": "none"
            }
          },
          "targets": [
            {
              "datasource": {
                "type": "prometheus",
                "uid": "${DS_PROMETHEUS}"
              },
              "disableTextWrap": false,
              "editorMode": "builder",
              "expr": "sum by(finished_reason) (increase(vllm:request_success_total{model_name=\"$model_name\"}[$__rate_interval]))",
              "fullMetaSearch": false,
              "includeNullMetadata": true,
              "instant": false,
              "interval": "",
              "legendFormat": "__auto",
              "range": true,
              "refId": "A",
              "useBackend": false
            }
          ],
          "title": "Finish Reason",
          "type": "timeseries"
        },
        {
          "datasource": {
            "default": false,
            "type": "prometheus",
            "uid": "${DS_PROMETHEUS}"
          },
          "fieldConfig": {
            "defaults": {
              "color": {
                "mode": "palette-classic"
              },
              "custom": {
                "axisBorderShow": false,
                "axisCenteredZero": false,
                "axisColorMode": "text",
                "axisLabel": "seconds",
                "axisPlacement": "auto",
                "barAlignment": 0,
                "barWidthFactor": 0.6,
                "drawStyle": "line",
                "fillOpacity": 0,
                "gradientMode": "none",
                "hideFrom": {
                  "legend": false,
                  "tooltip": false,
                  "viz": false
                },
                "insertNulls": false,
                "lineInterpolation": "linear",
                "lineWidth": 1,
                "pointSize": 5,
                "scaleDistribution": {
                  "type": "linear"
                },
                "showPoints": "auto",
                "spanNulls": false,
                "stacking": {
                  "group": "A",
                  "mode": "none"
                },
                "thresholdsStyle": {
                  "mode": "off"
                }
              },
              "mappings": [],
              "thresholds": {
                "mode": "absolute",
                "steps": [
                  {
                    "color": "green"
                  },
                  {
                    "color": "red",
                    "value": 80
                  }
                ]
              }
            },
            "overrides": []
          },
          "gridPos": {
            "h": 8,
            "w": 12,
            "x": 12,
            "y": 32
          },
          "id": 14,
          "options": {
            "legend": {
              "calcs": [],
              "displayMode": "list",
              "placement": "bottom",
              "showLegend": true
            },
            "tooltip": {
              "mode": "single",
              "sort": "none"
            }
          },
          "targets": [
            {
              "datasource": {
                "type": "prometheus",
                "uid": "${DS_PROMETHEUS}"
              },
              "disableTextWrap": false,
              "editorMode": "code",
              "expr": "rate(vllm:request_queue_time_seconds_sum{model_name=\"$model_name\"}[$__rate_interval])",
              "fullMetaSearch": false,
              "includeNullMetadata": true,
              "instant": false,
              "legendFormat": "{{kubernetes_pod_name}}",
              "range": true,
              "refId": "A",
              "useBackend": false
            }
          ],
          "title": "Queue Time",
          "type": "timeseries"
        },
        {
          "datasource": {
            "default": false,
            "type": "prometheus",
            "uid": "${DS_PROMETHEUS}"
          },
          "fieldConfig": {
            "defaults": {
              "color": {
                "mode": "palette-classic"
              },
              "custom": {
                "axisBorderShow": false,
                "axisCenteredZero": false,
                "axisColorMode": "text",
                "axisLabel": "",
                "axisPlacement": "auto",
                "barAlignment": 0,
                "barWidthFactor": 0.6,
                "drawStyle": "line",
                "fillOpacity": 0,
                "gradientMode": "none",
                "hideFrom": {
                  "legend": false,
                  "tooltip": false,
                  "viz": false
                },
                "insertNulls": false,
                "lineInterpolation": "linear",
                "lineWidth": 1,
                "pointSize": 5,
                "scaleDistribution": {
                  "type": "linear"
                },
                "showPoints": "auto",
                "spanNulls": false,
                "stacking": {
                  "group": "A",
                  "mode": "none"
                },
                "thresholdsStyle": {
                  "mode": "off"
                }
              },
              "mappings": [],
              "thresholds": {
                "mode": "absolute",
                "steps": [
                  {
                    "color": "green"
                  },
                  {
                    "color": "red",
                    "value": 80
                  }
                ]
              }
            },
            "overrides": []
          },
          "gridPos": {
            "h": 8,
            "w": 12,
            "x": 0,
            "y": 40
          },
          "id": 15,
          "options": {
            "legend": {
              "calcs": [],
              "displayMode": "list",
              "placement": "bottom",
              "showLegend": true
            },
            "tooltip": {
              "mode": "single",
              "sort": "none"
            }
          },
          "targets": [
            {
              "datasource": {
                "type": "prometheus",
                "uid": "${DS_PROMETHEUS}"
              },
              "disableTextWrap": false,
              "editorMode": "code",
              "expr": "rate(vllm:request_prefill_time_seconds_sum{model_name=\"$model_name\"}[$__rate_interval])",
              "fullMetaSearch": false,
              "includeNullMetadata": true,
              "instant": false,
              "legendFormat": "Prefill",
              "range": true,
              "refId": "A",
              "useBackend": false
            },
            {
              "datasource": {
                "type": "prometheus",
                "uid": "${DS_PROMETHEUS}"
              },
              "editorMode": "code",
              "expr": "rate(vllm:request_decode_time_seconds_sum{model_name=\"$model_name\"}[$__rate_interval])",
              "hide": false,
              "instant": false,
              "legendFormat": "Decode",
              "range": true,
              "refId": "B"
            }
          ],
          "title": "Requests Prefill and Decode Time",
          "type": "timeseries"
        },
        {
          "datasource": {
            "default": false,
            "type": "prometheus",
            "uid": "${DS_PROMETHEUS}"
          },
          "fieldConfig": {
            "defaults": {
              "color": {
                "mode": "palette-classic"
              },
              "custom": {
                "axisBorderShow": false,
                "axisCenteredZero": false,
                "axisColorMode": "text",
                "axisLabel": "",
                "axisPlacement": "auto",
                "barAlignment": 0,
                "barWidthFactor": 0.6,
                "drawStyle": "line",
                "fillOpacity": 0,
                "gradientMode": "none",
                "hideFrom": {
                  "legend": false,
                  "tooltip": false,
                  "viz": false
                },
                "insertNulls": false,
                "lineInterpolation": "linear",
                "lineWidth": 1,
                "pointSize": 5,
                "scaleDistribution": {
                  "type": "linear"
                },
                "showPoints": "auto",
                "spanNulls": false,
                "stacking": {
                  "group": "A",
                  "mode": "none"
                },
                "thresholdsStyle": {
                  "mode": "off"
                }
              },
              "mappings": [],
              "thresholds": {
                "mode": "absolute",
                "steps": [
                  {
                    "color": "green"
                  },
                  {
                    "color": "red",
                    "value": 80
                  }
                ]
              }
            },
            "overrides": []
          },
          "gridPos": {
            "h": 8,
            "w": 12,
            "x": 12,
            "y": 40
          },
          "id": 16,
          "options": {
            "legend": {
              "calcs": [],
              "displayMode": "list",
              "placement": "bottom",
              "showLegend": true
            },
            "tooltip": {
              "mode": "single",
              "sort": "none"
            }
          },
          "targets": [
            {
              "datasource": {
                "type": "prometheus",
                "uid": "${DS_PROMETHEUS}"
              },
              "disableTextWrap": false,
              "editorMode": "code",
              "expr": "rate(vllm:request_max_num_generation_tokens_sum{model_name=\"$model_name\"}[$__rate_interval])",
              "fullMetaSearch": false,
              "includeNullMetadata": true,
              "instant": false,
              "legendFormat": "Tokens",
              "range": true,
              "refId": "A",
              "useBackend": false
            }
          ],
          "title": "Max Generation Token in Sequence Group",
          "type": "timeseries"
        }
      ],
      "refresh": "",
      "schemaVersion": 39,
      "tags": [],
      "templating": {
        "list": [
          {
            "current": {
              "selected": false,
              "text": "prometheus",
              "value": "edx8memhpd9tsa"
            },
            "hide": 0,
            "includeAll": false,
            "label": "datasource",
            "multi": false,
            "name": "DS_PROMETHEUS",
            "options": [],
            "query": "prometheus",
            "queryValue": "",
            "refresh": 1,
            "regex": "",
            "skipUrlSync": false,
            "type": "datasource"
          },
          {
            "current": {
              "selected": false,
              "text": "/share/datasets/public_models/Meta-Llama-3-8B-Instruct",
              "value": "/share/datasets/public_models/Meta-Llama-3-8B-Instruct"
            },
            "datasource": {
              "type": "prometheus",
              "uid": "${DS_PROMETHEUS}"
            },
            "definition": "label_values(model_name)",
            "hide": 0,
            "includeAll": false,
            "label": "model_name",
            "multi": false,
            "name": "model_name",
            "options": [],
            "query": {
              "query": "label_values(model_name)",
              "refId": "StandardVariableQuery"
            },
            "refresh": 1,
            "regex": "",
            "skipUrlSync": false,
            "sort": 0,
            "type": "query"
          }
        ]
      },
      "time": {
        "from": "now-5m",
        "to": "now"
      },
      "timepicker": {},
      "timezone": "",
      "title": "vLLM"
    }

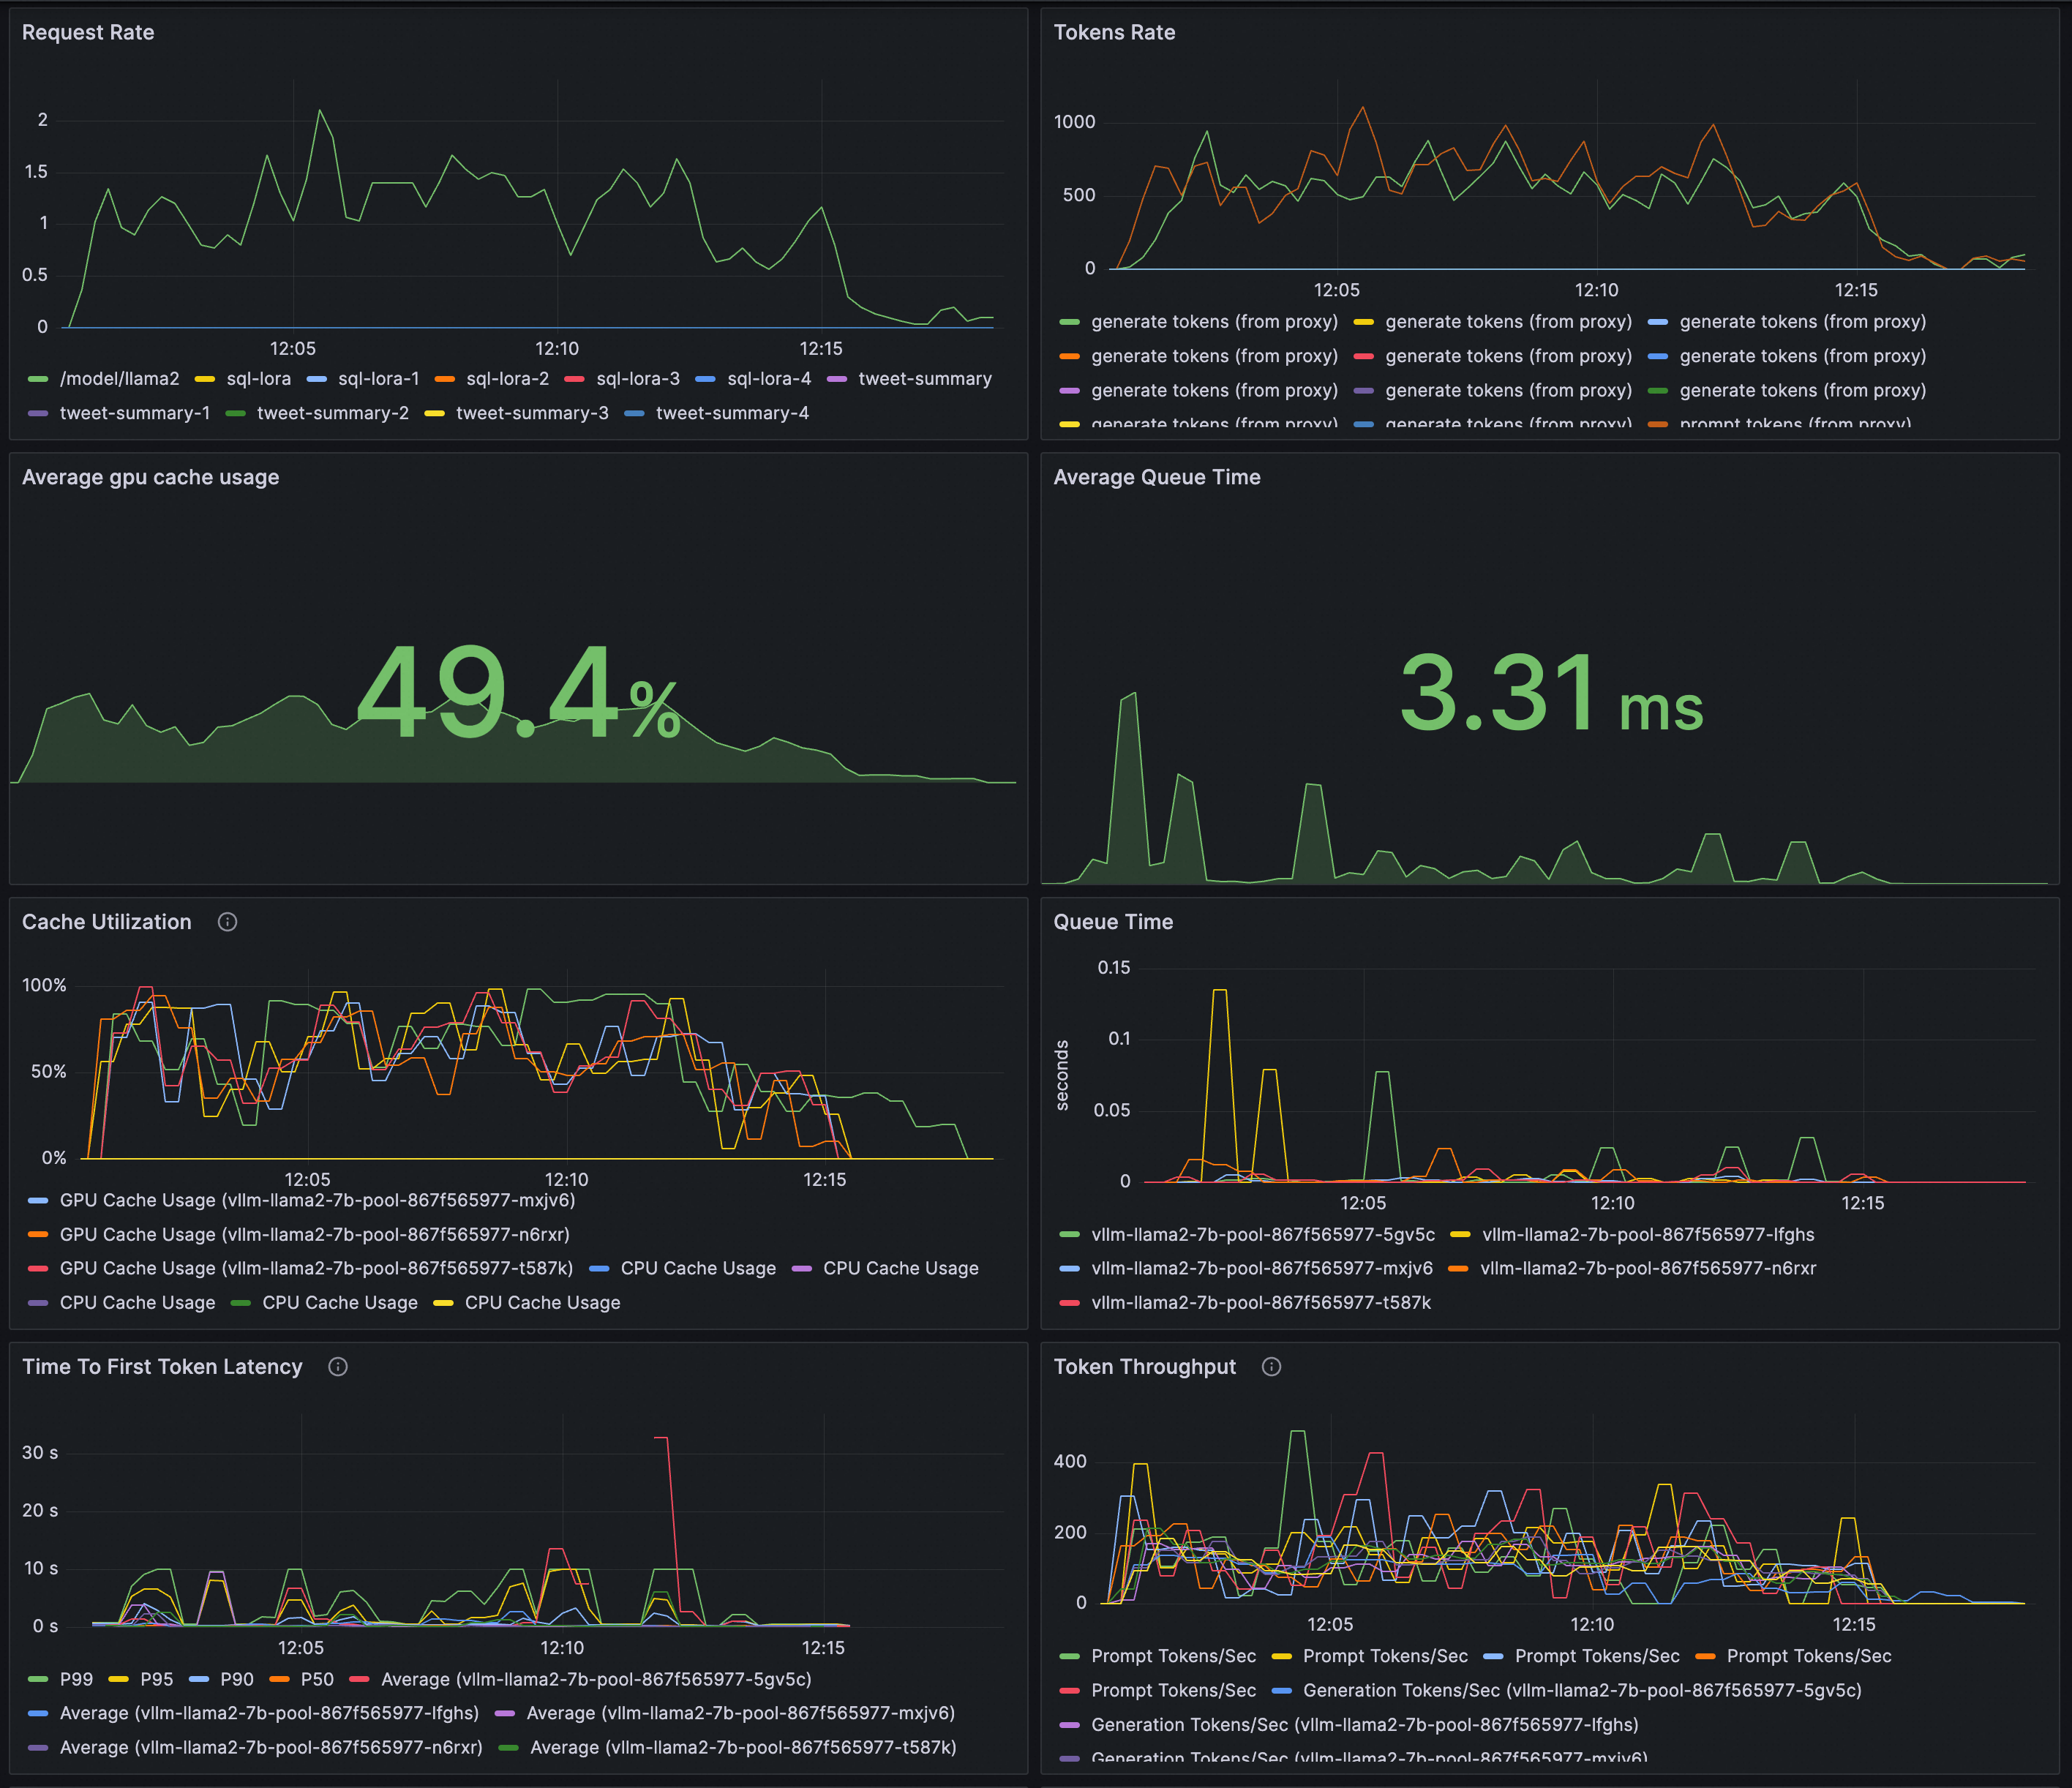
    Visualização:

    image

  3. Use um cluster ACK e o vllm benchmark para realizar testes de estresse em um service de inferência e comparar o balanceamento de carga entre o roteamento HTTP padrão e o roteamento do service de inferência.

    1. Implante o workload de teste de estresse.

      kubectl apply -f- <<EOF
      apiVersion: apps/v1
      kind: Deployment
      metadata:
        labels:
          app: vllm-benchmark
        name: vllm-benchmark
        namespace: default
      spec:
        progressDeadlineSeconds: 600
        replicas: 1
        revisionHistoryLimit: 10
        selector:
          matchLabels:
            app: vllm-benchmark
        strategy:
          rollingUpdate:
            maxSurge: 25%
            maxUnavailable: 25%
          type: RollingUpdate
        template:
          metadata:
            creationTimestamp: null
            labels:
              app: vllm-benchmark
          spec:
            containers:
            - command:
              - sh
              - -c
              - sleep inf
              image: registry-cn-hangzhou.ack.aliyuncs.com/dev/llm-benchmark:random-and-qa
              imagePullPolicy: IfNotPresent
              name: vllm-benchmark
              resources: {}
              terminationMessagePath: /dev/termination-log
              terminationMessagePolicy: File
            dnsPolicy: ClusterFirst
            restartPolicy: Always
            schedulerName: default-scheduler
            securityContext: {}
            terminationGracePeriodSeconds: 30
      EOF
    2. Inicie o teste de estresse.

      1. Obtenha o endereço IP interno do gateway.

        export GW_IP=$(kubectl get svc -n envoy-gateway-system -l gateway.envoyproxy.io/owning-gateway-namespace=default,gateway.envoyproxy.io/owning-gateway-name=qwen-inference-gateway -o jsonpath='{.items[0].spec.clusterIP}')
      2. Execute o teste de estresse.

        Roteamento HTTP padrão

        kubectl exec -it deploy/vllm-benchmark -- env GW_IP=${GW_IP} python3 /root/vllm/benchmarks/benchmark_serving.py \
        --backend vllm \
        --model /models/DeepSeek-R1-Distill-Qwen-7B \
        --served-model-name /model/qwen \
        --trust-remote-code \
        --dataset-name random \
        --random-prefix-len 10 \
        --random-input-len 1550 \
        --random-output-len 1800 \
        --random-range-ratio 0.2 \
        --num-prompts 3000 \
        --max-concurrency 200 \
        --host $GW_IP \
        --port 8080 \
        --endpoint /v1/completions \
        --save-result \
        2>&1 | tee benchmark_serving.txt

        Roteamento do service de inferência

        kubectl exec -it deploy/vllm-benchmark -- env GW_IP=${GW_IP} python3 /root/vllm/benchmarks/benchmark_serving.py \
        --backend vllm \
        --model /models/DeepSeek-R1-Distill-Qwen-7B \
        --served-model-name /model/qwen \
        --trust-remote-code \
        --dataset-name random \
        --random-prefix-len 10 \
        --random-input-len 1550 \
        --random-output-len 1800 \
        --random-range-ratio 0.2 \
        --num-prompts 3000 \
        --max-concurrency 200 \
        --host $GW_IP \
        --port 8081 \
        --endpoint /v1/completions \
        --save-result \
        2>&1 | tee benchmark_serving.txt

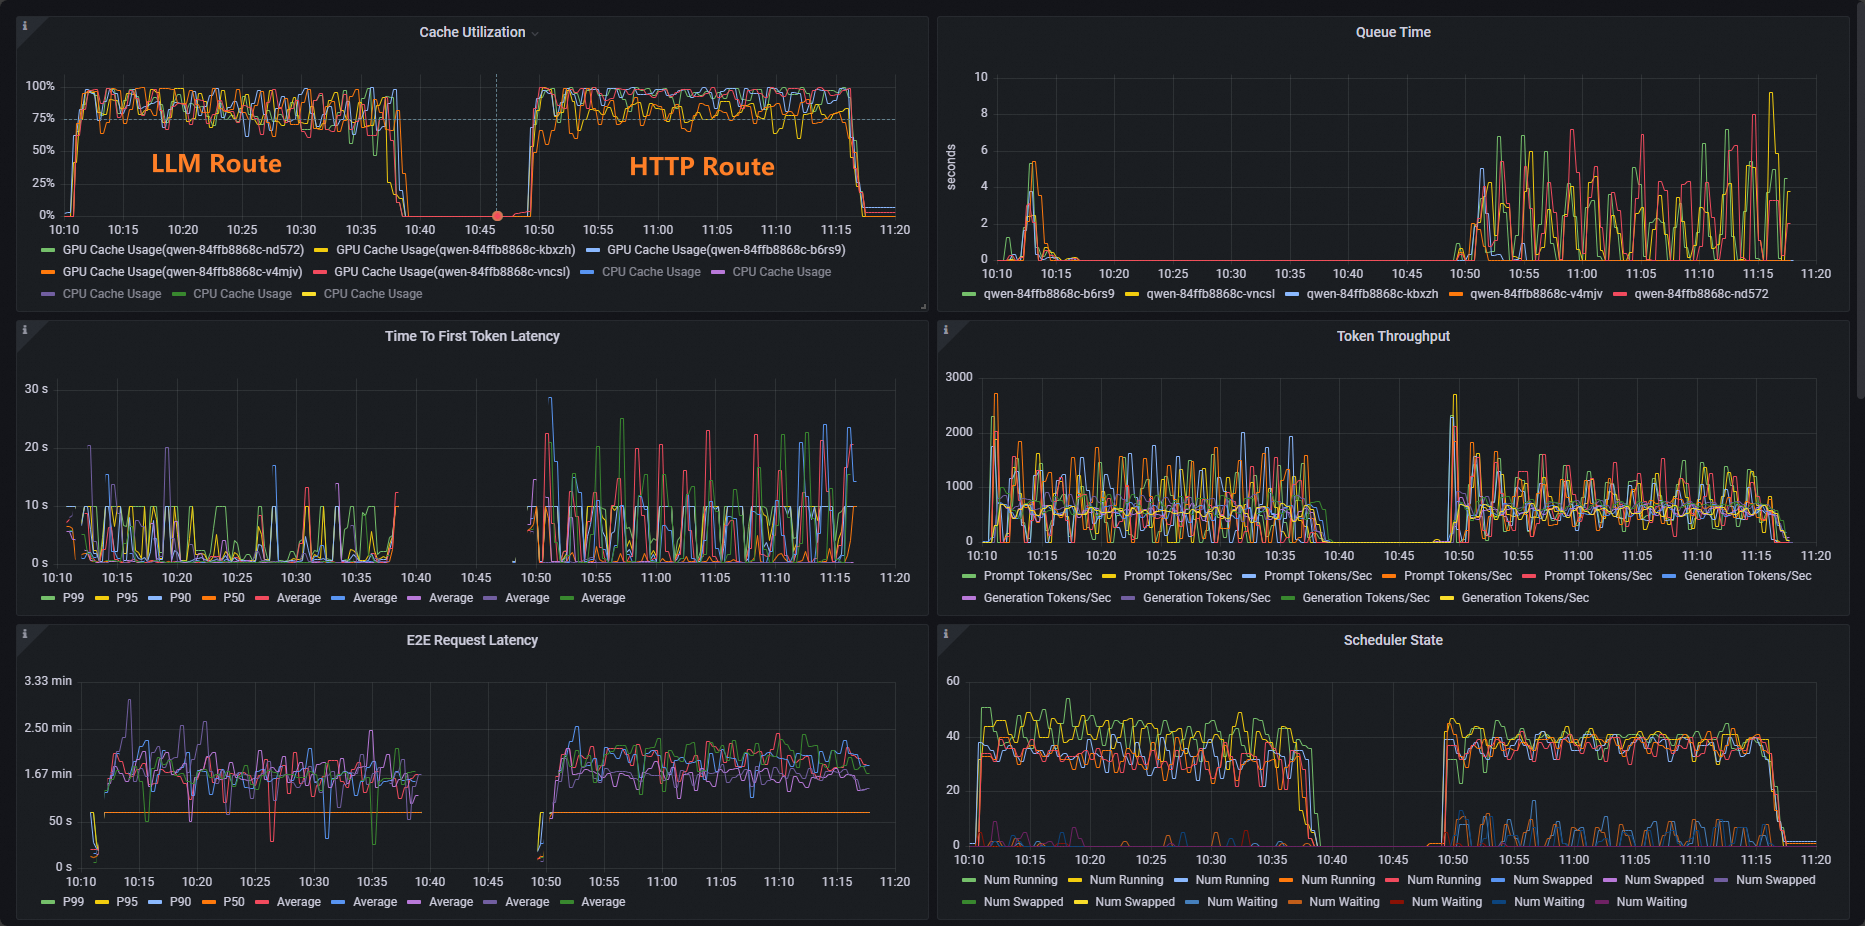
    Após a conclusão dos testes, o painel exibe uma comparação do balanceamento de carga entre o roteamento HTTP padrão e o roteamento do service de inferência.
    49c8528de7c25b87093795a1bac152fc

    Os workloads que usam roteamento HTTP padrão apresentam uma distribuição desigual da utilização de cache, enquanto aqueles que utilizam o roteamento do service de inferência mantêm uma distribuição equilibrada.

Próximas etapas

O Gateway with Inference Extension oferece suporte a várias políticas de balanceamento de carga para diferentes casos de uso de serviços de inferência. Aplique uma política de balanceamento de carga às requisições de inferência roteadas para pods em um InferencePool adicionando a annotation inference.networking.x-k8s.io/routing-strategy ao recurso InferencePool.

O exemplo a seguir seleciona pods do service de inferência usando o seletor app: vllm-app e aplica a política de balanceamento de carga padrão, baseada em métricas do servidor de inferência.

apiVersion: inference.networking.x-k8s.io/v1alpha2
kind: InferencePool
metadata:
  name: vllm-app-pool
  annotations:
    inference.networking.x-k8s.io/routing-strategy: "DEFAULT"
spec:
  targetPortNumber: 8000
  selector:
    app: vllm-app
  extensionRef:
    name: inference-gateway-ext-proc

As seguintes políticas de balanceamento de carga são suportadas:

Política

Descrição

DEFAULT

Política de balanceamento de carga padrão baseada em métricas do servidor de inferência. Essa política avalia o estado interno de cada servidor de inferência usando múltiplas métricas, incluindo o tamanho da fila de requisições e a utilização do cache da GPU, distribuindo o tráfego de acordo com esses indicadores.

PREFIX_CACHE

Política de balanceamento de carga por correspondência de prefixo de requisição. Essa política roteia requisições que compartilham um prefixo comum para o mesmo pod do servidor de inferência. É ideal para cenários com alto volume dessas requisições, especialmente quando o servidor de inferência tem o cache automático de prefixos ativado.

Casos de uso típicos incluem:

  • Consultas a documentos longos: Um usuário consulta repetidamente o mesmo documento extenso, como um manual de software ou um relatório anual, fazendo perguntas diferentes.

  • Conversas com múltiplas turnos: Um usuário interage com uma aplicação várias vezes na mesma sessão de chat.