レーダーチャートを使用して、Simple Log Serviceの多次元データを視覚化できます。 このトピックでは、レーダーチャートの基本構成について説明します。
背景情報
レーダーチャートを使用して、同じ次元のデータの複数の列を比較できます。
たとえば、クエリステートメントの結果には、request_method列、total列、avg_time列、avg_length列が含まれます。 total、avg_time、およびavg_lengthの列は、特定の期間内の各リクエストメソッドのリクエストの総数、平均リクエスト時間、および平均リクエスト長を示します。 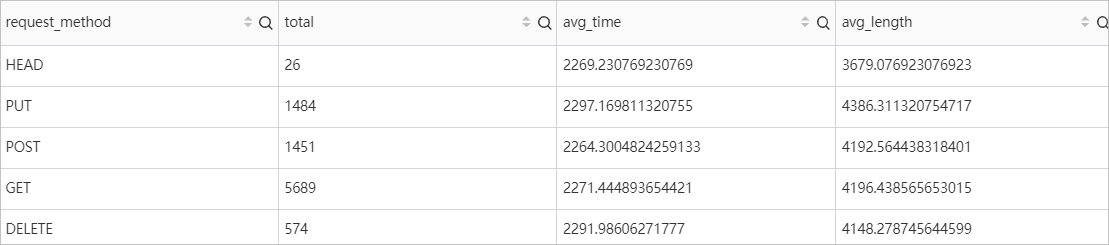
この場合、レーダーチャートを使用して、各リクエストメソッドの前の列のデータを視覚化できます。 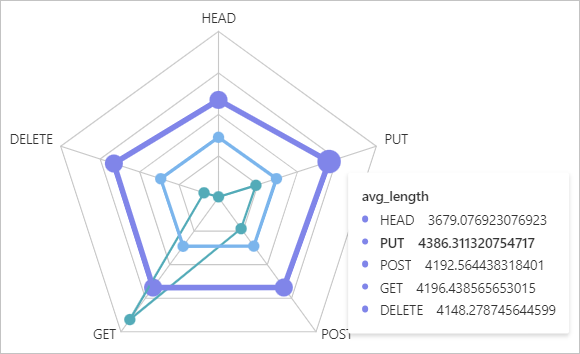
[共通設定] タブ
[共通設定] タブで、レーダーチャートのグローバル設定を構成できます。
基本設定セクション
パラメーター
説明
タイトル
レーダーチャートのタイトル。
ショータイトル
[タイトルの表示] をオンにすると、レーダーチャートのタイトルが表示されます。
国境を表示
[境界線の表示] をオンにすると、レーダーチャートの境界線が表示されます。
ショーの背景
[背景の表示] をオンにすると、レーダーチャートの背景色が表示されます。
ショータイム
[時間の表示] をオンにすると、レーダーチャートのクエリ時間範囲が表示されます。
固定時間
固定時間をオンにすると、ダッシュボードのグローバル時間範囲が変更されても、指定された時間範囲は変更されません。
標準構成セクション
パラメーター
説明
Format
数値の表示形式。
単位
数値の単位。
小数点後の桁数
数値の小数点以下の桁数。
表示名
列の名前。
表示名を指定した場合は、各列の名前が表示名に変更されます。 列の名前を変更する場合は、[フィールド] タブで名前を設定できます。
カラースキーム
レーダーチャートの列の色を指定する配色。
組み込み: 組み込みの配色が使用されます。
ソリッド: カラーを選択できます。
クエリと分析セクションの設定
パラメーター
説明
カテゴリ
データを表示するディメンションを指定するフィールド。
値列
表示する数値を指定するフィールド。
レーダーチャート设定セクション
パラメーター
説明
レーダーチャートタイプ
レーダーチャートの形状。 有効な値: PolygonとCircle。
チャートの構成セクション
パラメーター
説明
ポイントサイズ
レーダーチャートのポイントのサイズ。
コネクタ幅
レーダーチャートのコネクタの幅。
凡例の構成セクション
パラメーター
説明
表示凡例
[凡例の表示] をオンにすると、凡例がレーダーチャートに表示されます。
凡例
チャート内の凡例の位置。
アクション
凡例の列を表示するために使用されるメソッド。
Single: 凡例の列名をクリックすると、その列のデータのみがレーダーチャットに表示されます。
スイッチ: 凡例で列名をクリックすると、列のデータが非表示になるか、レーダーチャートに表示されます。
最大幅 (高さ) %
凡例の最大幅または高さ。
[フィールド] タブ
単一のクエリステートメントの結果または結果の単一の列に対して、カスタム表示設定を構成できます。 [フィールド] タブのパラメーターの詳細については、「共通設定タブ」をご参照ください。
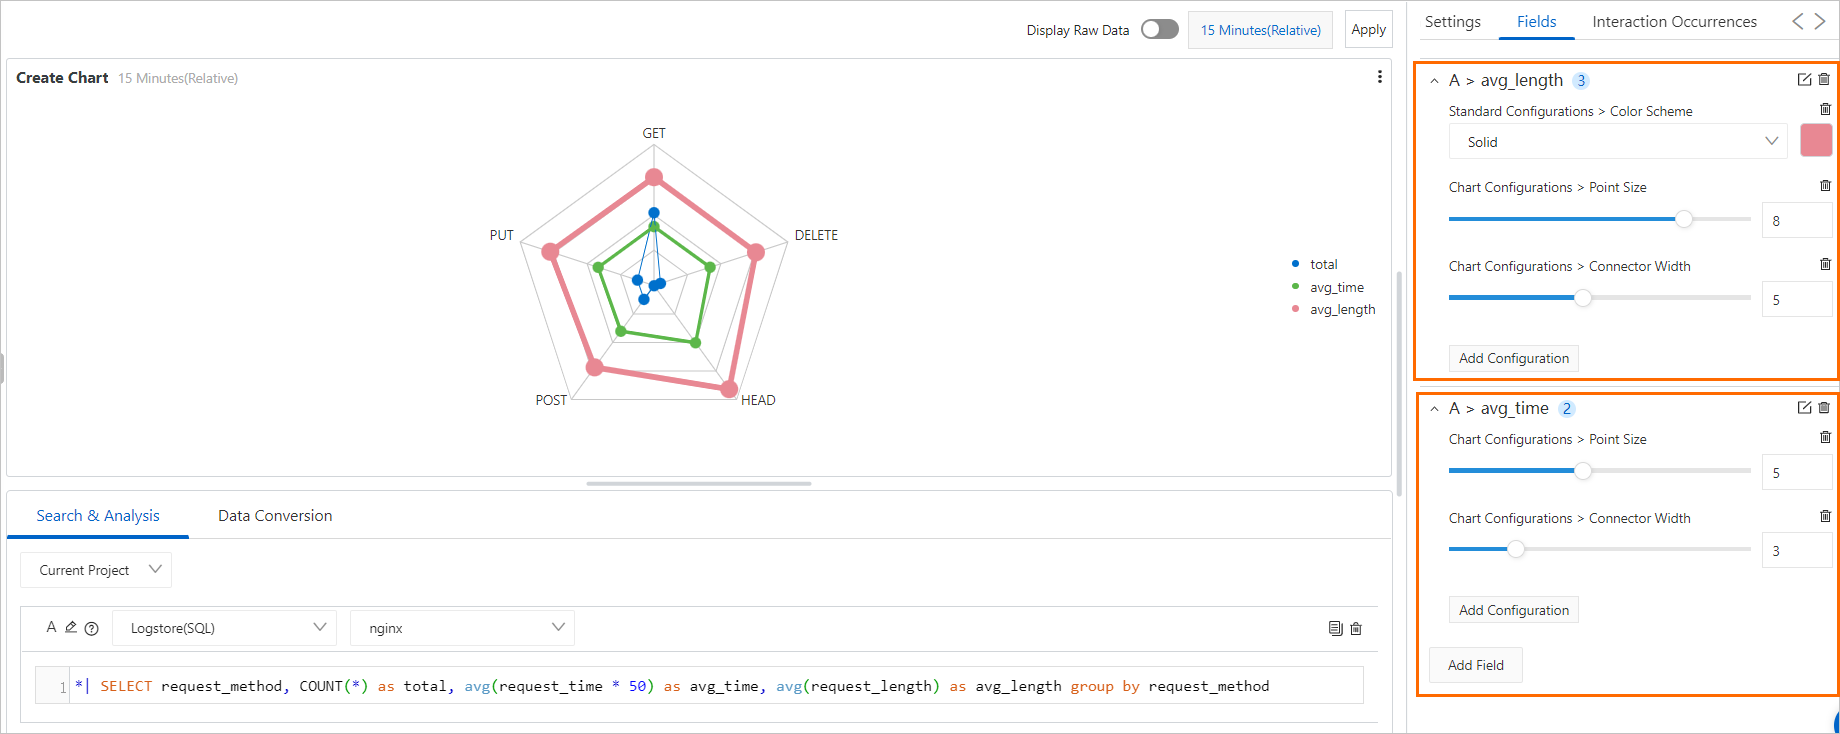
[フィールド] タブでは、ビジネス要件に基づいて各列のコネクタの色と幅を指定できます。 次の図は、サンプルのレーダーチャートを示しています。
この例では、A > avg_lengthフィールドを追加して、クエリ文Aの結果のavg_length列を設定します。コネクタの色はピンクに設定され、コネクタの幅は5に設定され、ポイントのサイズは8に設定されます。
この例では、A > avg_timeフィールドを追加して、クエリ文Aの結果のavg_time列を設定します。コネクタの幅は3に設定され、ポイントのサイズは5に設定されます。
インタラクションの発生
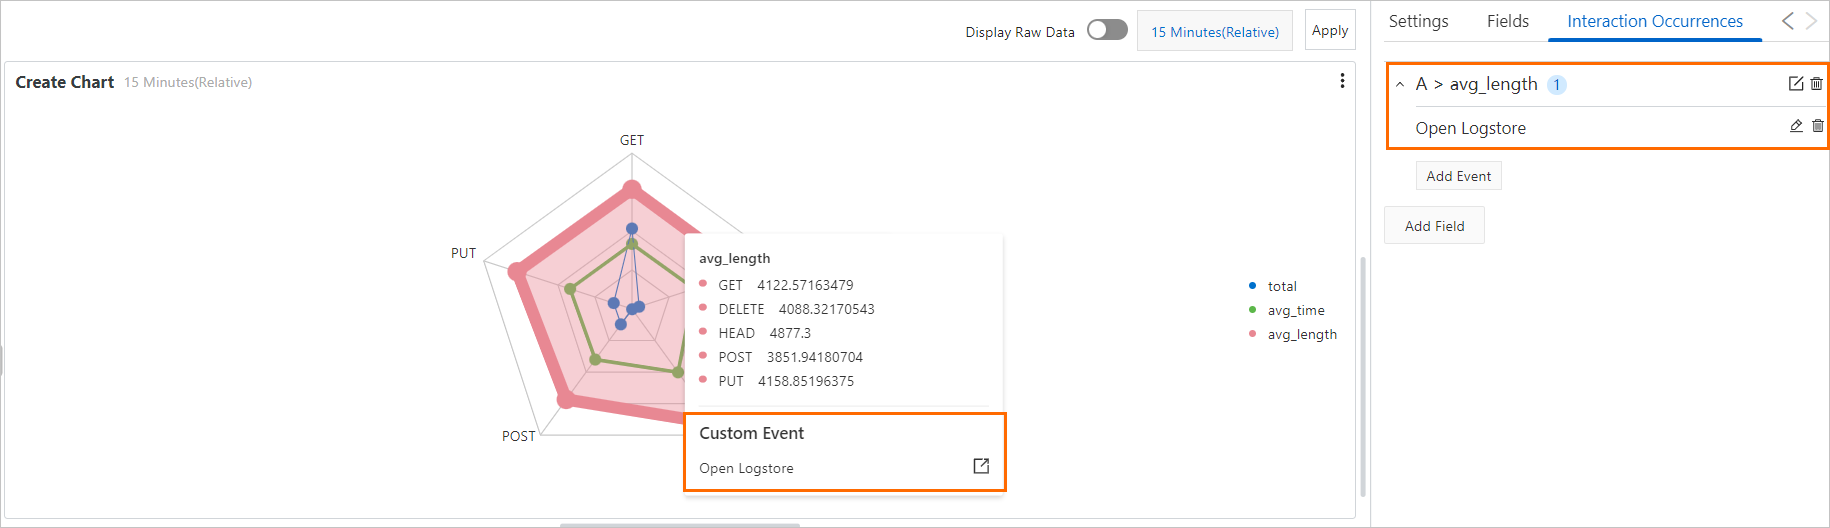
インタラクションの発生は、単一のフィールドまたは単一のクエリステートメントの結果を分析して、データからより深い値を抽出するように構成されています。 インタラクションの発生には、Logstoreを開く、保存した検索を開く、ダッシュボードを開く、トレース分析を開く、トレースの詳細を開く、カスタムHTTPリンクを作成するイベントが含まれます。 詳細については、「ドリルダウンイベント」をご参照ください。
たとえば、A > avg_lengthフィールドを追加して、クエリ文Aの結果のavg_length列のインタラクションの発生を設定できます。クエリ文Aの結果のavg_length列のOpen Logstoreインタラクションの発生を設定したら、ピンクのコネクタのポイントをクリックして、Logstoreを開くをクリックします。 インタラクションの発生で指定したLogstoreにリダイレクトされます。