クロステーブルは主にデータ分析シナリオで使用されます。 クロステーブルを使用すると、大量のログデータから有用なデータを効率的に抽出し、抽出したデータを視覚化できます。 このトピックでは、クロステーブルを設定する方法について説明します。 このトピックでは、クロステーブルの例も提供します。
概要
クロステーブルは、一度に2つ以上の変数のデータを表示できるテーブルレイアウトの形式です。 クロステーブルでは、1つの変数のカテゴリがクロステーブルの行にリストされ、別の変数のカテゴリがクロステーブルの列にリストされます。 クロステーブルの各セルには、指定されたカテゴリの組み合わせに基づいて、2つの変数の出現回数または比率が表示されます。
クロステーブルを追加するエントリポイントの詳細については、「ダッシュボードにグラフを追加する」をご参照ください。
設定例
Simple Log Service コンソールにログインします。 [プロジェクト] セクションで、目的のプロジェクトをクリックします。
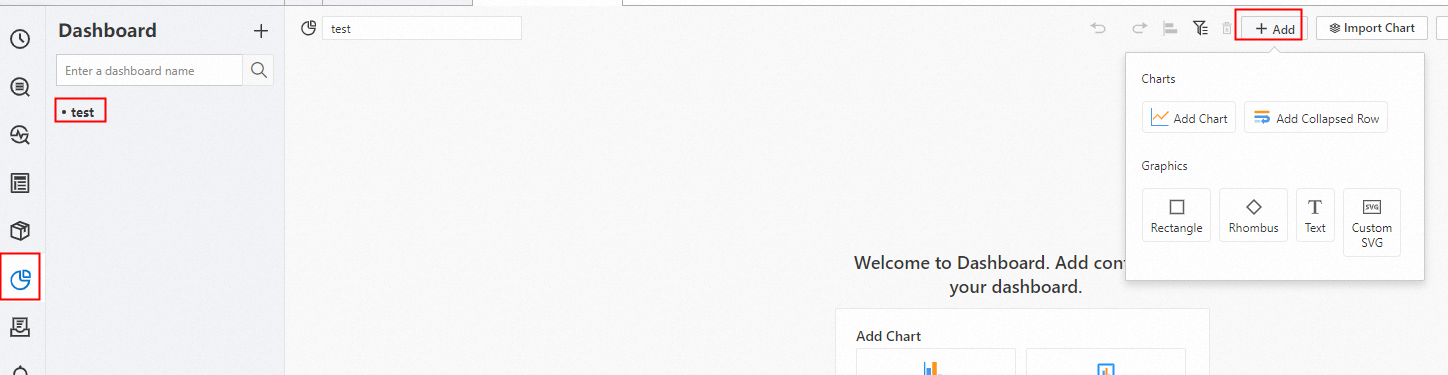
左側のナビゲーションウィンドウで、[ダッシュボード]> [ダッシュボード] を選択します。 ダッシュボードリストで、目的のダッシュボードをクリックします。 ダッシュボードページの右上隅にある [編集] をクリックします。 編集モードで、[追加] > [グラフの追加] をクリックします。
[グラフの編集] ページの右側で、[グラフの種類] セクションの [クロステーブル] を選択し、次の図に基づいて [クエリと分析の設定] セクションのパラメーターを設定します。 [チャートの編集] ページの左側で、クロステーブルのクエリ時間範囲、Logstore、およびクエリステートメントを設定します。 設定が完了したら、[チャートの編集] ページの上部にある [適用] をクリックして、クロステーブルの設定効果を表示します。
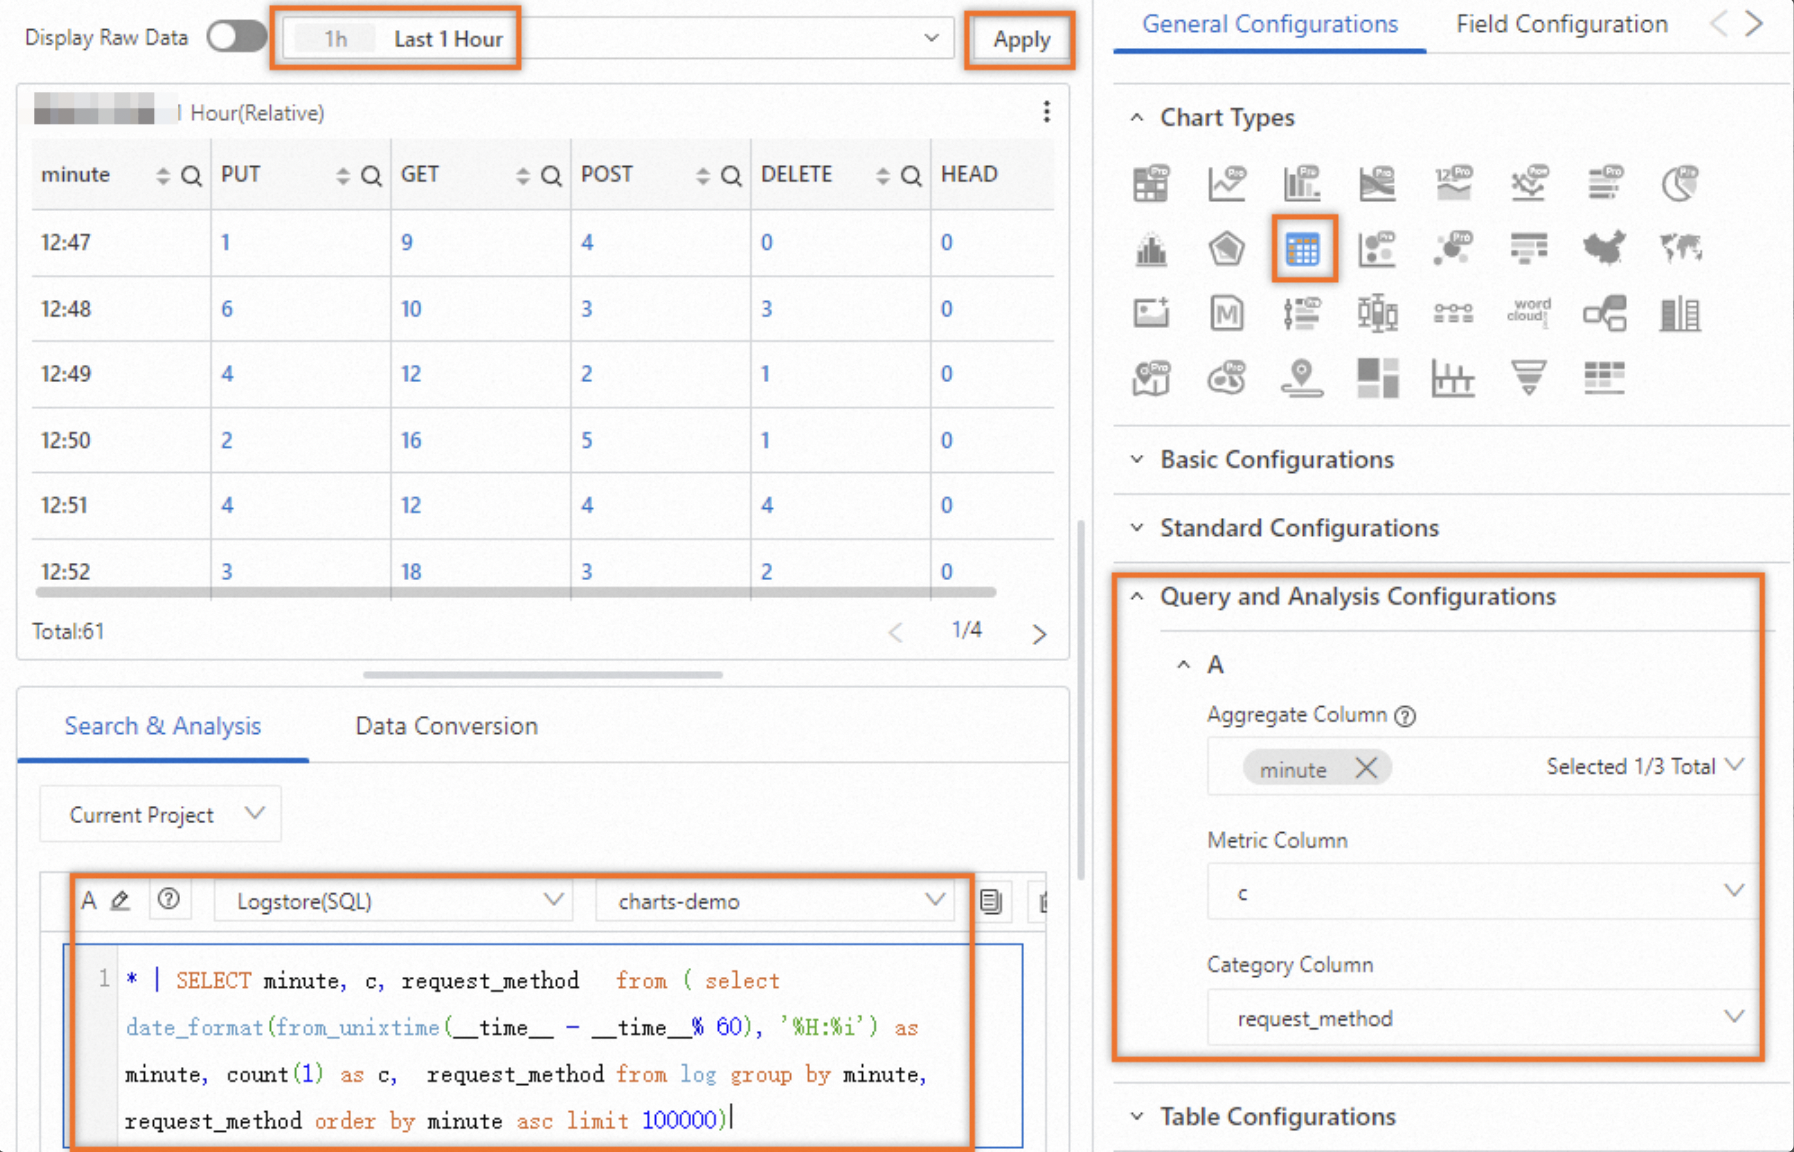
次のクエリステートメントは、リクエストメソッドによる1分あたりのリクエスト数をクエリするために使用されます。
* | SELECT minute, c, request_method from ( select date_format(from_unixtime(__time__ - __time__% 60), '%H:%i') as minute, count(1) as c, request_method from log group by minute, request_method order by minute asc limit 100000)
[一般的な構成] タブの構成
クロステーブルのグローバル設定は、[全般設定] タブで設定できます。
基本構成セクションのパラメータ
パラメーター
説明
タイトル
クロステーブルのタイトル。
表示タイトル
[タイトルの表示] をオンにすると、クロステーブルのタイトルが表示されます。
表示ボーダー
[枠の表示] をオンにすると、クロステーブルの枠が表示されます。
表示背景
[背景の表示] をオンにすると、クロステーブルの背景色が表示されます。
表示時間
[表示時間] をオンにすると、クロステーブルのクエリ時間範囲が表示されます。
固定時間
[固定時間] をオンにすると、クロステーブルのクエリ時間範囲はダッシュボードのグローバル時間範囲とは無関係になります。
[標準構成] セクションのパラメータ
パラメーター
説明
Format
数値の表示形式。
単位
数値の単位。
小数点後の桁数
数値の小数点以下の桁。
表示名
テーブルヘッダーの名前。
Display Nameパラメーターに値を指定した場合、その値はクロステーブルのすべてのヘッダーの名前として使用されます。 ヘッダーの名前を変更する場合は、[フィールド設定] タブでパラメーターを設定できます。
カラースキーム
クロステーブルの背景色とテキストの色を指定する配色。 有効な値:
組み込み: 組み込みのカラースキームを使用します。
ソリッド: 選択した色を使用します。
しきい値: 値に指定されたしきい値に基づいて、値ごとに異なる色を使用します。
[クエリと分析の構成] セクションのパラメーター
パラメーター
説明
集計列
データの集計に使用するフィールド。
メトリック列
クロステーブルに値を表示するメトリック。
カテゴリ列
データの分類に使用するフィールド。
[テーブル構成] セクションのパラメーター
パラメーター
説明
表示モード
クロステーブルの表示モード。 有効な値:
ページング: クロステーブルはページごとに表示されます。 [ページごとのアイテム] パラメーターを設定して、各ページに表示する行数を指定できます。
輪郭: クロステーブルは1ページに表示されます。 Row Heightパラメーターを設定して、1ページに表示する行の高さを指定できます。
表示ヘッダー
[ヘッダーの表示] をオンにすると、クロステーブルのヘッダーが表示されます。
合計
[合計] をオンにすると、合計行数がクロステーブルに表示されます。
透明な背景
[透明背景] をオンにすると、クロステーブルの背景が透明になります。
表示プログレスバータグ
[進行状況バータグの表示] をオンにすると、進行状況は進行状況バーに数値として表示されます。
このパラメーター設定は、セル表示モードパラメーターをプログレスバー、LCDプログレスバー、またはグラデーションプログレスバーに設定した場合にのみ有効になります。
[フィールド /列の設定] セクションのパラメータ
パラメーター
説明
最小コラム幅
クロステーブルの最小列幅。 単位: ピクセル。
[列の幅] パラメーターに対してautoを保持する場合、クロステーブルの列の幅は [最小列の幅] パラメーターの値以上になります。
列の幅
クロステーブルの最小列幅。
最大値
プログレスバーの最大値。 [最大値] パラメーターにautoを保持する場合は、列の最大値が使用されます。
セル表示モード
セルの表示モード。
このパラメーターを非表示に設定すると、色としきい値の設定が無効になります。
アライメント方法
セル内のコンテンツの整列方法。
ソートの無効化
[並べ替えの無効化] をオンにすると、並べ替えは無効になります。
検索の無効化
[検索の無効化] をオンにすると、検索は無効になります。
検索モード
クロステーブルのデータを検索するモード。 有効な値:
Search: 特定のメトリック値を検索します。 アイコンは、
 テーブルヘッダーに表示されます。
 フィルター: 特定のメトリック値をフィルターします。 アイコンは、
 テーブルヘッダーに表示されます。
複数の選択肢
クロステーブルのデータを検索するときに複数の選択を有効にするかどうかを指定します。 [複数選択] を選択した場合、検索ボックスまたはフィルターボックスで複数のメトリック値を指定できます。
正確な検索
正確な検索をオンにすると、指定された条件に完全に一致するメトリック値のみが返されます。
厳密検索をオフにすると、あいまい検索を実行できます。 たとえば、
abcを検索すると、abcを含むすべての値が返されます。
フォントサイズ
セル内のコンテンツのフォントサイズ。
[しきい値] セクションのパラメータ
パラメーター
説明
しきい値モード
しきい値モード。 有効な値:
絶対値: しきい値を絶対値として指定します。
パーセンテージ: しきい値をパーセンテージとして指定します。
しきい値
数値のしきい値。
[配色] パラメーターを [しきい値] に設定し、[しきい値] セクションでしきい値を指定した場合、クロステーブルのテキストと背景は、指定したしきい値に基づいて異なる色で表示されます。
変数置換セクションのパラメータ
パラメーター
説明
可変交換
変数の置き換えの設定。 [AddVariable Replacement] をクリックすると、[Variable Replacement] タイプのフィルターをクロステーブルに追加できます。 [一般的な設定] タブで変数置換の設定を行った後、Simple Log Serviceはクロステーブルの左上隅にフィルターを追加します。 フィルタードロップダウンリストから値を選択できます。 値を選択すると、クロステーブルのクエリステートメントの変数が、選択した値が示す変数値に自動的に置き換えられ、クエリおよび分析操作が実行されます。 詳細については、「例2: 変数置換の設定」をご参照ください。
値マッピングセクションのパラメータ
パラメーター
説明
値マッピング
クロステーブルの指定された値を置き換えるために使用するテキストまたはアイコン。
たとえば、Valueパラメーターを200に、Mapping TypeパラメーターをTextに、Mapping ValueパラメーターをSuccessに設定した場合、クロステーブルの200のすべての値がSuccessに置き換えられます。
ドキュメントセクションのパラメータ
パラメーター
説明
ドキュメントリンクの追加
カスタムドキュメントのリンクと説明を指定できるボタン。 設定を設定すると、指定された情報がクロステーブルの右上隅に表示されます。
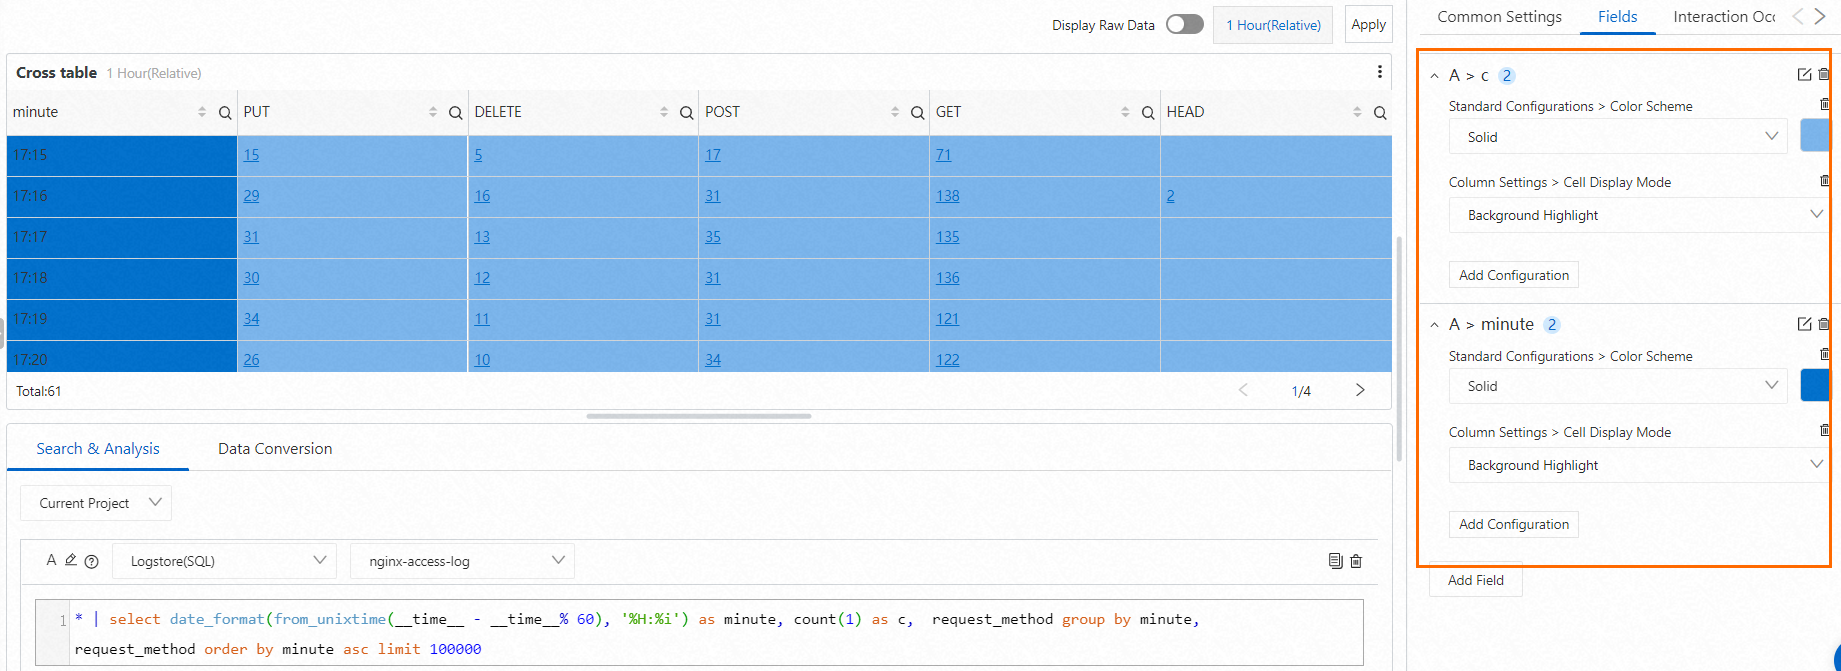
[フィールド設定] タブの設定
1つのクエリステートメントの結果または結果の1列のデータに対して、パーソナライズされた表示設定を構成できます。 詳細については、「一般的な設定」タブの「設定」をご参照ください。
たとえば、A > minuteを選択して、クエリステートメントAの結果のminuteフィールドの設定を行います。A > cを選択して、クエリステートメントAの結果のcフィールドの設定を行います。2つのフィールドの配色とセル表示モードを指定すると、クロステーブルのフィールドを色で区別できます。
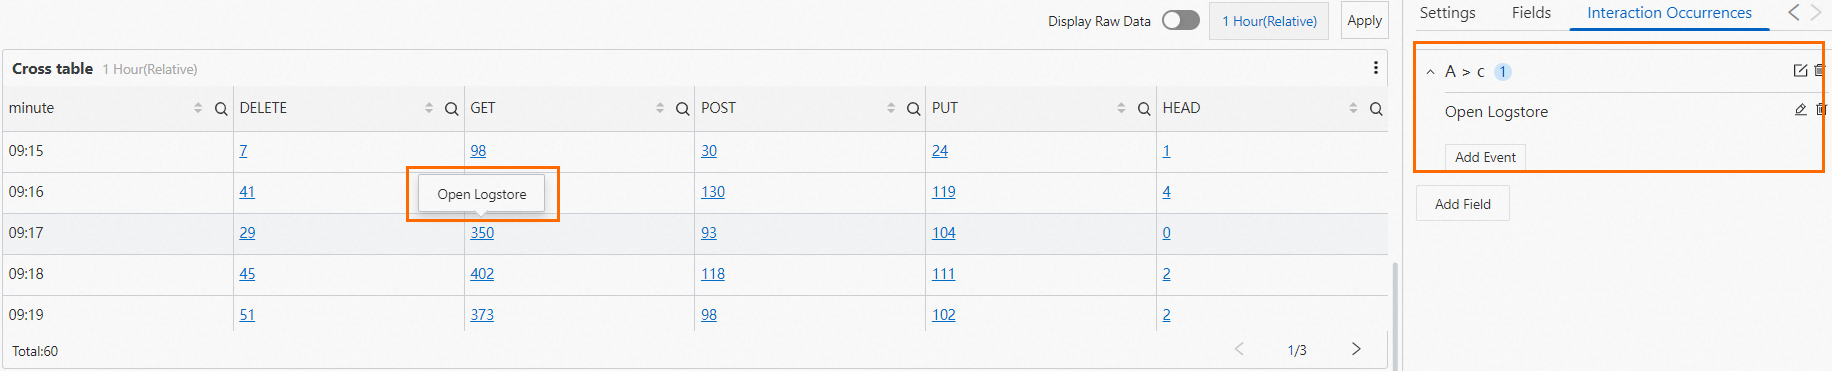
[インタラクション発生] タブの設定
単一のクエリステートメントの結果、または結果の1列のデータに対してインタラクションの発生を設定して、データをより細かく分析できます。 サポートされているインタラクションの発生の種類には、Open Logstore、Open Saved Search、Open Dashboard、Open Trace Analysis、Open Trace Details、Create Custom HTTP URLなどがあります。 詳細については、「インタラクションの発生」をご参照ください。
たとえば、A > countを選択して、クエリステートメントAの結果のcountフィールドのOpen Logstoreインタラクションの発生を設定できます。インタラクションの発生を設定したら、クロステーブルのcountフィールドの値にポインターを移動し、Open Logstoreをクリックします。 次に、指定したLogstoreに移動します。