PerfTracker は、大規模モデルトレーニング向けのオンラインパフォーマンス分析・診断ツールです。トレーニングジョブでパフォーマンスの問題が発生した場合、PerfTracker はすべてのワーカーから CUDA カーネルと Python 関数の実行記録、およびハードウェア監視データを収集し、遅いノードの特定、ボトルネック関数の正確な特定、ハングの問題を検出する分析レポートを生成します。
制限事項
PerfTracker は、PyTorch フレームワークを使用するトレーニングジョブのみをサポートします。
機能
主な機能
-
オンラインデータ収集:すべてのワーカーから、すべての関数タイプ (CUDA カーネルや Python 関数など) の実行記録を、GPU、NVLink、PCIe、DRAM のハードウェア監視データとともに、100 マイクロ秒の精度で収集します。
-
関数レベルのパフォーマンス分析:関数ごとのパフォーマンスレポートを生成し、遅いノードや実行時間が異常な関数など、パフォーマンスの低下の根本原因を自動的に診断します。レポートは、最適化の指針となる詳細な手動分析もサポートしています。
ソリューションの特長
-
きめ細かいオンラインプロファイリング:データ収集をオフライン再現からリアルタイムのきめ細かいキャプチャに移行し、適時性と精度を向上させます。
-
効率的なマルチノード分析:専門家の知識を診断アルゴリズムに体系化することで、パフォーマンス分析を自動化し、効率的な問題の特定と局所化を可能にします。
仕組み
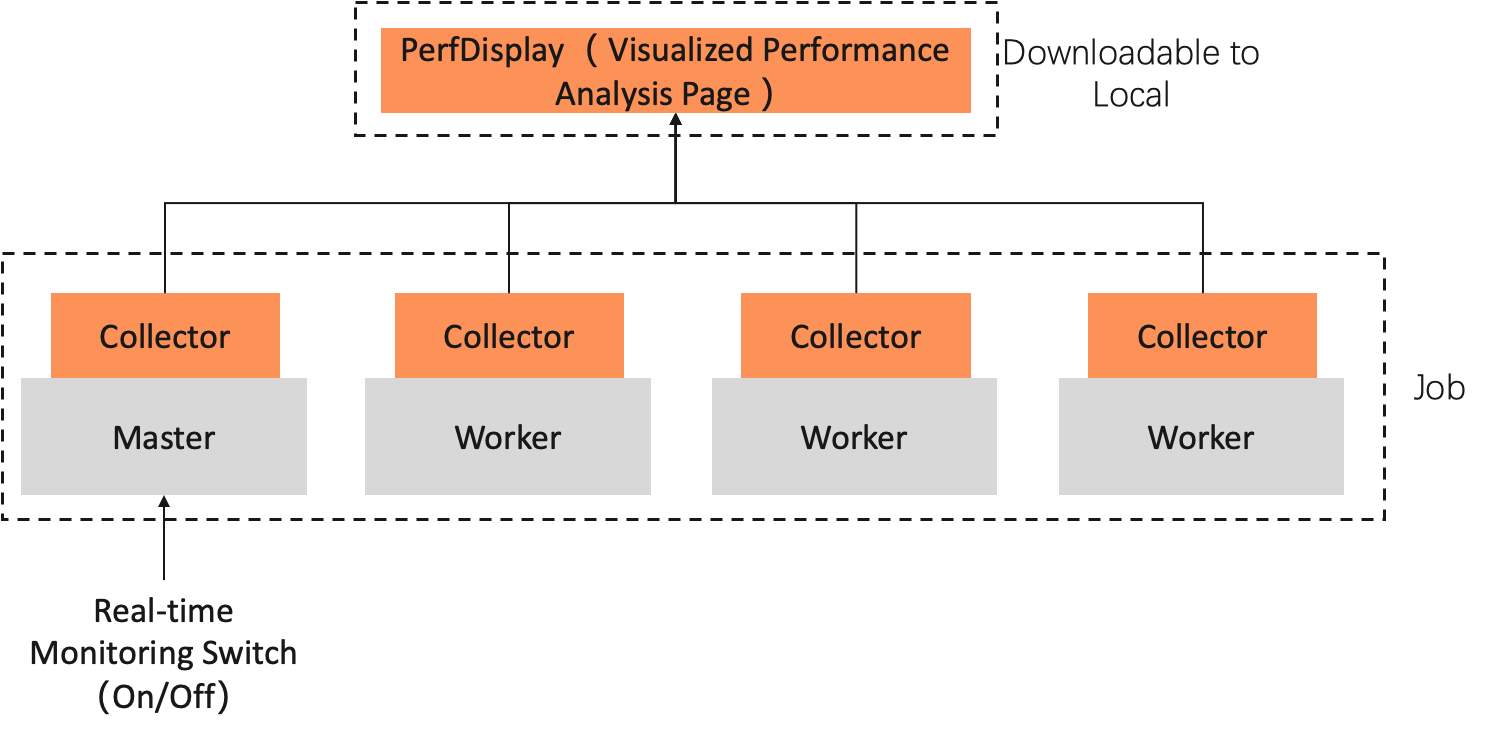
PerfTracker には、Collector と PerfDisplay の 2 つのコンポーネントがあります。Collector はジョブコンテナ内で実行され、トレーニングプロセスから独立しています。PerfDisplay は、分析レポートを表示するためのローカル Web ベースのインターフェースを提供します。
-
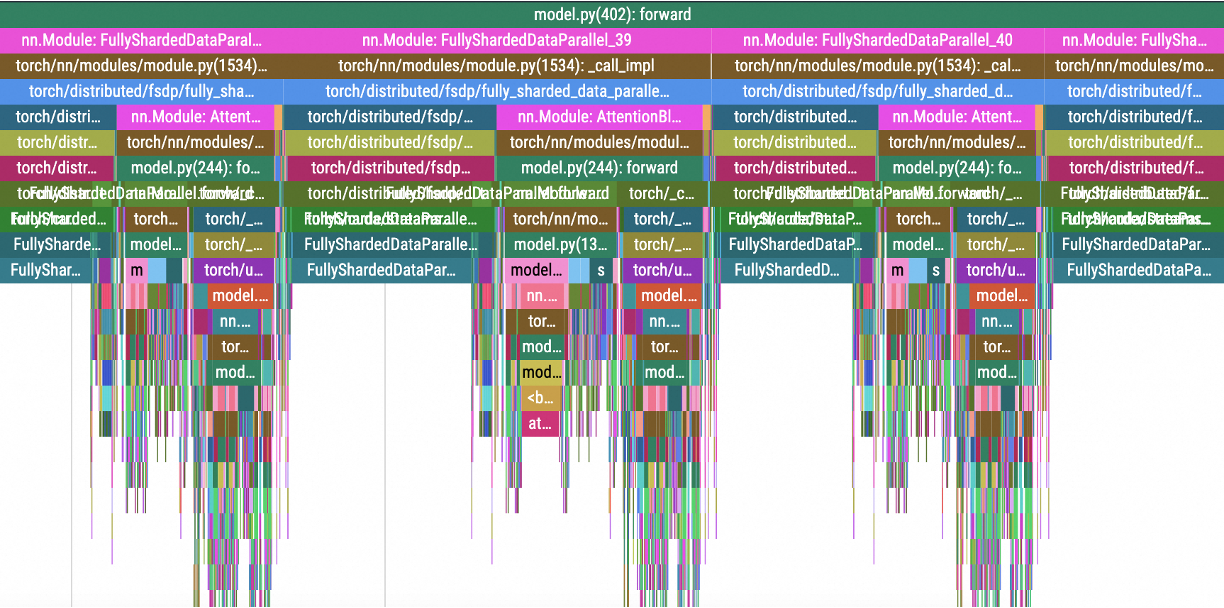
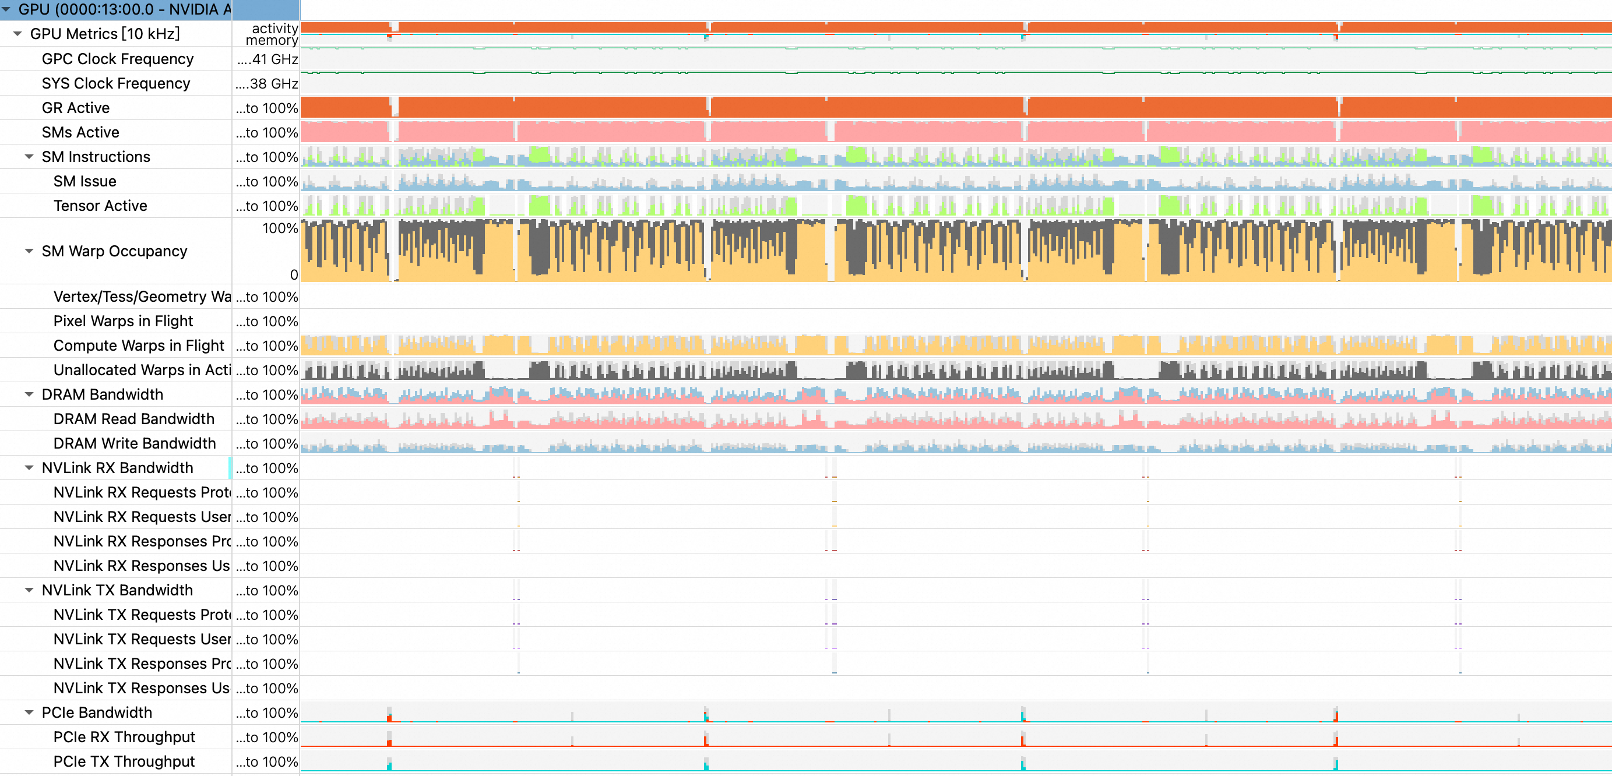
PerfTracker Collector:Torch profiler API と nsys を使用して、RAW 監視データを収集し、高精度のフルスタックオンライン監視を実行します。収集されるデータには次のものが含まれます。
-
CUDA カーネル関数 (計算および通信カーネル)、GPU 起動カーネル関数、GPU メモリ操作、Python 関数を含む、すべてのランタイム関数の実行記録。これは、コードレベルのパフォーマンス分析のためにプログラムの動作を 100% 正確に記録したものです。
-
GPU、NVLink、PCIe、DRAM などのさまざまなハードウェアメトリクスの監視データ (100 マイクロ秒の精度)。
以下の図は、収集されたデータの例を示しています。
-
CUDA カーネル関数と GPU メモリ操作

-
Python 関数と GPU 起動カーネル
-
ハードウェア監視データ
-
-
PerfDisplay:収集されたデータを集約および分析して、パフォーマンス分析レポートと可視化を生成します。
操作手順
トレーニングコードの準備
-
トレーニングスクリプトを変更して、PerfTracker モジュールをインポートし、各トレーニングステップをマークします。
-
トレーニングスクリプトの冒頭で PerfTracker モジュールをインポートします。次のコードは例を示しています。
try: from c4d_perftracker_collector.PerfTracker import PerfTracker my_tracer = PerfTracker() except: my_tracer = None -
トレーニングコード内のステップをマークします。
PerfTracker を使用するには、トレーニングコード内のステップをマークする必要があります。
tracer.step()が実行されるたびに、PerfTracker はイベントをログに記録し、バックエンドがプロファイリングするイテレーション数を制御できるようにします。while iteration < args.train_iters: ... # トレーニングコード if my_tracer is not None: my_tracer.step() # ステップをマーク
次の
training.pyスクリプトは、インポートステートメントとステップマーカーを含む簡単な例です。import torch import time import torch.distributed as dist import argparse try: from c4d_perftracker_collector.PerfTracker import PerfTracker my_tracer = PerfTracker() except: my_tracer = None dist.init_process_group("nccl") torch.cuda.set_device(dist.get_rank()) # CUDA が利用可能かどうかを確認します。 if torch.cuda.is_available(): print("CUDA is available!") device = torch.device('cuda') # デフォルトの CUDA デバイスを使用します。 else: print("CUDA is not available.") device = torch.device('cpu') # CUDA が利用できない場合は CPU を使用します。 def matmul(): matrix_a = torch.randn(1000, 1000) matrix_b = torch.randn(1000, 1000) # 行列を CUDA デバイスに移動します。 matrix_a = matrix_a.to(device) matrix_b = matrix_b.to(device) # 行列の乗算を実行します。 result = torch.matmul(matrix_a, matrix_b) result_cpu = result.to('cpu') print(result_cpu) del matrix_a, matrix_b, result torch.cuda.empty_cache() for i in range(1000): matmul() time.sleep(dist.get_rank()) print("Epoch:", i) if my_tracer is not None: my_tracer.step() dist.barrier() -
-
トレーニングスクリプト (
training.pyなど) を、Object Storage Service (OSS) バケットなどのストレージディレクトリにアップロードします。
トレーニングジョブの作成
-
トレーニングジョブを作成する際に、起動コマンドで PerfTracker をダウンロードしてインストールします。その他の設定は通常のジョブと同じです。設定が完了したら、OK をクリックしてジョブを作成します。次に例を示します。
パラメータ
説明
[環境コンテキスト]
[イメージ設定]
PyTorch 2.0 以降のイメージを選択します。この例では、
easyanimate:1.1.5-pytorch2.2.0-gpu-py310-cu118-ubuntu22.04を使用します。[ストレージのマウント]
OSS をクリックし、トレーニングスクリプトが格納されている OSS ディレクトリを選択して、マウントパス を設定します。 この例では
/mnt/data/を使用します。[開始コマンド]
# PerfTracker インストールパッケージをダウンロードします。 wget -t 5 -w 2 -P /mnt/data https://network-research-lingjun-open-oss.oss-cn-hangzhou.aliyuncs.com/files/c4d_perftracker_collector-1.4.0-py3-none-any.whl # PerfTracker をインストールします。 pip3 install /mnt/data/c4d_perftracker_collector-1.4.0-py3-none-any.whl # トレーニングスクリプト (training.py など) を実行します。 CUDA_VISIBLE_DEVICES=0,1,2,3,4,5,6,7 torchrun --nproc_per_node=4 /mnt/data/training.py/mnt/data/をデータセットのマウントパスに置き換えてください。説明大規模なジョブの場合、起動時にダウンロードが集中して遅くなる可能性があります。ジョブを開始する前に、コマンドラインを使用して PerfTracker パッケージをストレージディレクトリにダウンロードすることを推奨します。
[リソース情報]
[フレームワーク]
[PyTorch] を選択します。
[タスクリソース]
リソース仕様を選択します。この例では、
ecs.gn6e-c12g1.12xlargeを使用します。 -
ジョブの実行中に、対象のジョブ名をクリックします。[Overview] タブの [Instance] セクションでマスターインスタンスを見つけ、操作 列の [Access container] をクリックします。
-
次のいずれかのコマンドを実行して、分析結果を保存します。これらの結果を使用して、パフォーマンスの問題の原因を診断できます。
-
オプション 1:RAW トレースなしで分析結果のみを保存します。
c4d_perftracker --trigger-on --auto-analyze --output-dir /mnt/data/ -
オプション 2:Cloud Parallel File Storage (CPFS) や Object Storage Service (OSS) などの十分なストレージがある場合は、次のコマンドを使用して分析結果と RAW トレースの両方を保存することを推奨します。これにより、初期診断後に手動で確認できます。単一ワーカーのトレースは数百メガバイトになることもあるため、診断後に手動で削除できます。
c4d_perftracker --trigger-on --auto-analyze --output-dir /mnt/data/ --save-raw-trace allこのコマンドの
/mnt/data/は、生のトレースの保存先ディレクトリを指定します。これをデータセットのマウントパスに設定すると、生のトレースをデータセットに保存できます。
分析結果を保存した後、PerfDisplay でレポートを表示します (次のセクションを参照)。PerfTracker は、パフォーマンスの問題の根本原因を特定するのに役立つ追加パラメータも提供します (「付録」を参照)。
-
分析結果の表示
-
分析モードを参照して、分析結果を生成し、保存します。コマンドが正常に実行されると、ディレクトリに
<timestamp>/PerfDisplayフォルダーが生成されます。分析が完了すると、OSS バケットのファイルリストに PerfDisplay/ フォルダーと raw_trace/ フォルダーが生成されます。 -
PerfDisplay フォルダーをデータソースの
/mnt/dataマウントディレクトリにコピーします。PerfDisplayフォルダーをローカルマシンにダウンロードするには、ossutil 2.0 コマンドラインツールをご参照ください。(ダウンロードする前にフォルダーを圧縮できます。)tar -cvf trace.tar PerfDisplay/ mv trace.tar /mnt/data -
ローカルマシンで、
PerfDisplayフォルダーに移動し、sudo python3 app.pyを実行します(Linux ではsudoが不要な場合があります)。 次に、Web ブラウザーで http://127.0.0.1:5000/ を開くと、パフォーマンスレポートが表示されます。
PerfTracker は、ジョブのパフォーマンスに影響を与える関数をレポートし、異常をフラグで示します。関数は次のカテゴリに分類され、Web インターフェースには詳細な手順を含むインタラクティブなオプションが用意されています。
GPU 計算関数
GPU Compute:
[2025-03-04 06:04:00,046 PerfTracker] (compute_functions.py 131) INFO: {
    "min/median/max GPU utilization (in [0,1])": [
        0.27586059769318555,
        0.28605496203987174,
        0.2945494558115959
    ],
    "workers with abnormal GPU utilization": {},
    "major_kernel_executions": {
        "void multi_tensor_apply_kernel<TensorListMetadata<4>, AdamFunctor<float, float, int>, float, float, float, float, float, float, adamMode_t, float>(long, int volatile*, TensorListMetadata<4>, AdamFunctor<float, float, int>, float, float, float, float, float, float, adamMode_t, float)320_1_1|512_1_1": {
            "median cost per execution (ms)": 403.7,
            "bottleneck ratio (in [0,1])": 0.01608086667957405
        },
        "sm80_xmma_gemm_f16f16_f16f32_f32_nn_n_tilesize160x128x32_stage4_warpsize2x2x1_tensor16x8x16_kernel7_16_1|128_1_1": {
            "median cost per execution (ms)": 130.0,
            "bottleneck ratio (in [0,1])": 0.015779752711771233
        },
        "ampere_fp16_s16816gemm_fp16_128x128_ldg8_f2f_stages_32x5_nt16_32_1|128_1_1": {
            "median cost per execution (ms)": 132.60000000000002,
            "bottleneck ratio (in [0,1])": 0.013880912782219888
        },
        "void (anonymous namespace)::indexing_backward_kernel<c10::Half, 4>(long const*, long const*, c10::Half const*, c10::Half*, long, long, long, long, bool)256_16_1|32_4_1": {
            "median cost per execution (ms)": 1202.25,
            "bottleneck ratio (in [0,1])": 0.012148757934008617
        },
        "ampere_fp16_s16816gemm_fp16_128x128_ldg8_f2f_stages_32x5_nt16_24_1|128_1_1": {
            "median cost per execution (ms)": 105.6,
            "bottleneck ratio (in [0,1])": 0.005656117080836238
        }
    },
    "workers with potential GPU issues": [],
    "detailed report": {}
}
レポートの読み方:
-
"min/median/max GPU utilization (in [0,1])": すべてのワーカーにおいて、最大 GPU 使用率が 29.4%、最小が 27.5%、中央値が 28.6% であったことを示します。 -
"workers with abnormal GPU utilization": 空の場合、GPU 使用率が著しく外れ値となっているワーカーはありません。 それ以外の場合、外れ値のワーカー ID とその GPU 使用率を一覧表示します。 -
"major_kernel_executions": 実行あたりのコストの中央値とボトルネック率 (エンドツーエンドのパフォーマンスに占める割合) を含む、最も時間を消費した GPU カーネルの実行をリストします。 -
"workers with potential GPU issues": GPU カーネルの実行が遅いワーカー ID を一覧表示します。空の場合は、すべてのワーカーが正常に動作していることを意味します。 -
"detailed report":"workers with potential GPU issues"が空でない場合に表示されます。どのワーカーがどのカーネル関数を通常よりどの程度遅く実行したかを示します。
GPU メモリ操作
GPU memory operations:
[2025-03-04 06:04:00,048 PerfTracker] (gpu_mem.py 37) INFO: {
    "Memcpy DtoD (Device -> Device)": {
        "avg bottleneck ratio (in [0,1])": 0.010486858246092,
        "abnormal_workers": {
            "job_x08j11173.cloud.sqa.na131_2_122482.json": 0.010614755325049817,
            "job_x08j11173.cloud.sqa.na131_8_122483.json": 0.0105935370201344,
            "job_x08j11173.cloud.sqa.na131_1_122484.json": 0.010571838319204434,
            "job_x08j11173.cloud.sqa.na131_0_122485.json": 0.010551186610995748,
            "job_x08j11173.cloud.sqa.na131_2_122487.json": 0.010408514784026183,
            "job_x08j11173.cloud.sqa.na131_5_122489.json": 0.010394903160689894,
            "job_x08j11173.cloud.sqa.na131_8_122486.json": 0.010387693451926115,
            "job_x08j11173.cloud.sqa.na131_9_122488.json": 0.010372437296709398
        }
    }
}
レポートの読み方:
-
"avg bottleneck ratio (in [0,1])": モニタリング期間中に Memcpy DtoD 操作に費やされた平均時間が、エンドツーエンド時間の 1.048% であったことを示します。 -
"abnormal_workers": 8 つのワーカーで Memcpy DtoD の実行時間に異常がありました。GPU メモリ操作の場合、ボトルネック率が 0.01 (1%) を超えると異常と見なされます。
集団通信
Communication:
{
    "nvlink ring send": {
        "ncclDevKernel_AllReduce_Sum_f16_RING_LL(ncclDevComm*, unsigned long, ncclWork*)": {
            "example_of_normal_worker": {
                "worker": "job_x08j11173.cloud.sqa.na131_0_66930.json",
                "different from other workers": 0,
                "features": {
                    "bottleneck ratio (in [0,1])": 0.2743985289797289,
                    "avg throughput (%)": 73.75921390374332,
                    "throughput std (%)": 11.384679144385027
                }
            },
            "abnormal_workers": []
        }
    },
    "nvlink ring recv": {
        "ncclDevKernel_AllReduce_Sum_f16_RING_LL(ncclDevComm*, unsigned long, ncclWork*)": {
            "example_of_normal_worker": {
                "worker": "job_x08j11173.cloud.sqa.na131_3_66933.json",
                "different from other workers": 2,
                "features": {
                    "bottleneck ratio (in [0,1])": 0.27346865947352955,
                    "avg throughput (%)": 72.70337362637363,
                    "throughput std (%)": 12.658093406593407
                }
            },
            "abnormal_workers": []
        }
    },
    "pcie sendrecv send": {
        "ncclDevKernel_SendRecv(ncclDevComm*, unsigned long, ncclWork*)": {
            "example_of_normal_worker": {
                "worker": "job_x08j11173.cloud.sqa.na131_0_66930.json",
                "different from other workers": 3,
                "features": {
                    "bottleneck ratio (in [0,1])": 0.07248997985478658,
                    "avg throughput (%)": 46.667,
                    "throughput std (%)": 14.636000000000001
                }
            },
            "abnormal_workers": []
        }
    },
    "pcie sendrecv recv": {
        "ncclDevKernel_SendRecv(ncclDevComm*, unsigned long, ncclWork*)": {
            "example_of_normal_worker": {
                "worker": "job_x08j11173.cloud.sqa.na131_7_66936.json",
                "different from other workers": 1,
                "features": {
                    "bottleneck ratio (in [0,1])": 0.0643436909425455,
                    "avg throughput (%)": 54.833333333333336,
                    "throughput std (%)": 14.166666666666666
                }
            },
            "abnormal_workers": []
        }
    },
    "pcie ring send": {
        "ncclDevKernel_AllReduce_Sum_f16_RING_LL(ncclDevComm*, unsigned long, ncclWork*)": {
            "example_of_normal_worker": {
                "worker": "job_x08j11173.cloud.sqa.na131_0_66930.json",
                "different from other workers": 0,
                "features": {
                    "bottleneck ratio (in [0,1])": 0.2743985289797289,
                    "avg throughput (%)": 41.36698734177215,
                    "throughput std (%)": 14.653768987341774
                }
            },
            "abnormal_workers": []
        }
    },
    "pcie ring recv": {
        "ncclDevKernel_AllReduce_Sum_f16_RING_LL(ncclDevComm*, unsigned long, ncclWork*)": {
            "example_of_normal_worker": {
                "worker": "job_x08j11173.cloud.sqa.na131_0_66930.json",
                "different from other workers": 0,
                "features": {
                    "bottleneck ratio (in [0,1])": 0.2743985289797289,
                    "avg throughput (%)": 41.5311475409836,
                    "throughput std (%)": 15.282721311475411
                }
            },
            "abnormal_workers": []
        }
    }
}
このレポートは、集団通信関数をタイプ別に分類し、それぞれのパフォーマンス分析を示します。
-
"example_of_normal_worker"は、関数の通常のパフォーマンスパラメータを示します。これには、ボトルネック比 (計算との重複を除いたエンドツーエンド時間に占める割合)、平均スループット、およびスループットの標準偏差が含まれます。 -
"abnormal_workers"には、空でない場合、その通信機能で異常なパフォーマンスを示したワーカーとそのメトリクスの一覧が含まれます。
CUDA ランタイム
CUDA Runtime:
[2025-03-04 06:04:00,047 PerfTracker] (cuda_runtimes.py 43) INFO: {
    "cudaLaunchKernel": {
        "avg bottleneck ratio (in [0,1])": 0.039727736621541394,
        "avg execution time / monitoring duration (in [0,1])": 0.06956947111288565,
        "abnormal_workers": {
            "job_x08j11173.cloud.sqa.na131_5_122489.json": 0.05342638907019616,
            "job_x08j11173.cloud.sqa.na131_8_122483.json": 0.05125160206973098,
            "job_x08j11173.cloud.sqa.na131_2_122487.json": 0.04770049253555521,
            "job_x08j11173.cloud.sqa.na131_8_122486.json": 0.04358845044879828,
            "job_x08j11173.cloud.sqa.na131_0_122485.json": 0.042635952262081556,
            "job_x08j11173.cloud.sqa.na131_9_122488.json": 0.0354174573296689,
            "job_x08j11173.cloud.sqa.na131_1_122484.json": 0.023585242093250733,
            "job_x08j11173.cloud.sqa.na131_2_122482.json": 0.02021630716304934
        }
    }
}
レポートの読み方:
-
"avg bottleneck ratio (in [0,1])": モニタリング期間中に cudaLaunchKernel に費やされた平均時間が 3.97% であったことを示します (計算とのオーバーラップを除く)。 -
"avg execution time / monitoring duration (in [0,1])":cudaLaunchKernelでの平均実行時間が、モニタリング期間全体 (計算との重複を含む) の 6.95% であったことを示します。 -
"abnormal_workers": 8 人のワーカーで cudaLaunchKernel の実行時間が異常であったことを示します。 CUDA ランタイム関数では、ボトルネック率が 0.01 (1%) を超えると異常と見なされます。
Python 関数
Python functions:
[2025-03-04 06:04:00,048 PerfTracker] (python_functions.py 43) INFO: {
    "pretrain_gpt.py: <module>|megatron/training.py: pretrain|megatron/training.py: train|megatron/training.py: train_step|megatron/core/pipeline_parallel/schedules.py: forward_backward_pipelining_without_interleaving|megatron/core/pipeline_parallel/schedules.py: backward_step|megatron/core/pipeline_parallel/schedules.py: custom_backward|<built-in method run_backward of torch._C._EngineBase object at 0x>": {
        "job_x08j11173.cloud.sqa.na131_2_122487.json": 0.16970858578301054,
        "job_x08j11173.cloud.sqa.na131_5_122489.json": 0.16821543761561655,
        "job_x08j11173.cloud.sqa.na131_0_122485.json": 0.16787961852913025,
        "job_x08j11173.cloud.sqa.na131_8_122483.json": 0.16769273336153187,
        "job_x08j11173.cloud.sqa.na131_8_122486.json": 0.14482595694389258,
        "job_x08j11173.cloud.sqa.na131_9_122488.json": 0.10359829140378449,
        "job_x08j11173.cloud.sqa.na131_1_122484.json": 0.06543764774209325,
        "job_x08j11173.cloud.sqa.na131_2_122482.json": 0.06217541348063737
    },
    "pretrain_gpt.py: <module>|megatron/training.py: pretrain|megatron/training.py: train|megatron/training.py: train_step|megatron/core/pipeline_parallel/schedules.py: forward_backward_pipelining_without_interleaving|megaron/core/pipeline_parallel/schedules.py: forward_step|pretrain_gpt.py: forward_step|nn.Module: DistributedDataParallel_0|torch/nn/modules/module.py: _call_impl|megatron/core/distributed/distributed_data_parallel.py: forward|nn.Module: Float16Module_0|torch/nn/modules/module.py: _call_impl|megatron/model/module.py: forward|nn.Module: GPTModel_0|torch/nn/modules/module.py: _call_impl|megatron/model/gpt_model.py: forward|nn.Module: TransformerLanguageModel_0|torch/nn/modules/module.py: _call_impl|megatron/model/language_model.py: forward|nn.Module: ParallelTransformer_0|torch/nn/modules/module.py: _call_impl|megatron/model/transformer.py: forward": {
        "job_x08j11173.cloud.sqa.na131_9_122488.json": 0.02471835416438489,
        "job_x08j11173.cloud.sqa.na131_0_122485.json": 0.02022024568555683,
        "job_x08j11173.cloud.sqa.na131_2_122482.json": 0.015394834126935101,
        "job_x08j11173.cloud.sqa.na131_2_122487.json": 0.011625367332189284
    },
    "pretrain_gpt.py: <module>|megatron/training.py: pretrain|megatron/training.py: train|megatron/training.py: train_step": {
        "job_x08j11173.cloud.sqa.na131_0_122485.json": 0.012272193902698852
    },
    "autograd::engine::evaluate_function: LinearWithGradAccumulationAndAsyncCommunicationBackward|LinearWithGradAccumulationAndAsyncCommunicationBackward|torch/autograd/function.py: apply|torch/cuda/amp/autocast_mode.py: decorate_bwd|megatron/core/tensor_parallel/layers.py: backward|<built-in method matmul of Tensor object at 0x>|aten::matmul|aten::mm": {
        "job_x08j11173.cloud.sqa.na131_2_122487.json": 0.014066713574814782,
        "job_x08j11173.cloud.sqa.na131_0_122485.json": 0.013168949365116213,
        "job_x08j11173.cloud.sqa.na131_8_122483.json": 0.013000378454189552,
        "job_x08j11173.cloud.sqa.na131_5_122489.json": 0.012500119397472594,
        "job_x08j11173.cloud.sqa.na131_8_122486.json": 0.012470581043494208
    },
    "autograd::engine::evaluate_function: FastLayerNormFNBackward|FastLayerNormFNBackward|torch/autograd/function.py: apply|apex/contrib/layer_norm/layer_norm.py: backward|<built-in method ln_bwd of PyCapsule object at 0x>": {
        "job_x08j11173.cloud.sqa.na131_0_122485.json": 0.010127612754279463
    },
    "pretrain_gpt.py: <module>|megatron/training.py: pretrain|megatron/training.py: train|megatron/training.py: train_step|megatron/core/pipeline_parallel/schedules.py: forward_backward_pipelining_without_interleaving": {
        "job_x08j11173.cloud.sqa.na131_2_122487.json": 0.01041679269251709
    },
    "autograd::engine::evaluate_function: torch::autograd::AccumulateGrad": {
        "job_x08j11173.cloud.sqa.na131_8_122486.json": 0.013633967050768714
    }
}
このレポートは、GPU 計算、通信、その他の操作とのオーバーラップを除いた、合計実行時間の 1% 以上を消費する Python 関数を一覧表示します。関数は名前でクラスター化されており、各クラスターについて、1% のしきい値を超えるすべてのワーカーが、実行時間の割合とともに一覧表示されます。
付録
PerfTracker CLI パラメータ
関連ドキュメント
PerfTracker の手法の詳細については、「PerfTracker: Online Performance Troubleshooting for Large-scale Model Training in Production」をご参照ください。