このトピックでは、PyTorch Profilerを使用してPyTorchモデルのパフォーマンスのボトルネックを特定し、NVIDIA TensorRTを使用してモデルを最適化し、次にTriton Inference Serverを使用して最適化モデルをデプロイする方法について説明します。 このトピックでは、PyTorch ResNet-50モデルを使用します。
背景情報
NVIDIA TensorRTは、深層学習タスクのモデル推論を高速化するために使用されるSDKです。 NVIDIA TensorRTには、ディープラーニング推論オプティマイザとランタイムが含まれており、推論の遅延を減らし、スループットを向上させます。 Triton Inference Serverは、NVIDIAが提供するオープンソースモデル推論フレームワークです。 Triton Inference Serverは、PyTorch、TensorFlow、NVIDIA TensorRT、ONNXなどの主流の機械学習フレームワークをサポートしています。
通常、ディープラーニングモデルは、モデルのトレーニング後に評価および最適化されます。 これにより、モデルをリリースする前に推論の待ち時間とスループットを減らすことができます。 これらの最適化により、モデルに必要なGPUメモリの量が削減され、GPU共有によりGPUの使用率が向上します。
このトピックでは、PyTorch ResNet-50モデルをトレーニングして、次の図dog.jpgを認識します。 PyTorch Profilerは、PyTorch ResNet-50モデルのパフォーマンスのボトルネックを特定するために使用されます。 NVIDIA TensorRTはモデルを最適化するために使用されます。 Triton Inference Serverを使用して、最適化モデルをデプロイします。 
前提条件
GPU高速化ノードを含むContainer Service for Kubernetes (ACK) クラスターが作成されます。 詳細については、「ACKクラスターでのGPUスケジューリングの使用」をご参照ください。
クラスター内のノードはインターネットにアクセスできます。 詳細については、「既存のACKクラスターによるインターネットへのアクセスの有効化」をご参照ください。
Arenaコンポーネントがインストールされています。 詳細については、「アリーナのインストール」をご参照ください。
永続ボリュームクレーム (PVC) がクラスターに作成されます。 詳細については、「共有NASボリュームの設定」をご参照ください。.
手順1: PyTorch Profilerを使用して、PyTorch ResNet-50モデルのパフォーマンスのボトルネックを特定する
PyTorch 1.8.1以降のバージョンでは、PyTorch Profilerを使用して、トレーニングおよび推論中にモデルのパフォーマンスのボトルネックを特定します。 PyTorch Profilerは、PyTorch Profilerの分析レポートを視覚化するTensorBoardと連携できます。
次のコマンドを実行して、PyTorch Profilerログを生成します。
説明imagenet_classes.txtファイルの詳細については、
open("imagenet_classes.txt") as f:を使用して、「imagenet_classes」をご参照ください。import torch from torchvision import models import torchvision.transforms as T from PIL import Image import time # Preprocess the image. def preprocess_image(img_path): transform = T.Compose([ T.Resize(224), T.CenterCrop(224), T.ToTensor(), T.Normalize(mean=[0.485, 0.456, 0.406], std=[0.229, 0.224, 0.225]),]) # Read the image. input_image = Image.open(img_path) # Convert the image format. input_data = transform(input_image) batch_data = torch.unsqueeze(input_data, 0) return batch_data # Postprocess the prediction result. def postprocess(output_data): # Read ImageNet classes. with open("imagenet_classes.txt") as f: classes = [line.strip() for line in f.readlines()] # Use Softmax to obtain the readable prediction result. confidences = torch.nn.functional.softmax(output_data, dim=1)[0] * 100 _, indices = torch.sort(output_data, descending=True) i = 0 # Print the prediction result. while confidences[indices[0][i]] > 0.5: class_idx = indices[0][i] print( "class:", classes[class_idx], ", confidence:", confidences[class_idx].item(), "%, index:", class_idx.item(), ) i += 1 def main(): model = models.resnet50(pretrained=True) input = preprocess_image("dog.jpg").cuda() model.eval() model.cuda() with torch.profiler.profile( activities=[ torch.profiler.ProfilerActivity.CPU, torch.profiler.ProfilerActivity.CUDA, ], on_trace_ready=torch.profiler.tensorboard_trace_handler('./logs'), profile_memory=True, record_shapes=True, with_stack=True ) as profiler: start = time.time() output = model(input) cost = time.time() - start print(f"predict_cost = {cost}") postprocess(output) profiler.step() if __name__ == '__main__': main()TensorBoardを使用して分析レポートを視覚化します。
次のコマンドを実行して、PyTorch Profiler Tensorboard Pluginをオンプレミスのマシンにインストールし、TensorBoardを起動します。
pip install torch_tb_profiler tensorboard --logdir ./logs --port 6006ブラウザのアドレスバーにlocalhost:6006と入力し、Enterキーを押して分析レポートを表示します。
TensorBoardは、GPUカーネルのメトリクス、PyTorch演算子、タイムライントレースなど、分析結果を視覚化します。 TensorBoardは、これらのメトリックに基づくモデル最適化に関する提案も提供します。
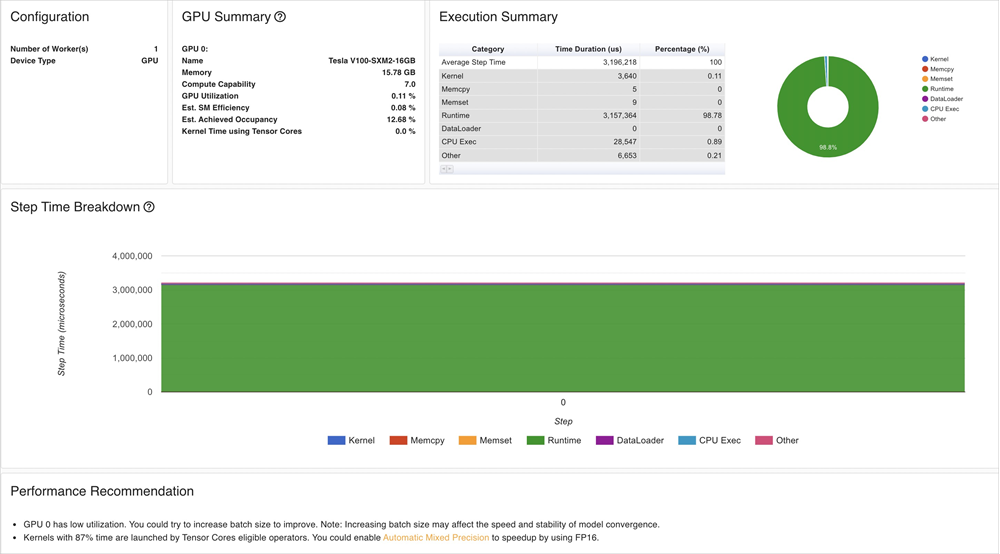
分析結果は次の情報を示します。
ResNet-50モデルのGPU利用率は低いです。
バッチサイズを大きくして、GPUの使用率を向上させることができます。GPUカーネルをロードするには長い時間が必要です。 精度を下げて推論を高速化できます。
ステップ2: PyTorch ResNet-50モデルを最適化する
NVIDIA TensorRTを使用してPyTorch ResNet-50モデルを最適化する前に、モデルをONNX形式に変換してから、ONNXモデルファイルからTensorRTエンジンを作成する必要があります。
次のコマンドを実行して、PyTorchモデルをONNX形式に変換します。
# Load a pretrained ResNet-50 model.
model = models.resnet50(pretrained=True)

# Preprocess the image.
input = preprocess_image("dog.jpg").cuda()

# Perform model inference.
model.eval()
model.cuda()

# Convert the model to the ONNX format.
ONNX_FILE_PATH = "resnet50.onnx"
torch.onnx.export(model, input, ONNX_FILE_PATH, input_names=["input"], output_names=["output"], export_params=True)
onnx_model = onnx.load(ONNX_FILE_PATH)

# Check whether the conversion is successful.
onnx.checker.check_model(onnx_model)

print("Model was successfully converted to ONNX format.")
print("It was saved to", ONNX_FILE_PATH)
ONNXモデルファイルからTensorRTエンジンを作成します。
重要TensorRTエンジンの作成に使用されるTensorRTバージョンとCompute Unified Device Architecture (CUDA) バージョンは、手順4: 最適化モデルのデプロイで使用されるNVIDIA Inference Serverバージョンと互換性がある必要があります。 さらに、TensorRTバージョンおよびCUDAバージョンは、モードがデプロイされているECS (Elastic Compute Service) インスタンスのGPUドライババージョンおよびCUDAバージョンと互換性がある必要があります。
NVIDIAが提供するTensorRTイメージを使用することを推奨します。 この例では、TensorRTのイメージバージョンは
nvcr.io/nvidia/tensorrt:21.05-py3で、Triton Inference Serverのイメージバージョンはnvcr.io/nvidia/tritonserver:21.05-py3です。def build_engine(onnx_file_path, save_engine=False): if os.path.exists(TRT_ENGINE_PATH): # If a serialized engine exists, you can use the existing serialized engine instead of creating a new one. print("Reading engine from file {}".format(TRT_ENGINE_PATH)) with open(TRT_ENGINE_PATH, "rb") as f, trt.Runtime(TRT_LOGGER) as runtime: engine = runtime.deserialize_cuda_engine(f.read()) context = engine.create_execution_context() return engine, context # Initialize the TensorRT engine and parse the ONNX model. builder = trt.Builder(TRT_LOGGER) explicit_batch = 1 << (int)(trt.NetworkDefinitionCreationFlag.EXPLICIT_BATCH) network = builder.create_network(explicit_batch) parser = trt.OnnxParser(network, TRT_LOGGER) # Specify that the TensorRT engine can use at most 1 GB of GPU memory for policy selection. builder.max_workspace_size = 1 << 30 # In this example, only one image is included in the batch process. builder.max_batch_size = 1 # We recommend that you use the FP16 mode. if builder.platform_has_fast_fp16: builder.fp16_mode = True # Parse the ONNX model. with open(onnx_file_path, 'rb') as model: print('Beginning ONNX file parsing') parser.parse(model.read()) print('Completed parsing of ONNX file') # Create a TensorRT engine that is optimized for the platform on which the TensorRT engine is deployed. print('Building an engine...') engine = builder.build_cuda_engine(network) context = engine.create_execution_context() print("Completed creating Engine") with open(TRT_ENGINE_PATH, "wb") as f: print("Save engine to {}".format(TRT_ENGINE_PATH)) f.write(engine.serialize()) return engine, context元のPyTorchモデルとTensorRTエンジンの推論レイテンシとモデルサイズを比較します。
次のコマンドを実行して、元のPyTorchモデルの推論レイテンシを測定します。
model = models.resnet50(pretrained=True)
input = preprocess_image("dog.jpg").cuda()
model.eval()
model.cuda()
start = time.time()
output = model(input)
cost = time.time() - start
print(f"pytorch predict_cost = {cost}")
次のコマンドを実行して、TensorRTエンジンの推論レイテンシを測定します。
# Initialize the TensorRT engine and parse the ONNX model.
engine, context = build_engine(ONNX_FILE_PATH)
# Obtain the input data size and output data size. Allocate memory to process the input data and output data based on your business requirements.
for binding in engine:
    if engine.binding_is_input(binding):  # we expect only one input
        input_shape = engine.get_binding_shape(binding)
        input_size = trt.volume(input_shape) * engine.max_batch_size * np.dtype(np.float32).itemsize  # in bytes
        device_input = cuda.mem_alloc(input_size)
    else:  # The output data.
        output_shape = engine.get_binding_shape(binding)
        # Create a page-locked memory buffer. This way, the data is not written to the disk.
        host_output = cuda.pagelocked_empty(trt.volume(output_shape) * engine.max_batch_size, dtype=np.float32)
        device_output = cuda.mem_alloc(host_output.nbytes)
# Create a stream, copy the input data or output data to the stream, and then run inference.
stream = cuda.Stream()
# Preprocess the input data.
host_input = np.array(preprocess_image("dog.jpg").numpy(), dtype=np.float32, order='C')
cuda.memcpy_htod_async(device_input, host_input, stream)
# Run inference.
start = time.time()
context.execute_async(bindings=[int(device_input), int(device_output)], stream_handle=stream.handle)
cuda.memcpy_dtoh_async(host_output, device_output, stream)
stream.synchronize()
cost = time.time() - start
print(f"tensorrt predict_cost = {cost}")
次の表と図は、推論レイテンシとモデルサイズを含む結果を示しています。
メトリック
PyTorchモデル
TensorRTエンジン
Latency
16 ms
3 ms
サイズ
98 MB
50 MB
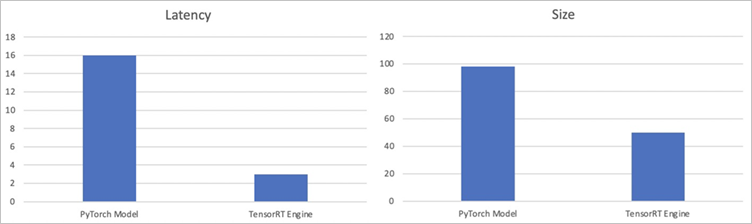
結果は、TensorRTエンジンの推論レイテンシが元のPyTorchモデルよりも約80% 小さく、TensorRTエンジンのサイズが元のPyTorchモデルよりも約50% 小さいことを示しています。
ステップ3: モデルのストレステストを実行する
Triton Inference Serverを使用して最適化されたモデルを展開する前に、Triton model Analyzerを使用してモデルのストレステストを実行できます。 これにより、モデルの推論レイテンシ、スループット、およびGPUメモリ使用率が期待どおりに最適化されているかどうかを確認できます。 Triton Model Analyzerの詳細については、「Triton Model Analyzer」をご参照ください。
次のコマンドを実行して、モデルを分析します。
次のコマンドを実行すると、現在のディレクトリにoutput_model_repositoryという名前のフォルダが作成され、profileサブコマンドの結果が格納されます。
model-analyzer profile -m /triton_repository/ \
    --profile-models resnet50_trt \
    --run-config-search-max-concurrency 2 \
    --run-config-search-max-instance-count 2 \
    --run-config-search-preferred-batch-size-disable true
次のコマンドを実行して分析レポートを生成します。
Triton Model Analyzerのanalyzeサブコマンドを実行して、分析結果をPDFファイルにエクスポートできます。mkdir analysis_results model-analyzer analyze --analysis-models resnet50_trt -e analysis_results分析レポートを表示します。
図 1. スループットとレイテンシーの2つの最適な構成
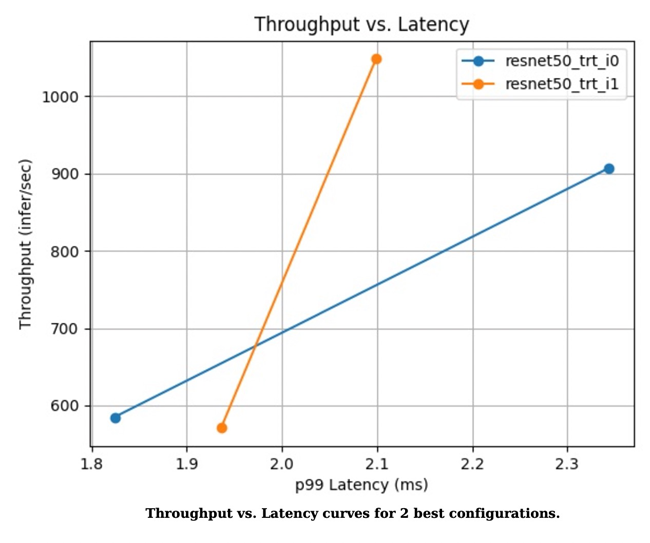
図2. GPUメモリ使用率とレイテンシー曲線の2つの最適な構成
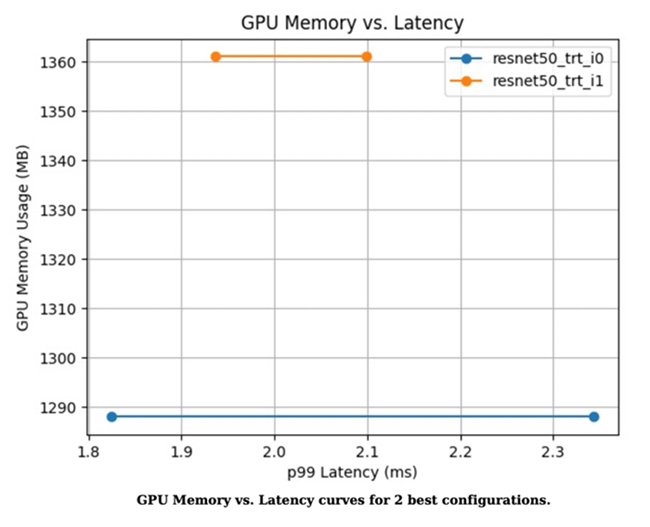
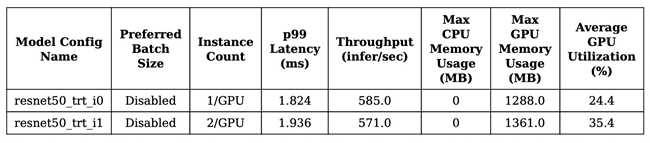
図3. 性能メトリックの2つのモデル
ステップ4: 最適化されたモデルのデプロイ
最適化が要件を満たしている場合は、Arenaを使用して、最適化されたモデルをACKクラスターにデプロイできます。
次のサンプルコードに基づいて、config.pbtxtファイルを変更します。
name: "resnet50_trt"
platform: "tensorrt_plan"
max_batch_size: 1
default_model_filename: "resnet50.trt"
input [
    {
        name: "input"
        format: FORMAT_NCHW
        data_type: TYPE_FP32
        dims: [ 3, 224, 224 ]
    }
]
output [
    {
        name: "output",
        data_type: TYPE_FP32,
        dims: [ 1000 ]
    }
]
次のコマンドを実行して、Arenaを使用して最適化モデルを推論サービスとしてデプロイします。
推論サービスを共有GPUにデプロイする場合は、「手順3: モデルのストレステストの実行」で生成された分析レポートの推奨事項に基づいて
-- gpummemoryを設定できます。 この例では、推奨値は2 GBです。arena serve triton \ --name=resnet50 \ --gpus=1 \ --replicas=1 \ --image=nvcr.io/nvidia/tritonserver:21.05-py3 \ --data=model-pvc:/data \ --model-repository=/data/profile/pytorch \ --allow-metrics=true次のコマンドを実行して、推論サービスに関する詳細を照会します。
arena serve list期待される出力:
NAME      TYPE    VERSION       DESIRED  AVAILABLE  ADDRESS         PORTS                   GPU
resnet50  Triton  202111121515  1        1          172.16.169.126  RESTFUL:8000,GRPC:8001  1
gRPCクライアントを使用して、ACKクラスターにデプロイされた推論サービスを呼び出します。
img_file = "dog.jpg"
service_grpc_endpoint = "172.16.248.19:8001"

# Create a grpc stub that is used to communicate with the server.
channel = grpc.insecure_channel(service_grpc_endpoint)
grpc_stub = service_pb2_grpc.GRPCInferenceServiceStub(channel)

# Make sure that the model meets the requirements and obtain some attributes of the model to be preprocessed.
metadata_request = service_pb2.ModelMetadataRequest(
    name=model_name, version=model_version)
metadata_response = grpc_stub.ModelMetadata(metadata_request)
config_request = service_pb2.ModelConfigRequest(name=model_name,
                                                version=model_version)
config_response = grpc_stub.ModelConfig(config_request)
input_name, output_name, c, h, w, format, dtype = parse_model(
    metadata_response, config_response.config)
request = requestGenerator(input_name, output_name, c, h, w, format, dtype, batch_size, img_file)
start = time.time()
response = grpc_stub.ModelInfer(request)
cost = time.time() - start
print("predict cost: {}".format(cost))
モニタリングデータを表示します。
ポート8002を介して
/metricsにリクエストを送信し、モニタリングデータを照会できます。 この例では、172.16.169.126:8002/metricsが使用されています。#HELP nv_inference_request_success Number of successful inference requests, all batch sizes #TYPE nv_inference_request_success counter nv_inference_request_success{gpu_uuid="GPU-0e9fdafb-5adb-91cd-26a8-308d34357efc",model="resnet50_trt",version="1"} 4.000000 #HELP nv_inference_request_failure Number of failed inference requests, all batch sizes # TYPE nv_inference_request_failure counter nv_inference_request_failure{gpu_uuid="GPU-0e9fdafb-5adb-91cd-26a8-308d34357efc",model="resnet50_trt",version="1"} 0.000000 #HELP nv_inference_count Number of inferences performed #TYPE nv_inference_count counter nv_inference_count{gpu_uuid="GPU-0e9fdafb-5adb-91cd-26a8-308d34357efc",model="resnet50_trt",version="1"} 4.000000 #HELP nv_inference_exec_count Number of model executions performed #TYPE nv_inference_exec_count counter nv_inference_exec_count{gpu_uuid="GPU-0e9fdafb-5adb-91cd-26a8-308d34357efc",model="resnet50_trt",version="1"} 4.000000 #HELP nv_inference_request_duration_us Cumulative inference request duration in microseconds #TYPE nv_inference_request_duration_us counter nv_inference_request_duration_us{gpu_uuid="GPU-0e9fdafb-5adb-91cd-26a8-308d34357efc",model="resnet50_trt",version="1"} 7222.000000 #HELP nv_inference_queue_duration_us Cumulative inference queuing duration in microseconds #TYPE nv_inference_queue_duration_us counter nv_inference_queue_duration_us{gpu_uuid="GPU-0e9fdafb-5adb-91cd-26a8-308d34357efc",model="resnet50_trt",version="1"} 116.000000 #HELP nv_inference_compute_input_duration_us Cumulative compute input duration in microseconds #TYPE nv_inference_compute_input_duration_us counter nv_inference_compute_input_duration_us{gpu_uuid="GPU-0e9fdafb-5adb-91cd-26a8-308d34357efc",model="resnet50_trt",version="1"} 1874.000000 #HELP nv_inference_compute_infer_duration_us Cumulative compute inference duration in microseconds #TYPE nv_inference_compute_infer_duration_us counter nv_inference_compute_infer_duration_us{gpu_uuid="GPU-0e9fdafb-5adb-91cd-26a8-308d34357efc",model="resnet50_trt",version="1"} 5154.000000 #HELP nv_inference_compute_output_duration_us Cumulative inference compute output duration in microseconds #TYPE nv_inference_compute_output_duration_us counter nv_inference_compute_output_duration_us{gpu_uuid="GPU-0e9fdafb-5adb-91cd-26a8-308d34357efc",model="resnet50_trt",version="1"} 66.000000 #HELP nv_gpu_utilization GPU utilization rate [0.0 - 1.0) #TYPE nv_gpu_utilization gauge nv_gpu_utilization{gpu_uuid="GPU-0e9fdafb-5adb-91cd-26a8-308d34357efc"} 0.000000 #HELP nv_gpu_memory_total_bytes GPU total memory, in bytes #TYPE nv_gpu_memory_total_bytes gauge nv_gpu_memory_total_bytes{gpu_uuid="GPU-0e9fdafb-5adb-91cd-26a8-308d34357efc"} 16945512448.000000 #HELP nv_gpu_memory_used_bytes GPU used memory, in bytes #TYPE nv_gpu_memory_used_bytes gauge nv_gpu_memory_used_bytes{gpu_uuid="GPU-0e9fdafb-5adb-91cd-26a8-308d34357efc"} 974913536.000000 #HELP nv_gpu_power_usage GPU power usage in watts #TYPE nv_gpu_power_usage gauge nv_gpu_power_usage{gpu_uuid="GPU-0e9fdafb-5adb-91cd-26a8-308d34357efc"} 55.137000 #HELP nv_gpu_power_limit GPU power management limit in watts #TYPE nv_gpu_power_limit gauge nv_gpu_power_limit{gpu_uuid="GPU-0e9fdafb-5adb-91cd-26a8-308d34357efc"} 300.000000 #HELP nv_energy_consumption GPU energy consumption in joules since the Triton Server started #TYPE nv_energy_consumption counter nv_energy_consumption{gpu_uuid="GPU-0e9fdafb-5adb-91cd-26a8-308d34357efc"} 9380.053000Triton Inference Serverは、Prometheusメトリックを提供します。 Grafanaを使用して、Triton Inference Serverから収集されたPrometheusメトリックを表示できます。 詳細については、「Log ServiceからGrafanaへの接続」をご参照ください。
クラウドネイティブAIコンポーネントセットは、モデルの分析と評価を簡素化するために最適化されています。 詳細については、「モデルの分析と最適化」をご参照ください。