Service Mesh (ASM) mendukung circuit breaking non-intrusif, throttling, dan pemantauan lalu lintas. Topik ini mencakup konfigurasi dasbor umum serta aturan peringatan untuk circuit breaking dan throttling.
Circuit breaking
Circuit breaking adalah mekanisme perlindungan terhadap overload yang mencegah sistem mengalami crash akibat lonjakan lalu lintas mendadak. Dalam arsitektur cloud-native dengan lalu lintas timur-barat antar layanan, kegagalan pada satu layanan—seperti respons lambat atau tingkat error tinggi—dapat memicu kegagalan berantai di seluruh rantai panggilan.
Dengan mengonfigurasi aturan circuit breaking untuk lalu lintas timur-barat antar layanan, Anda dapat secara otomatis menolak permintaan dari layanan upstream ketika tingkat kegagalan permintaan atau jumlah timeout respons mencapai ambang batas tertentu. Pendekatan ini melindungi layanan upstream dan mencegah penyebaran kegagalan ke seluruh rantai panggilan.
Setelah Anda mengonfigurasi aturan circuit breaking, setiap proxy ASM secara independen menghitung tingkat kegagalan permintaan atau jumlah timeout respons berdasarkan permintaan yang diprosesnya. Oleh karena itu, untuk layanan upstream yang sama namun gagal, proxy ASM di sisi klien yang berbeda mungkin memutus sirkuit pada waktu yang sedikit berbeda.
Contoh dasbor
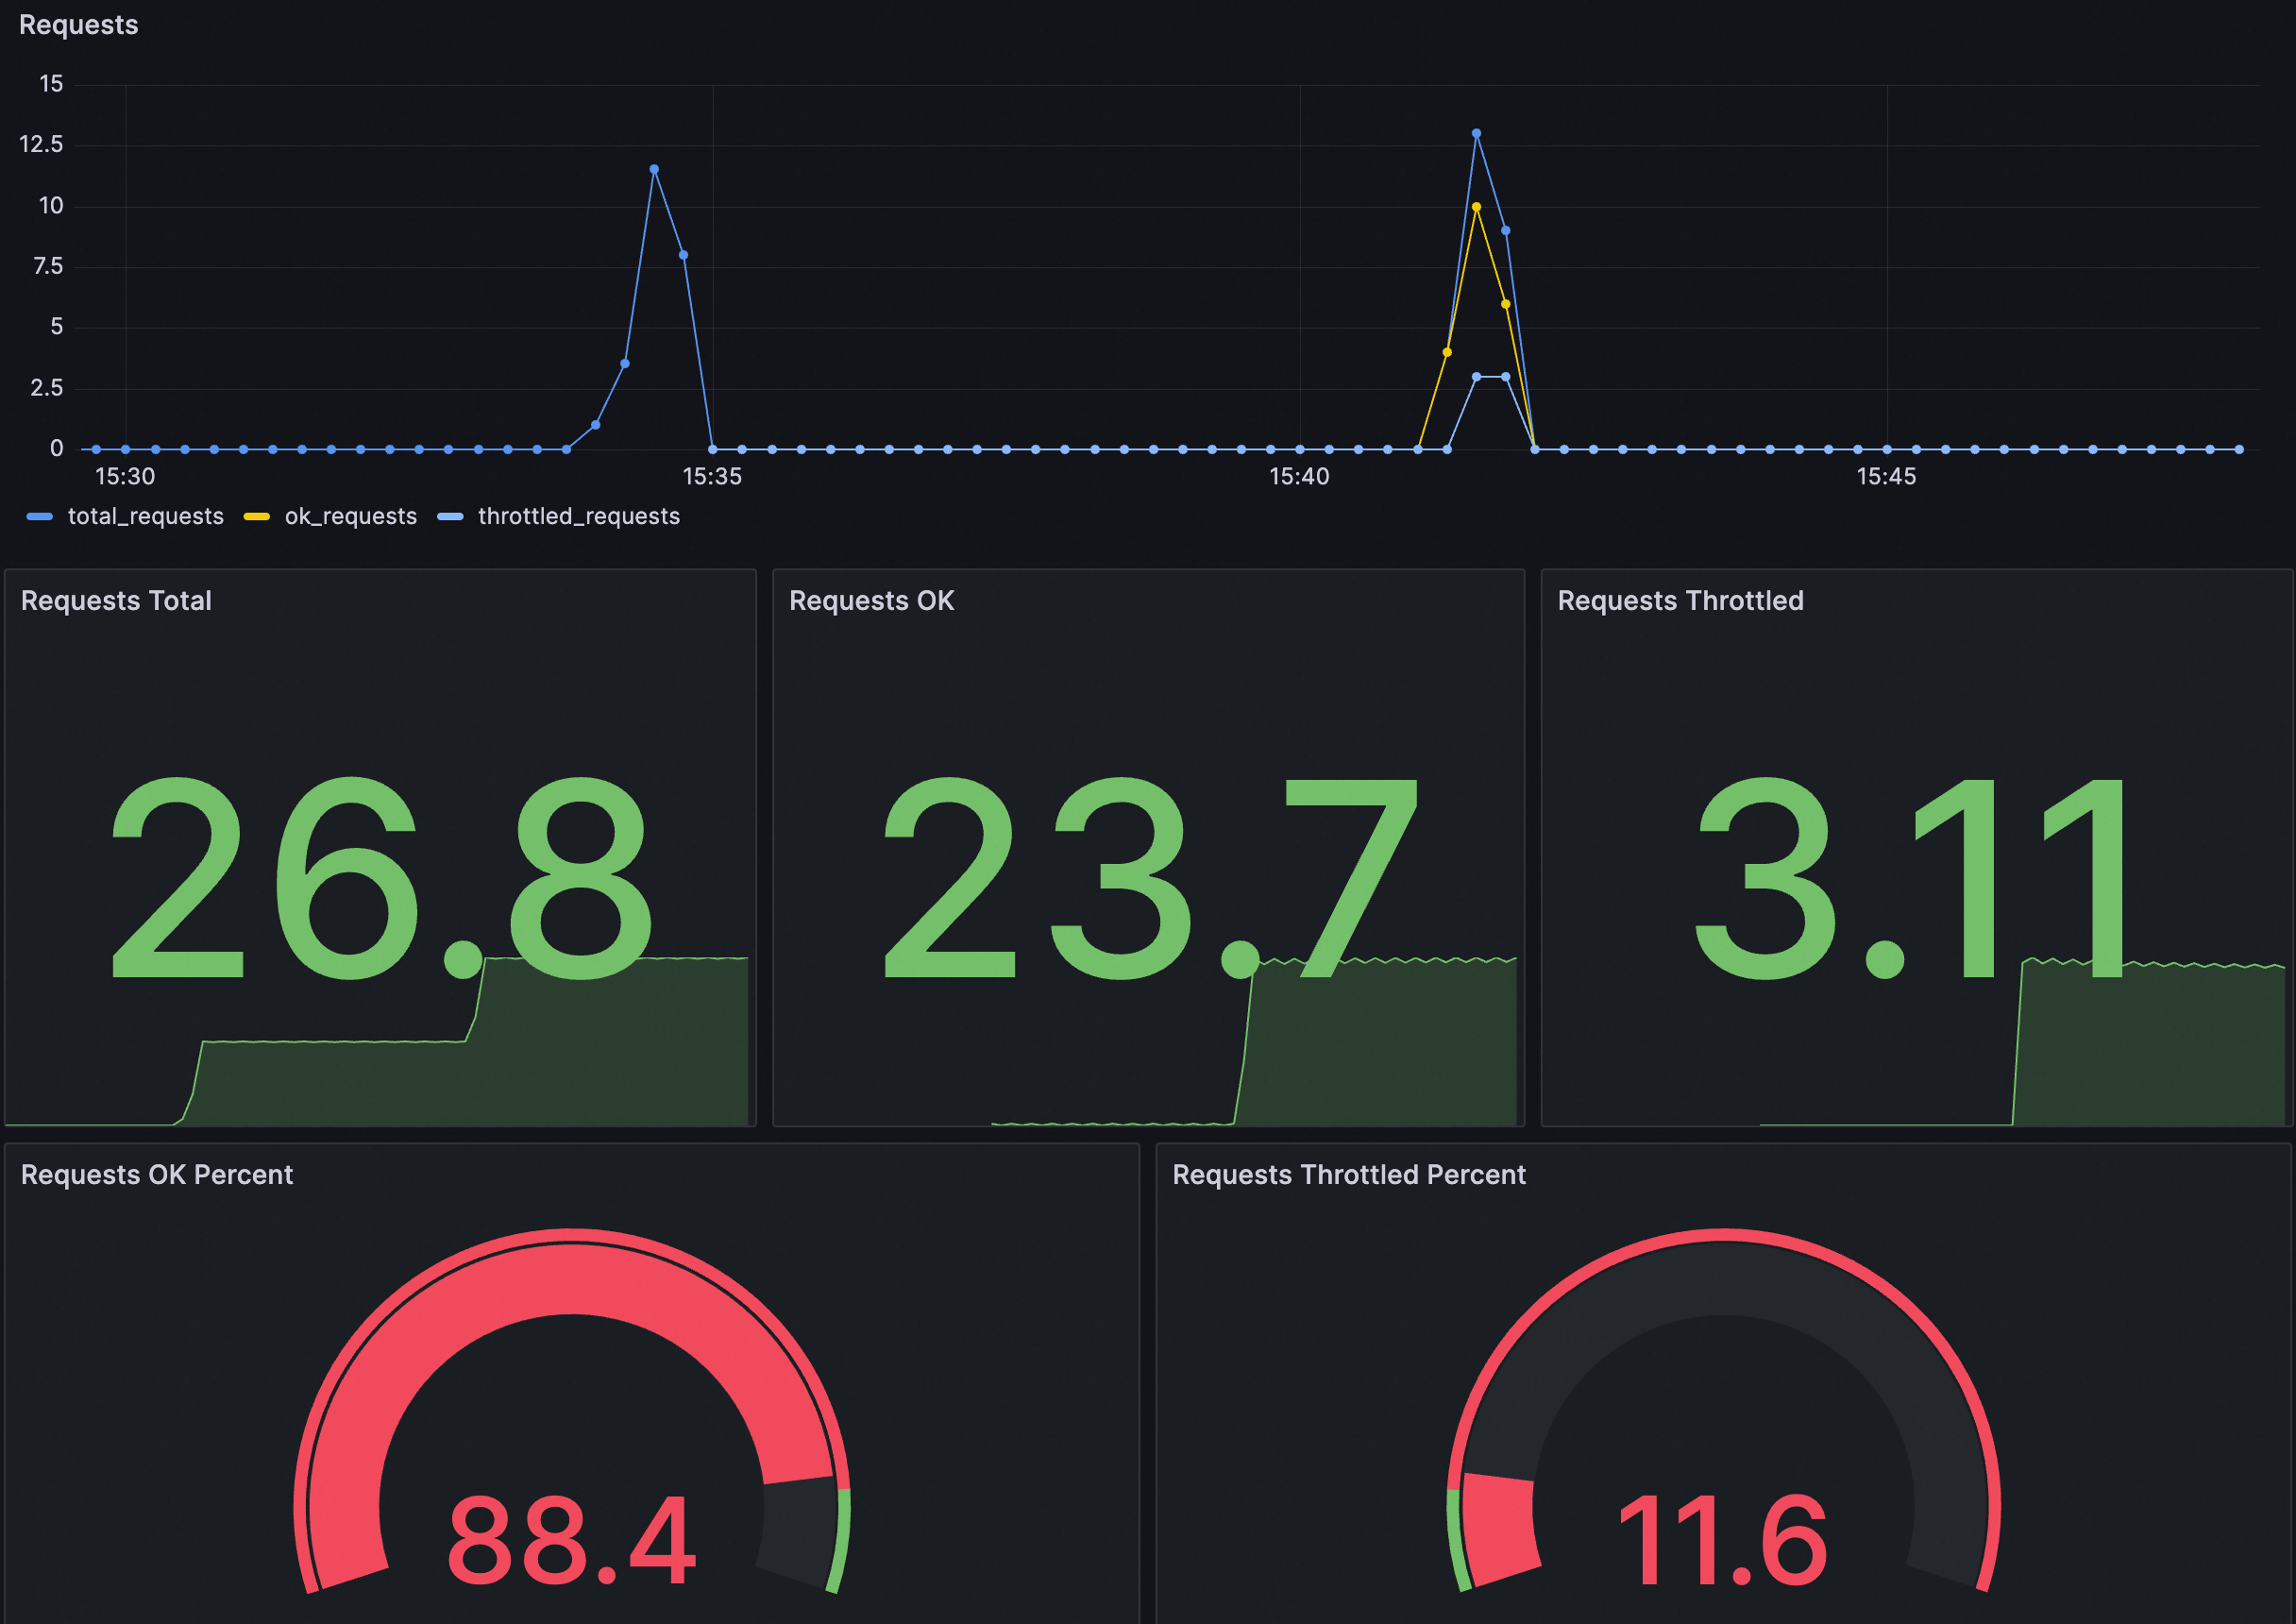
Tabel berikut menjelaskan setiap panel:
|
Panel |
Deskripsi |
|
Requests |
Memberikan ikhtisar permintaan, termasuk metrik berikut:
|
|
Requests OK percent |
Persentase permintaan berhasil dari total permintaan. |
|
Requests throttled percent |
Persentase permintaan yang dibatasi (throttled) dari total permintaan. |
Anda dapat mengimpor JSON berikut ke dalam Grafana untuk membuat dasbor circuit breaking bagi kluster Anda. Anda juga dapat memodifikasi JSON ini atau menggunakannya sebagai templat untuk membuat dasbor sendiri.
Konten JSON
{
"annotations": {
"list": [
{
"builtIn": 1,
"datasource": {
"type": "grafana",
"uid": "-- Grafana --"
},
"enable": true,
"hide": true,
"iconColor": "rgba(0, 211, 255, 1)",
"name": "Annotations & Alerts",
"type": "dashboard"
}
]
},
"editable": true,
"fiscalYearStartMonth": 0,
"graphTooltip": 0,
"id": 168,
"links": [],
"liveNow": false,
"panels": [
{
"datasource": {
"type": "prometheus",
"uid": "${DS_PROMETHEUS}"
},
"fieldConfig": {
"defaults": {
"color": {
"mode": "palette-classic"
},
"custom": {
"axisCenteredZero": false,
"axisColorMode": "text",
"axisLabel": "",
"axisPlacement": "auto",
"barAlignment": 0,
"drawStyle": "line",
"fillOpacity": 0,
"gradientMode": "none",
"hideFrom": {
"legend": false,
"tooltip": false,
"viz": false
},
"lineInterpolation": "linear",
"lineWidth": 1,
"pointSize": 5,
"scaleDistribution": {
"type": "linear"
},
"showPoints": "auto",
"stacking": {
"group": "A",
"mode": "none"
}
},
"mappings": [],
"thresholds": {
"mode": "absolute",
"steps": [
{
"color": "green",
"value": null
}
]
}
},
"overrides": [
{
"matcher": {
"id": "byName",
"options": "total_requests"
},
"properties": [
{
"id": "color",
"value": {
"fixedColor": "blue",
"mode": "fixed"
}
}
]
},
{
"matcher": {
"id": "byName",
"options": "unlimited_requests"
},
"properties": [
{
"id": "color",
"value": {
"fixedColor": "dark-green",
"mode": "fixed"
}
}
]
},
{
"matcher": {
"id": "byName",
"options": "limited_requests"
},
"properties": [
{
"id": "color",
"value": {
"fixedColor": "dark-red",
"mode": "fixed"
}
}
]
}
]
},
"gridPos": {
"h": 8,
"w": 12,
"x": 0,
"y": 0
},
"id": 1,
"options": {
"legend": {
"calcs": [],
"displayMode": "list",
"placement": "bottom",
"showLegend": true
},
"tooltip": {
"mode": "single",
"sort": "none",
"targets": []
}
},
"pluginVersion": "10.0.9",
"targets": [
{
"datasource": {
"type": "prometheus",
"uid": "${DS_PROMETHEUS}"
},
"editorMode": "code",
"exemplar": false,
"expr": "sum(rate(istio_requests_total{namespace=~\"$namespace\",pod_name=~\"$pod\",service_istio_io_canonical_name=~\"$service\"}[60s])) * 30",
"format": "time_series",
"instant": false,
"legendFormat": "total_requests",
"range": true,
"refId": "A"
},
{
"datasource": {
"type": "prometheus",
"uid": "${DS_PROMETHEUS}"
},
"editorMode": "code",
"exemplar": false,
"expr": "sum(rate(istio_requests_total{namespace=~\"$namespace\",pod_name=~\"$pod\",service_istio_io_canonical_name=~\"$service\"}[60s])) * 30 - sum(rate(envoy_asm_circuit_breaker_total_broken_requests{namespace=~\"$namespace\",pod_name=~\"$pod\",cluster=~\".*$service.*\"}[60s])) * 30",
"format": "time_series",
"hide": false,
"instant": false,
"legendFormat": "ok_requests",
"range": true,
"refId": "B"
},
{
"datasource": {
"type": "prometheus",
"uid": "${DS_PROMETHEUS}"
},
"editorMode": "code",
"expr": "sum(rate(envoy_asm_circuit_breaker_total_broken_requests{namespace=~\"$namespace\",pod_name=~\"$pod\",cluster=~\".*$service.*\"}[60s])) * 30",
"hide": false,
"instant": false,
"legendFormat": "throttled_requests",
"range": true,
"refId": "C"
}
],
"title": "Requests",
"transparent": true,
"type": "aliyun-timeseries-panel"
},
{
"datasource": {
"type": "prometheus",
"uid": "${DS_PROMETHEUS}"
},
"fieldConfig": {
"defaults": {
"color": {
"mode": "thresholds"
},
"mappings": [],
"thresholds": {
"mode": "absolute",
"steps": [
{
"color": "green",
"value": null
}
]
}
},
"overrides": []
},
"gridPos": {
"h": 8,
"w": 4,
"x": 0,
"y": 8
},
"id": 2,
"options": {
"colorMode": "value",
"graphMode": "area",
"justifyMode": "auto",
"orientation": "auto",
"reduceOptions": {
"calcs": [
"lastNotNull"
],
"fields": "",
"values": false
},
"textMode": "auto"
},
"pluginVersion": "10.0.9",
"targets": [
{
"datasource": {
"type": "prometheus",
"uid": "${DS_PROMETHEUS}"
},
"editorMode": "code",
"expr": "sum(increase(istio_requests_total{namespace=~\"$namespace\",pod_name=~\"$pod\",service_istio_io_canonical_name=~\"$service\"}[$__range]))",
"instant": false,
"range": true,
"refId": "A"
}
],
"title": "Requests Total",
"type": "stat"
},
{
"datasource": {
"type": "prometheus",
"uid": "${DS_PROMETHEUS}"
},
"fieldConfig": {
"defaults": {
"color": {
"mode": "thresholds"
},
"mappings": [],
"thresholds": {
"mode": "absolute",
"steps": [
{
"color": "green",
"value": null
}
]
}
},
"overrides": []
},
"gridPos": {
"h": 8,
"w": 4,
"x": 4,
"y": 8
},
"id": 5,
"options": {
"colorMode": "value",
"graphMode": "area",
"justifyMode": "auto",
"orientation": "auto",
"reduceOptions": {
"calcs": [
"lastNotNull"
],
"fields": "",
"values": false
},
"textMode": "auto"
},
"pluginVersion": "10.0.9",
"targets": [
{
"datasource": {
"type": "prometheus",
"uid": "${DS_PROMETHEUS}"
},
"editorMode": "code",
"expr": "sum(increase(istio_requests_total{namespace=~\"$namespace\",pod_name=~\"$pod\",service_istio_io_canonical_name=~\"$service\"}[$__range])) - sum(increase(envoy_asm_circuit_breaker_total_broken_requests{namespace=~\"$namespace\",pod_name=~\"$pod\",cluster=~\".*$service.*\"}[$__range]))",
"instant": false,
"range": true,
"refId": "A"
}
],
"title": "Requests OK",
"type": "stat"
},
{
"datasource": {
"type": "prometheus",
"uid": "${DS_PROMETHEUS}"
},
"fieldConfig": {
"defaults": {
"color": {
"mode": "thresholds"
},
"mappings": [],
"thresholds": {
"mode": "absolute",
"steps": [
{
"color": "green",
"value": null
}
]
}
},
"overrides": []
},
"gridPos": {
"h": 8,
"w": 4,
"x": 8,
"y": 8
},
"id": 4,
"options": {
"colorMode": "value",
"graphMode": "area",
"justifyMode": "auto",
"orientation": "auto",
"reduceOptions": {
"calcs": [
"lastNotNull"
],
"fields": "",
"values": false
},
"textMode": "auto"
},
"pluginVersion": "10.0.9",
"targets": [
{
"datasource": {
"type": "prometheus",
"uid": "${DS_PROMETHEUS}"
},
"editorMode": "code",
"expr": "sum(increase(envoy_asm_circuit_breaker_total_broken_requests{namespace=~\"$namespace\",pod_name=~\"$pod\",cluster=~\".*$service.*\"}[$__range]))",
"instant": false,
"range": true,
"refId": "A"
}
],
"title": "Requests Throttled",
"type": "stat"
},
{
"datasource": {
"type": "prometheus",
"uid": "${DS_PROMETHEUS}"
},
"fieldConfig": {
"defaults": {
"color": {
"mode": "thresholds"
},
"custom": {
"neutral": -1
},
"mappings": [],
"max": 100,
"min": 0,
"thresholds": {
"mode": "percentage",
"steps": [
{
"color": "red",
"value": null
},
{
"color": "green",
"value": 90
}
]
}
},
"overrides": []
},
"gridPos": {
"h": 7,
"w": 6,
"x": 0,
"y": 16
},
"id": 6,
"options": {
"orientation": "auto",
"reduceOptions": {
"calcs": [
"lastNotNull"
],
"fields": "",
"values": false
},
"showThresholdLabels": false,
"showThresholdMarkers": true
},
"pluginVersion": "10.0.9",
"targets": [
{
"datasource": {
"type": "prometheus",
"uid": "${DS_PROMETHEUS}"
},
"editorMode": "code",
"expr": "(sum(increase(istio_requests_total{namespace=~\"$namespace\",pod_name=~\"$pod\",service_istio_io_canonical_name=~\"$service\"}[$__range])) - sum(increase(envoy_asm_circuit_breaker_total_broken_requests{namespace=~\"$namespace\",pod_name=~\"$pod\",cluster=~\".*$service.*\"}[$__range]))) / sum(increase(istio_requests_total{namespace=~\"$namespace\",pod_name=~\"$pod\",service_istio_io_canonical_name=~\"$service\"}[$__range])) * 100",
"instant": false,
"range": true,
"refId": "A"
}
],
"title": "Requests OK Percent",
"type": "gauge"
},
{
"datasource": {
"type": "prometheus",
"uid": "${DS_PROMETHEUS}"
},
"fieldConfig": {
"defaults": {
"color": {
"mode": "thresholds"
},
"custom": {
"neutral": -1
},
"mappings": [],
"max": 100,
"min": 0,
"thresholds": {
"mode": "percentage",
"steps": [
{
"color": "green",
"value": null
},
{
"color": "red",
"value": 10
}
]
}
},
"overrides": []
},
"gridPos": {
"h": 7,
"w": 6,
"x": 6,
"y": 16
},
"id": 7,
"options": {
"orientation": "auto",
"reduceOptions": {
"calcs": [
"lastNotNull"
],
"fields": "",
"values": false
},
"showThresholdLabels": false,
"showThresholdMarkers": true
},
"pluginVersion": "10.0.9",
"targets": [
{
"datasource": {
"type": "prometheus",
"uid": "${DS_PROMETHEUS}"
},
"editorMode": "code",
"expr": "sum(increase(envoy_asm_circuit_breaker_total_broken_requests{namespace=~\"$namespace\",pod_name=~\"$pod\",cluster=~\".*$service.*\"}[$__range])) / sum(increase(istio_requests_total{namespace=~\"$namespace\",pod_name=~\"$pod\",service_istio_io_canonical_name=~\"$service\"}[$__range])) * 100",
"instant": false,
"range": true,
"refId": "A"
}
],
"title": "Requests Throttled Percent",
"type": "gauge"
}
],
"refresh": false,
"schemaVersion": 38,
"style": "dark",
"tags": [],
"templating": {
"list": [
{
"current": {
"selected": false,
"text": "datesource",
"value": "datesource"
},
"hide": 0,
"includeAll": false,
"label": "datasource",
"multi": false,
"name": "DS_PROMETHEUS",
"options": [],
"query": "prometheus",
"queryValue": "datesource",
"refresh": 1,
"regex": "",
"skipUrlSync": false,
"type": "datasource"
},
{
"allValue": ".*",
"current": {
"selected": false,
"text": "All",
"value": "$__all"
},
"datasource": {
"type": "prometheus",
"uid": "ykIxRIhNk"
},
"definition": "query_result(sum(envoy_asm_circuit_breaker_total_broken_requests) by (namespace))",
"hide": 0,
"includeAll": true,
"label": "namespace",
"multi": false,
"name": "namespace",
"options": [],
"query": {
"query": "query_result(sum(envoy_asm_circuit_breaker_total_broken_requests) by (namespace))",
"refId": "PrometheusVariableQueryEditor-VariableQuery"
},
"refresh": 1,
"regex": "/.*namespace=\"(.*)\".*/",
"skipUrlSync": false,
"sort": 0,
"type": "query"
},
{
"allValue": ".*",
"current": {
"selected": false,
"text": "All",
"value": "$__all"
},
"datasource": {
"type": "prometheus",
"uid": "ykIxRIhNk"
},
"definition": "query_result(sum(envoy_asm_circuit_breaker_total_broken_requests) by (pod_name))",
"description": "",
"hide": 0,
"includeAll": true,
"label": "pod",
"multi": false,
"name": "pod",
"options": [],
"query": {
"query": "query_result(sum(envoy_asm_circuit_breaker_total_broken_requests) by (pod_name))",
"refId": "PrometheusVariableQueryEditor-VariableQuery"
},
"refresh": 1,
"regex": "/.*pod_name=\"(.*)\".*/",
"skipUrlSync": false,
"sort": 0,
"type": "query"
},
{
"allValue": ".*",
"current": {
"selected": false,
"text": "All",
"value": "$__all"
},
"datasource": {
"type": "prometheus",
"uid": "ykIxRIhNk"
},
"definition": "query_result(sum(envoy_asm_circuit_breaker_total_broken_requests) by (cluster))",
"hide": 0,
"includeAll": true,
"multi": false,
"name": "service",
"options": [],
"query": {
"query": "query_result(sum(envoy_asm_circuit_breaker_total_broken_requests) by (cluster))",
"refId": "PrometheusVariableQueryEditor-VariableQuery"
},
"refresh": 1,
"regex": "/.*_.*_.*_(.*)\".*/",
"skipUrlSync": false,
"sort": 0,
"type": "query"
}
]
},
"time": {
"from": "2025-03-19T07:40:00.388Z",
"to": "2025-03-19T07:43:09.493Z"
},
"timepicker": {},
"timezone": "browser",
"title": "Circuit Breaker",
"uid": "5d5bcd97-33a9-499f-94f6-aea7081b9777",
"version": 5,
"weekStart": ""
}Contoh aturan peringatan
|
Konfigurasi |
Contoh |
Deskripsi |
|
Ekspresi PromQL kustom |
(sum by(cluster, namespace) (increase(envoy_asm_circuit_breaker_total_broken_requests[1m]))) > 10 |
Menghitung jumlah permintaan yang dibatasi (throttled) dalam satu menit terakhir, dikelompokkan berdasarkan cluster dan namespace. Peringatan dipicu jika jumlah tersebut melebihi 10. |
|
Konten peringatan |
Terjadi circuit breaking di tingkat layanan! Namespace: {{$labels.namespace}}, Layanan target: {{$labels.cluster}}. Jumlah permintaan yang dibatasi dalam satu menit terakhir: {{ $value }} |
Menentukan format pesan peringatan. Pesan ini mencakup namespace, layanan target, dan jumlah permintaan yang dibatasi dalam satu menit terakhir. |
Global throttling
Dalam proxy Envoy, global throttling adalah mekanisme yang mengontrol laju permintaan di seluruh service mesh. Mekanisme ini mengandalkan layanan rate limit Envoy untuk memproses lalu lintas secara terpusat dan menerapkan batasan berdasarkan aturan serta kuota yang telah ditentukan.
Global throttling dapat dikombinasikan dengan local throttling untuk memberikan perlindungan berlapis.
Contoh dasbor
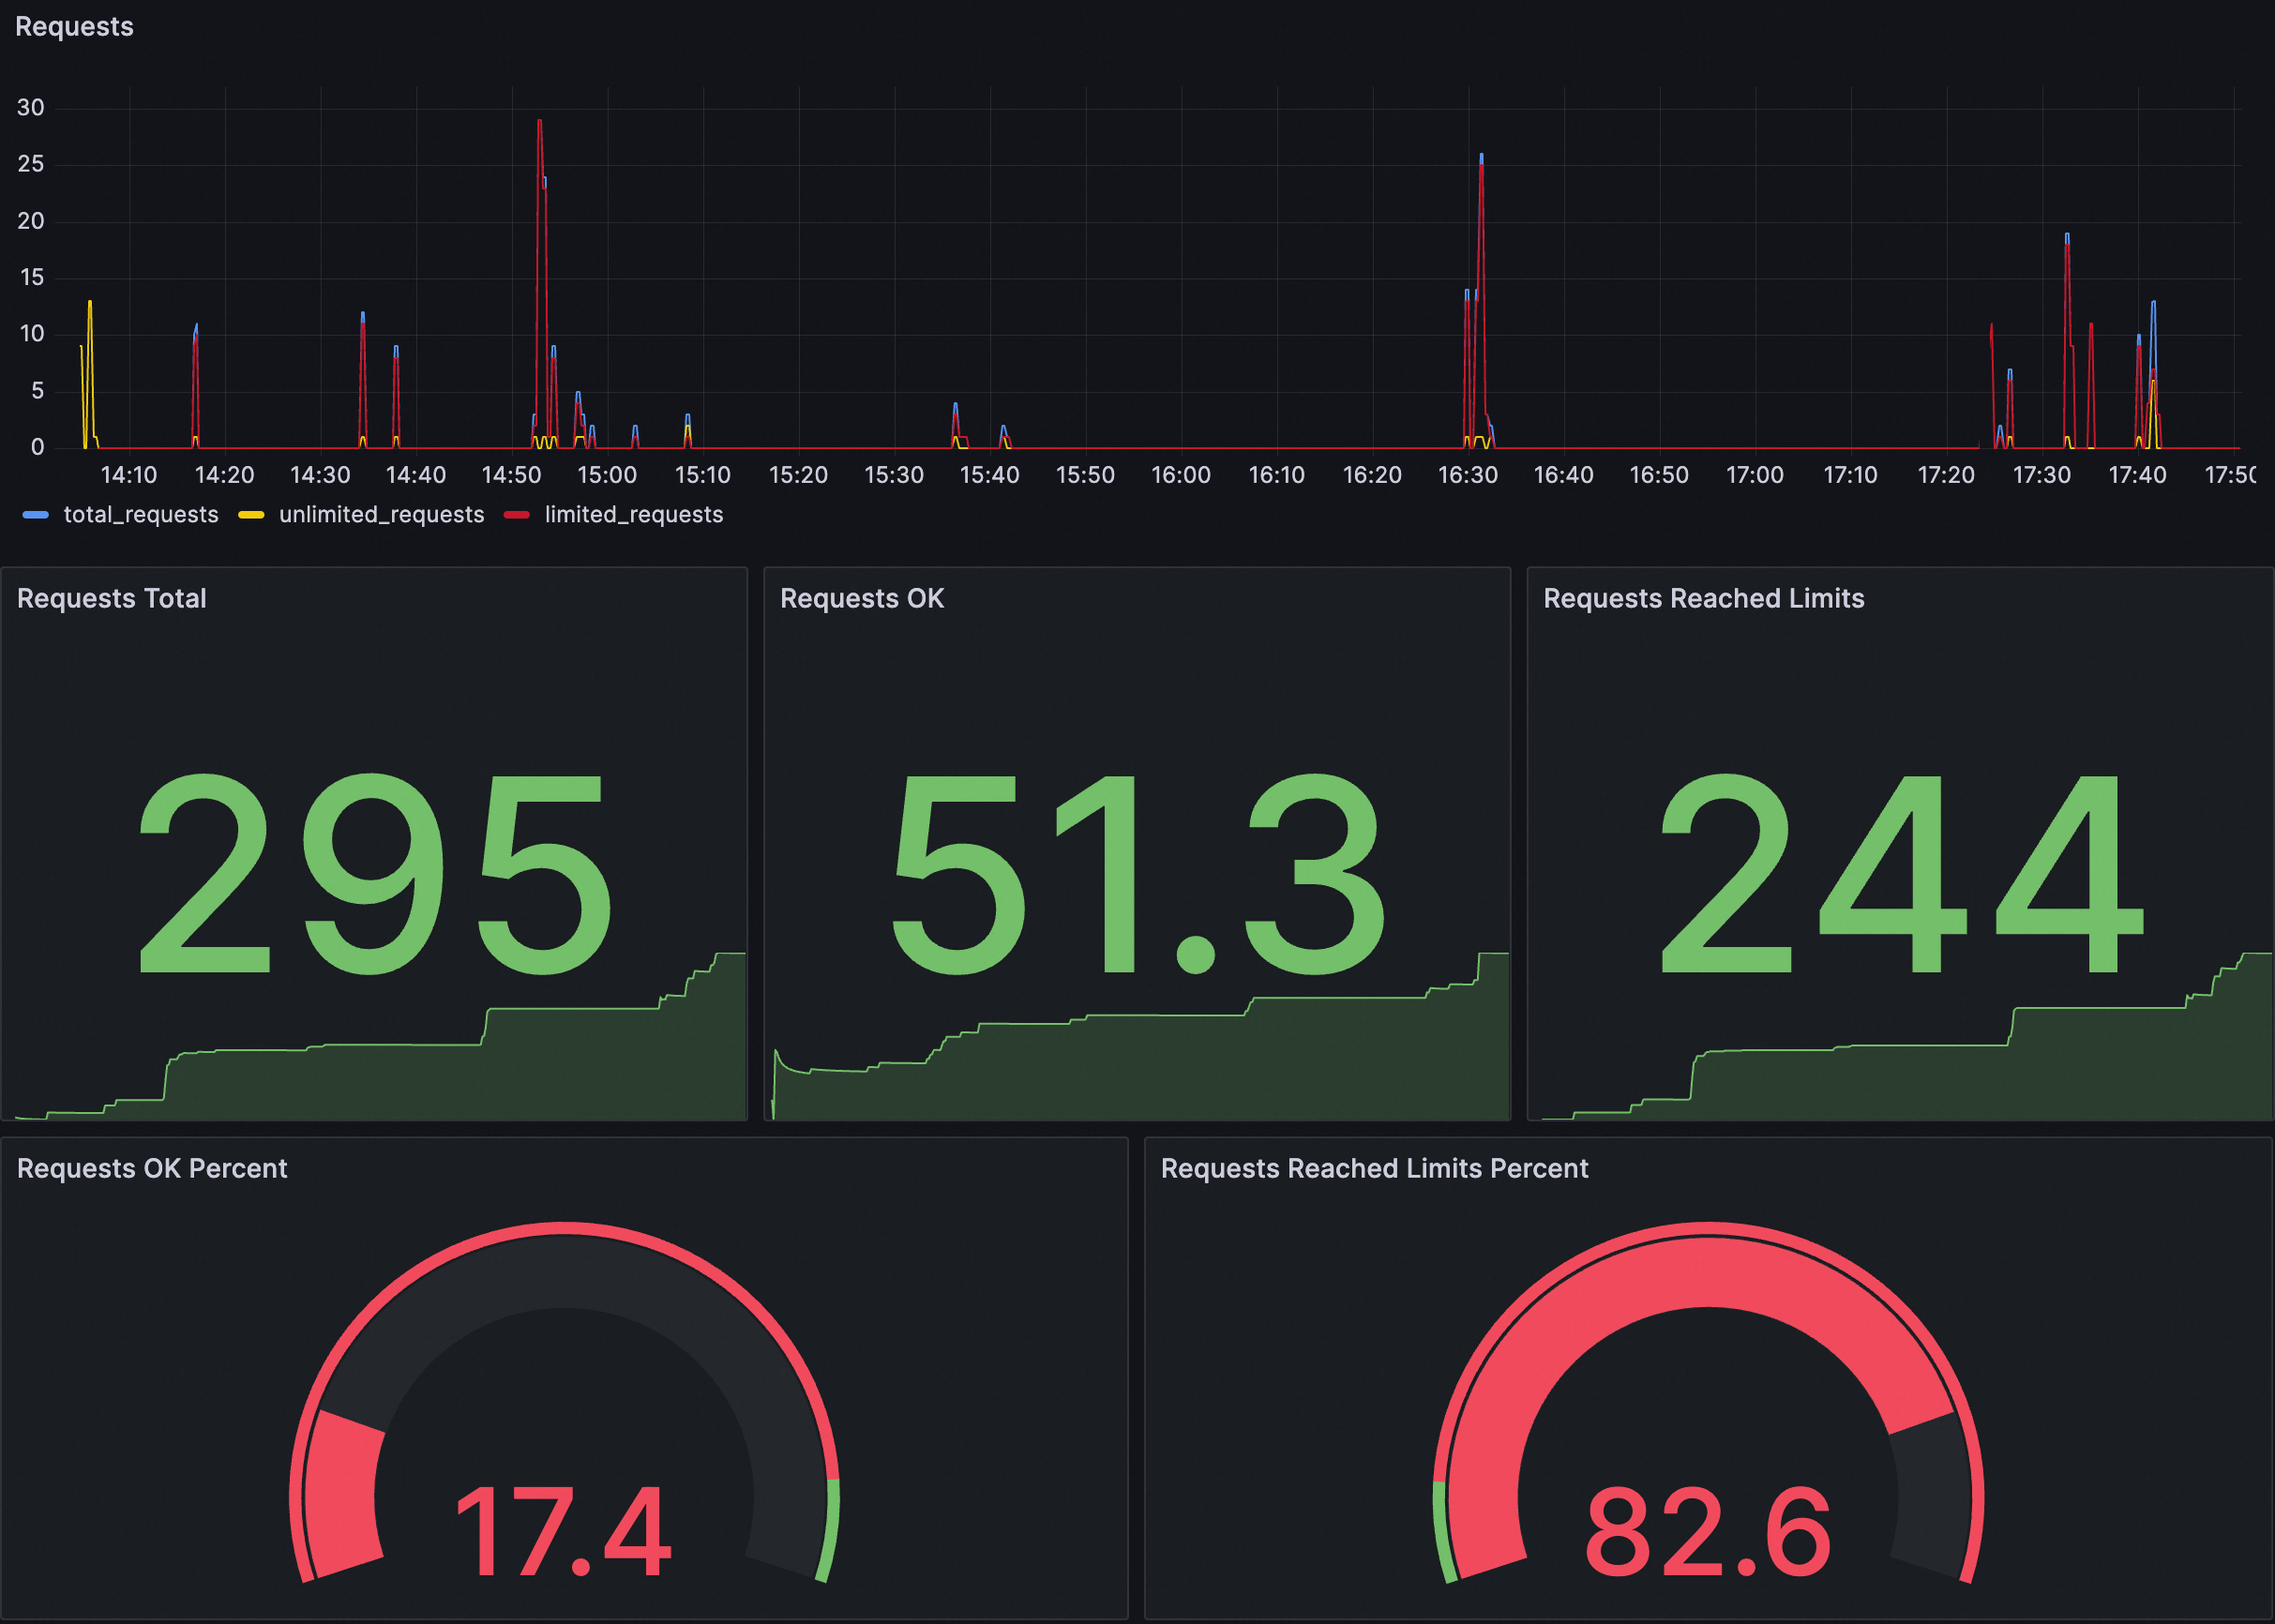
Tabel berikut menjelaskan setiap panel.
|
Panel |
Deskripsi |
|
Requests |
Memberikan ikhtisar permintaan, termasuk metrik berikut:
|
|
Requests OK Percent |
Persentase permintaan yang diizinkan. |
|
Requests Reached Limits Percent |
Persentase permintaan yang dibatasi (throttled). |
Anda dapat mengimpor JSON berikut ke dalam dasbor Grafana untuk membuat dasbor global throttling bagi kluster Anda. Anda juga dapat memodifikasi JSON ini atau menggunakannya untuk membuat dasbor sendiri.
JSON Dasbor
{
"annotations": {
"list": [
{
"builtIn": 1,
"datasource": {
"type": "grafana",
"uid": "-- Grafana --"
},
"enable": true,
"hide": true,
"iconColor": "rgba(0, 211, 255, 1)",
"name": "Annotations & Alerts",
"type": "dashboard"
}
]
},
"editable": true,
"fiscalYearStartMonth": 0,
"graphTooltip": 0,
"id": 166,
"links": [],
"liveNow": false,
"panels": [
{
"datasource": {
"type": "prometheus",
"uid": "${DS_PROMETHEUS}"
},
"fieldConfig": {
"defaults": {
"color": {
"mode": "palette-classic"
},
"custom": {
"axisCenteredZero": false,
"axisColorMode": "text",
"axisLabel": "",
"axisPlacement": "auto",
"barAlignment": 0,
"drawStyle": "line",
"fillOpacity": 0,
"gradientMode": "none",
"hideFrom": {
"legend": false,
"tooltip": false,
"viz": false
},
"lineInterpolation": "linear",
"lineWidth": 1,
"pointSize": 5,
"scaleDistribution": {
"type": "linear"
},
"showPoints": "auto",
"stacking": {
"group": "A",
"mode": "none"
}
},
"mappings": [],
"thresholds": {
"mode": "absolute",
"steps": [
{
"color": "green",
"value": null
}
]
}
},
"overrides": [
{
"matcher": {
"id": "byName",
"options": "total_requests"
},
"properties": [
{
"id": "color",
"value": {
"fixedColor": "blue",
"mode": "fixed"
}
}
]
},
{
"matcher": {
"id": "byName",
"options": "unlimited_requests"
},
"properties": [
{
"id": "color",
"value": {
"fixedColor": "dark-green",
"mode": "fixed"
}
}
]
},
{
"matcher": {
"id": "byName",
"options": "limited_requests"
},
"properties": [
{
"id": "color",
"value": {
"fixedColor": "dark-red",
"mode": "fixed"
}
}
]
}
]
},
"gridPos": {
"h": 8,
"w": 12,
"x": 0,
"y": 0
},
"id": 1,
"options": {
"legend": {
"calcs": [],
"displayMode": "list",
"placement": "bottom",
"showLegend": true
},
"tooltip": {
"mode": "single",
"sort": "none",
"targets": []
}
},
"pluginVersion": "10.0.9",
"targets": [
{
"datasource": {
"type": "prometheus",
"uid": "${DS_PROMETHEUS}"
},
"editorMode": "code",
"exemplar": false,
"expr": "sum(rate(envoy_cluster_ratelimit_ok{namespace=~\"$namespace\",pod_name=~\"$pod\",service_istio_io_canonical_name=~\"$service\"}[60s])) * 30 + sum(rate(envoy_cluster_ratelimit_over_limit{namespace=~\"$namespace\",pod_name=~\"$pod\",service_istio_io_canonical_name=~\"$service\"}[60s])) * 30",
"format": "time_series",
"instant": false,
"legendFormat": "total_requests",
"range": true,
"refId": "A"
},
{
"datasource": {
"type": "prometheus",
"uid": "${DS_PROMETHEUS}"
},
"editorMode": "code",
"exemplar": false,
"expr": "sum(rate(envoy_cluster_ratelimit_ok{namespace=~\"$namespace\", pod_name=~\"$pod\", service_istio_io_canonical_name=~\"$service\"}[60s])) * 30",
"format": "time_series",
"hide": false,
"instant": false,
"legendFormat": "unlimited_requests",
"range": true,
"refId": "B"
},
{
"datasource": {
"type": "prometheus",
"uid": "${DS_PROMETHEUS}"
},
"editorMode": "code",
"expr": "sum(rate(envoy_cluster_ratelimit_over_limit{namespace=~\"$namespace\",pod_name=~\"$pod\",service_istio_io_canonical_name=~\"$service\"}[60s])) * 30",
"hide": false,
"instant": false,
"legendFormat": "limited_requests",
"range": true,
"refId": "C"
}
],
"title": "Requests",
"transparent": true,
"type": "aliyun-timeseries-panel"
},
{
"datasource": {
"type": "prometheus",
"uid": "${DS_PROMETHEUS}"
},
"fieldConfig": {
"defaults": {
"color": {
"mode": "thresholds"
},
"mappings": [],
"thresholds": {
"mode": "absolute",
"steps": [
{
"color": "green",
"value": null
}
]
}
},
"overrides": []
},
"gridPos": {
"h": 8,
"w": 4,
"x": 0,
"y": 8
},
"id": 2,
"options": {
"colorMode": "value",
"graphMode": "area",
"justifyMode": "auto",
"orientation": "auto",
"reduceOptions": {
"calcs": [
"lastNotNull"
],
"fields": "",
"values": false
},
"textMode": "auto"
},
"pluginVersion": "10.0.9",
"targets": [
{
"datasource": {
"type": "prometheus",
"uid": "${DS_PROMETHEUS}"
},
"editorMode": "code",
"expr": "sum(increase(envoy_cluster_ratelimit_ok{namespace=~\"$namespace\", pod_name=~\"$pod\", service_istio_io_canonical_name=~\"$service\"}[$__range])) + sum(increase(envoy_cluster_ratelimit_over_limit{namespace=~\"$namespace\", pod_name=~\"$pod\", service_istio_io_canonical_name=~\"$service\"}[$__range]))",
"instant": false,
"range": true,
"refId": "A"
}
],
"title": "Requests Total",
"type": "stat"
},
{
"datasource": {
"type": "prometheus",
"uid": "${DS_PROMETHEUS}"
},
"fieldConfig": {
"defaults": {
"color": {
"mode": "thresholds"
},
"mappings": [],
"thresholds": {
"mode": "absolute",
"steps": [
{
"color": "green",
"value": null
}
]
}
},
"overrides": []
},
"gridPos": {
"h": 8,
"w": 4,
"x": 4,
"y": 8
},
"id": 5,
"options": {
"colorMode": "value",
"graphMode": "area",
"justifyMode": "auto",
"orientation": "auto",
"reduceOptions": {
"calcs": [
"lastNotNull"
],
"fields": "",
"values": false
},
"textMode": "auto"
},
"pluginVersion": "10.0.9",
"targets": [
{
"datasource": {
"type": "prometheus",
"uid": "${DS_PROMETHEUS}"
},
"editorMode": "code",
"expr": "sum(increase(envoy_cluster_ratelimit_ok{namespace=~\"$namespace\", pod_name=~\"$pod\", service_istio_io_canonical_name=~\"$service\"}[$__range]))",
"instant": false,
"range": true,
"refId": "A"
}
],
"title": "Requests OK",
"type": "stat"
},
{
"datasource": {
"type": "prometheus",
"uid": "${DS_PROMETHEUS}"
},
"fieldConfig": {
"defaults": {
"color": {
"mode": "thresholds"
},
"mappings": [],
"thresholds": {
"mode": "absolute",
"steps": [
{
"color": "green",
"value": null
}
]
}
},
"overrides": []
},
"gridPos": {
"h": 8,
"w": 4,
"x": 8,
"y": 8
},
"id": 4,
"options": {
"colorMode": "value",
"graphMode": "area",
"justifyMode": "auto",
"orientation": "auto",
"reduceOptions": {
"calcs": [
"lastNotNull"
],
"fields": "",
"values": false
},
"textMode": "auto"
},
"pluginVersion": "10.0.9",
"targets": [
{
"datasource": {
"type": "prometheus",
"uid": "${DS_PROMETHEUS}"
},
"editorMode": "code",
"expr": "sum(increase(envoy_cluster_ratelimit_over_limit{namespace=~\"$namespace\", pod_name=~\"$pod\", service_istio_io_canonical_name=~\"$service\"}[$__range]))",
"instant": false,
"range": true,
"refId": "A"
}
],
"title": "Requests Reached Limits",
"type": "stat"
},
{
"datasource": {
"type": "prometheus",
"uid": "${DS_PROMETHEUS}"
},
"fieldConfig": {
"defaults": {
"color": {
"mode": "thresholds"
},
"custom": {
"neutral": -1
},
"mappings": [],
"max": 100,
"min": 0,
"thresholds": {
"mode": "percentage",
"steps": [
{
"color": "red",
"value": null
},
{
"color": "green",
"value": 90
}
]
}
},
"overrides": []
},
"gridPos": {
"h": 7,
"w": 6,
"x": 0,
"y": 16
},
"id": 6,
"options": {
"orientation": "auto",
"reduceOptions": {
"calcs": [
"lastNotNull"
],
"fields": "",
"values": false
},
"showThresholdLabels": false,
"showThresholdMarkers": true
},
"pluginVersion": "10.0.9",
"targets": [
{
"datasource": {
"type": "prometheus",
"uid": "${DS_PROMETHEUS}"
},
"editorMode": "code",
"expr": "sum(increase(envoy_cluster_ratelimit_ok{namespace=~\"$namespace\", pod_name=~\"$pod\", service_istio_io_canonical_name=~\"$service\"}[$__range])) / (sum(increase(envoy_cluster_ratelimit_ok{namespace=~\"$namespace\", pod_name=~\"$pod\", service_istio_io_canonical_name=~\"$service\"}[$__range])) + sum(increase(envoy_cluster_ratelimit_over_limit{namespace=~\"$namespace\", pod_name=~\"$pod\", service_istio_io_canonical_name=~\"$service\"}[$__range]))) * 100",
"instant": false,
"range": true,
"refId": "A"
}
],
"title": "Requests OK Percent",
"type": "gauge"
},
{
"datasource": {
"type": "prometheus",
"uid": "${DS_PROMETHEUS}"
},
"fieldConfig": {
"defaults": {
"color": {
"mode": "thresholds"
},
"custom": {
"neutral": -1
},
"mappings": [],
"max": 100,
"min": 0,
"thresholds": {
"mode": "percentage",
"steps": [
{
"color": "green",
"value": null
},
{
"color": "red",
"value": 10
}
]
}
},
"overrides": []
},
"gridPos": {
"h": 7,
"w": 6,
"x": 6,
"y": 16
},
"id": 7,
"options": {
"orientation": "auto",
"reduceOptions": {
"calcs": [
"lastNotNull"
],
"fields": "",
"values": false
},
"showThresholdLabels": false,
"showThresholdMarkers": true
},
"pluginVersion": "10.0.9",
"targets": [
{
"datasource": {
"type": "prometheus",
"uid": "${DS_PROMETHEUS}"
},
"editorMode": "code",
"expr": "sum(increase(envoy_cluster_ratelimit_over_limit{namespace=~\"$namespace\", pod_name=~\"$pod\", service_istio_io_canonical_name=~\"$service\"}[$__range])) / (sum(increase(envoy_cluster_ratelimit_ok{namespace=~\"$namespace\", pod_name=~\"$pod\", service_istio_io_canonical_name=~\"$service\"}[$__range])) + sum(increase(envoy_cluster_ratelimit_over_limit{namespace=~\"$namespace\", pod_name=~\"$pod\", service_istio_io_canonical_name=~\"$service\"}[$__range]))) * 100",
"instant": false,
"range": true,
"refId": "A"
}
],
"title": "Requests Reached Limits Percent",
"type": "gauge"
}
],
"refresh": "",
"schemaVersion": 38,
"style": "dark",
"tags": [],
"templating": {
"list": [
{
"current": {
"selected": false,
"text": "datasource",
"value": "datasource"
},
"hide": 0,
"includeAll": false,
"label": "datasource",
"multi": false,
"name": "DS_PROMETHEUS",
"options": [],
"query": "prometheus",
"queryValue": "datasource",
"refresh": 1,
"regex": "",
"skipUrlSync": false,
"type": "datasource"
},
{
"allValue": ".*",
"current": {
"selected": false,
"text": "All",
"value": "$__all"
},
"datasource": {
"type": "prometheus",
"uid": "ykIxRIhNk"
},
"definition": "query_result(sum(envoy_cluster_ratelimit_over_limit) by (namespace) or sum(envoy_cluster_ratelimit_ok) by (namespace))",
"hide": 0,
"includeAll": true,
"label": "namespace",
"multi": false,
"name": "namespace",
"options": [],
"query": {
"query": "query_result(sum(envoy_cluster_ratelimit_over_limit) by (namespace) or sum(envoy_cluster_ratelimit_ok) by (namespace))",
"refId": "PrometheusVariableQueryEditor-VariableQuery"
},
"refresh": 1,
"regex": "/.*namespace=\"(.*)\".*/",
"skipUrlSync": false,
"sort": 0,
"type": "query"
},
{
"allValue": ".*",
"current": {
"selected": false,
"text": "All",
"value": "$__all"
},
"datasource": {
"type": "prometheus",
"uid": "ykIxRIhNk"
},
"definition": "query_result(sum(envoy_cluster_ratelimit_over_limit) by (pod_name) or sum(envoy_cluster_ratelimit_ok) by (pod_name))",
"description": "",
"hide": 0,
"includeAll": true,
"label": "pod",
"multi": false,
"name": "pod",
"options": [],
"query": {
"query": "query_result(sum(envoy_cluster_ratelimit_over_limit) by (pod_name) or sum(envoy_cluster_ratelimit_ok) by (pod_name))",
"refId": "PrometheusVariableQueryEditor-VariableQuery"
},
"refresh": 1,
"regex": "/.*pod_name=\"(.*)\".*/",
"skipUrlSync": false,
"sort": 0,
"type": "query"
},
{
"allValue": ".*",
"current": {
"selected": false,
"text": "All",
"value": "$__all"
},
"datasource": {
"type": "prometheus",
"uid": "ykIxRIhNk"
},
"definition": "query_result(sum(envoy_cluster_ratelimit_over_limit) by (service_istio_io_canonical_name) or sum(envoy_cluster_ratelimit_ok) by (service_istio_io_canonical_name))",
"hide": 0,
"includeAll": true,
"label": "service",
"multi": false,
"name": "service",
"options": [],
"query": {
"query": "query_result(sum(envoy_cluster_ratelimit_over_limit) by (service_istio_io_canonical_name) or sum(envoy_cluster_ratelimit_ok) by (service_istio_io_canonical_name))",
"refId": "PrometheusVariableQueryEditor-VariableQuery"
},
"refresh": 1,
"regex": "/.*service_istio_io_canonical_name=\"(.*)\".*/",
"skipUrlSync": false,
"sort": 0,
"type": "query"
}
]
},
"time": {
"from": "now-5m",
"to": "now"
},
"timepicker": {},
"timezone": "browser",
"title": "Global Rate Limit",
"uid": "d8f95bbc-efb6-41e7-8929-25551b22f3d2",
"version": 25,
"weekStart": ""
}Contoh aturan peringatan
|
Konfigurasi Peringatan |
Contoh |
Deskripsi |
|
Ekspresi PromQL |
sum (increase(envoy_cluster_ratelimit_over_limit[1m])) by (namespace, service_istio_io_canonical_name) > 10 |
Menghitung jumlah permintaan yang dibatasi dalam satu menit terakhir, dikelompokkan berdasarkan namespace dan nama layanan. Peringatan dipicu jika jumlah tersebut melebihi 10. |
|
Pesan peringatan |
Throttling dipicu! Namespace: {{$labels.namespace}}, Layanan target: {{$labels.service_istio_io_canonical_name}}. Jumlah permintaan yang dibatasi dalam satu menit terakhir: {{ $value }} |
Menentukan format pesan peringatan. Pesan ini mencakup namespace, nama layanan, dan jumlah permintaan yang dibatasi dalam satu menit terakhir. |
Local throttling
Proxy Envoy menggunakan algoritma token bucket untuk menerapkan local throttling. Algoritma ini membatasi jumlah permintaan yang dikirim ke suatu layanan dengan mempertahankan bucket token yang diisi ulang pada laju tetap. Setiap permintaan ke layanan mengonsumsi satu token. Jika bucket kosong, proxy Envoy akan menolak permintaan tersebut.
Anda dapat mengombinasikan local throttling dengan global throttling untuk memberikan perlindungan berlapis.
Contoh dasbor
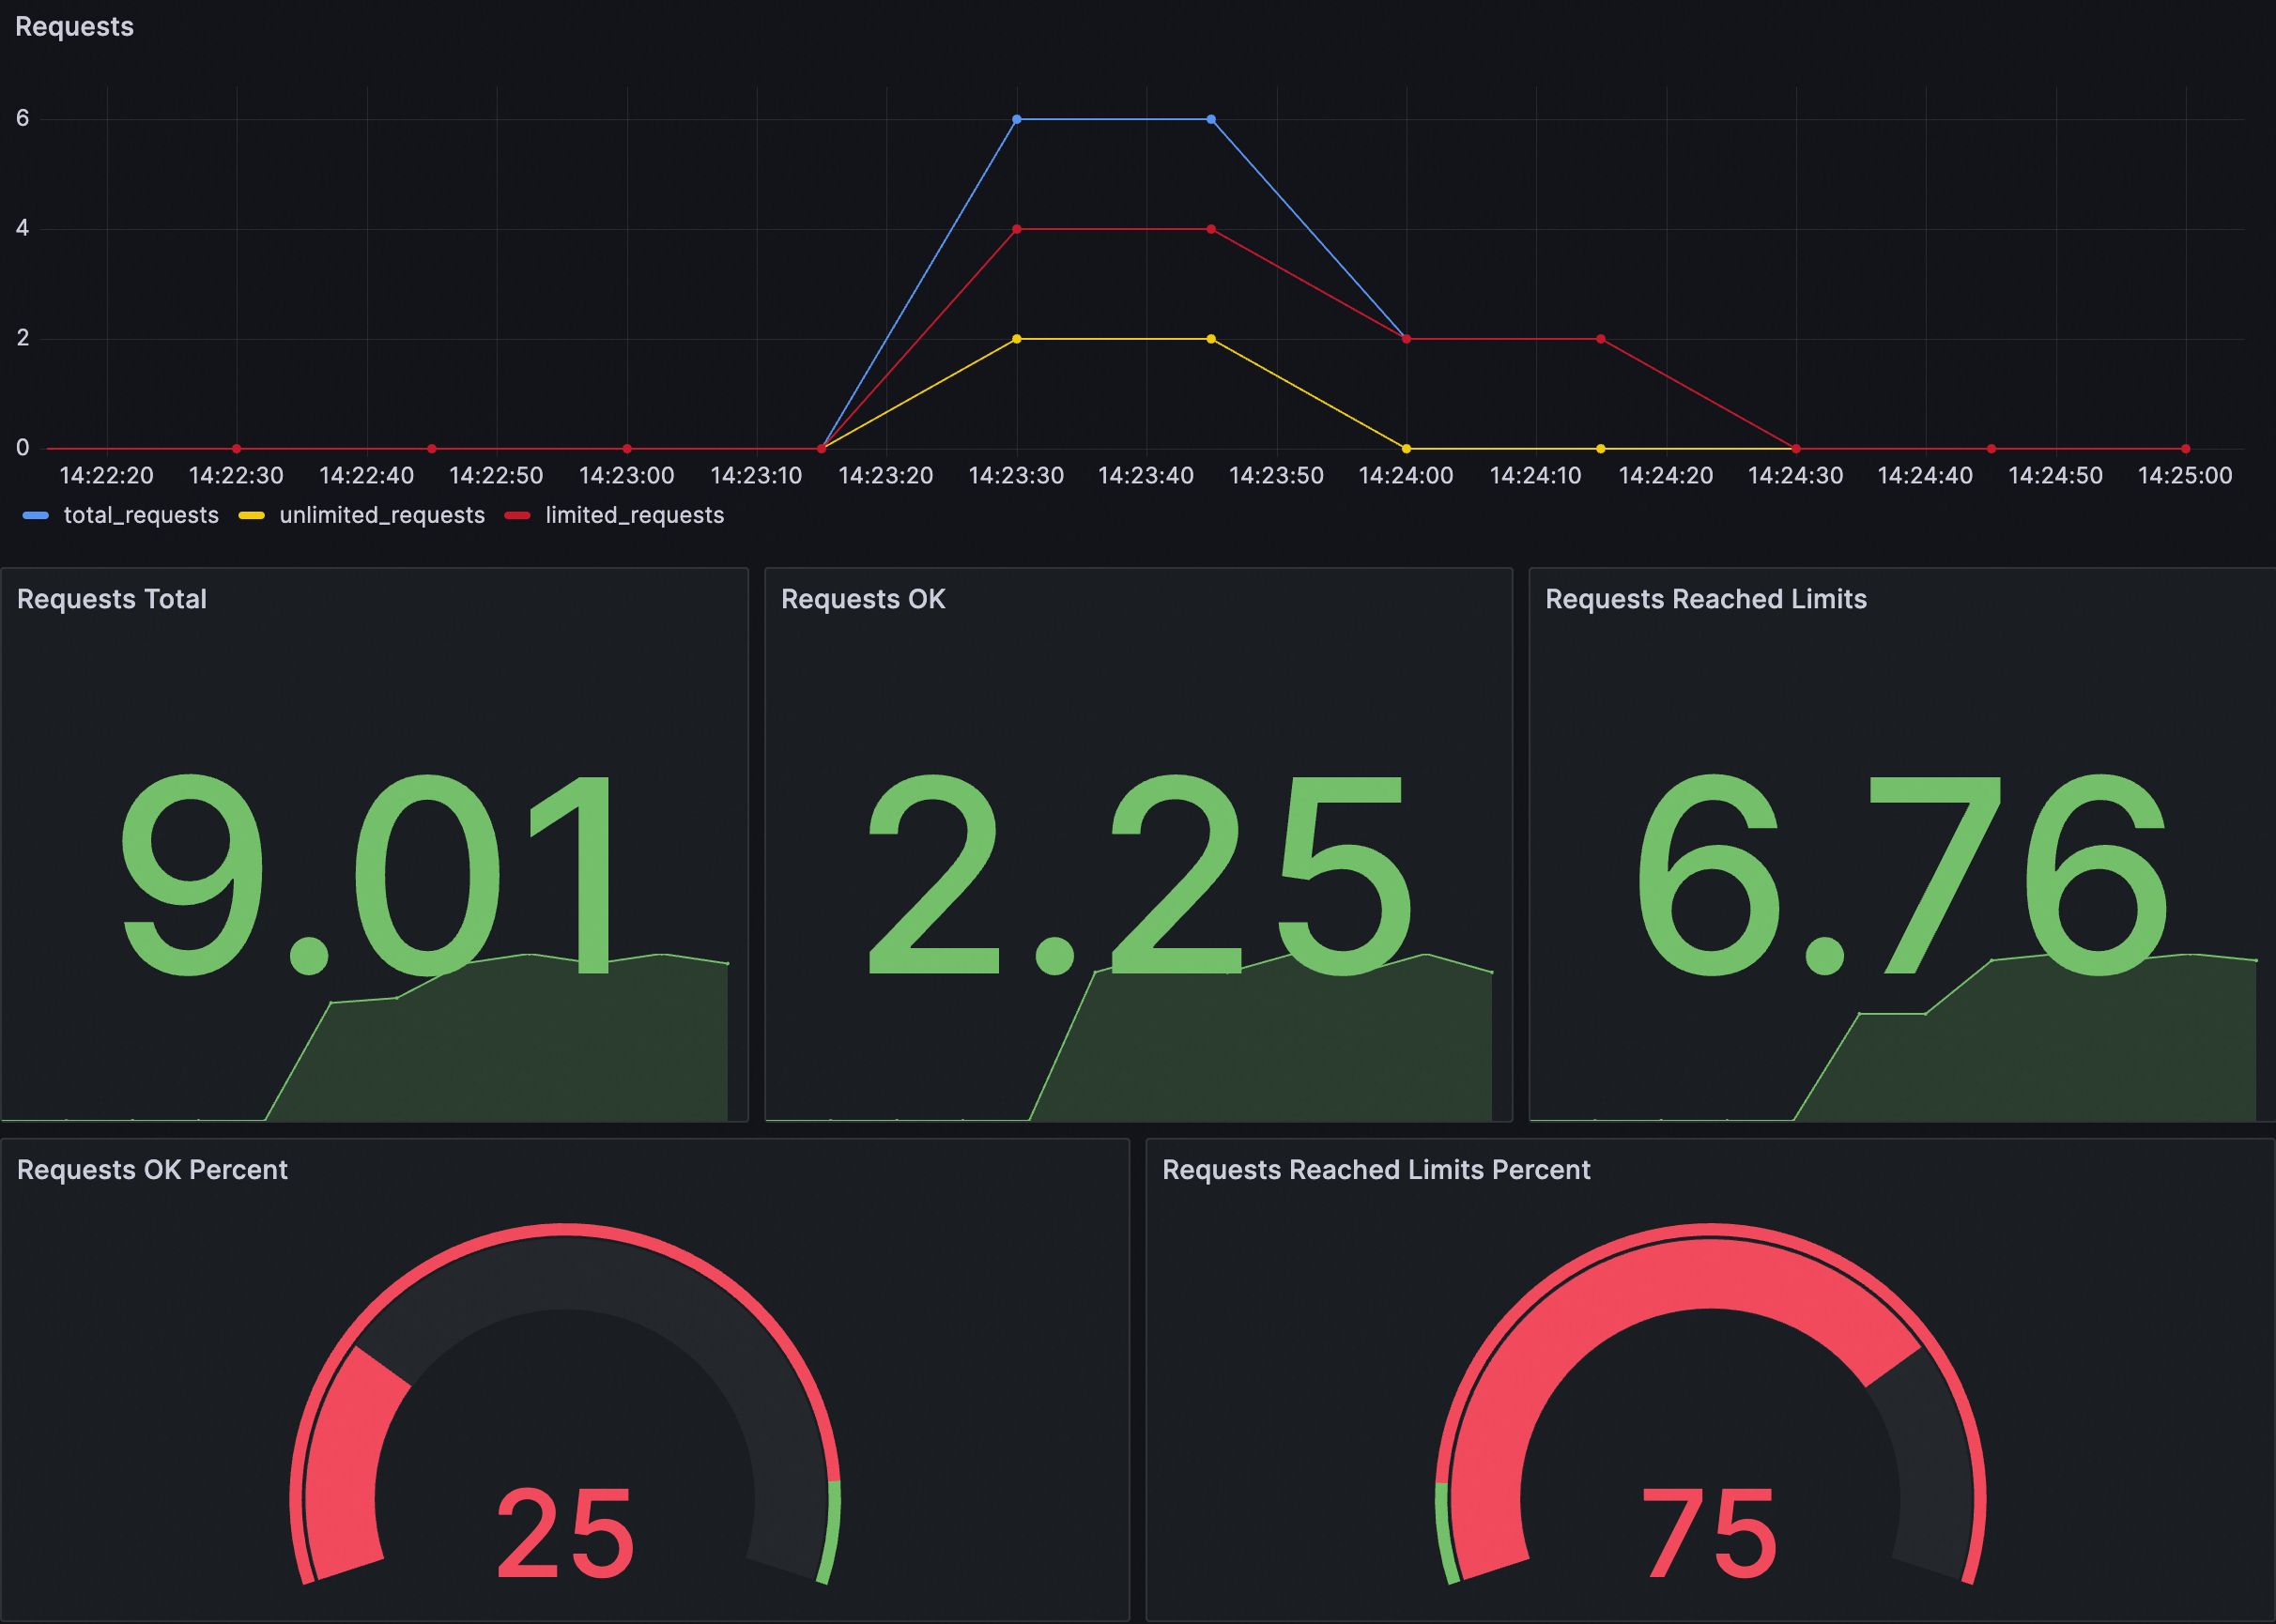
Tabel berikut menjelaskan setiap panel:
|
Panel |
Deskripsi |
|
Requests |
Menampilkan ikhtisar permintaan, termasuk metrik berikut:
|
|
Requests OK Percent |
Persentase permintaan yang diizinkan dari total permintaan. |
|
Requests Reached Limits Percent |
Persentase permintaan yang dibatasi dari total permintaan. |
Impor JSON berikut ke dalam dasbor Grafana untuk membuat dasbor local throttling bagi kluster Anda. Anda juga dapat memodifikasi JSON ini atau menggunakannya sebagai templat untuk membuat dasbor kustom.
JSON Dasbor
{
"annotations": {
"list": [
{
"builtIn": 1,
"datasource": {
"type": "grafana",
"uid": "-- Grafana --"
},
"enable": true,
"hide": true,
"iconColor": "rgba(0, 211, 255, 1)",
"name": "Annotations & Alerts",
"type": "dashboard"
}
]
},
"editable": true,
"fiscalYearStartMonth": 0,
"graphTooltip": 0,
"id": 167,
"links": [],
"liveNow": false,
"panels": [
{
"datasource": {
"type": "prometheus",
"uid": "${DS_PROMETHEUS}"
},
"fieldConfig": {
"defaults": {
"color": {
"mode": "palette-classic"
},
"custom": {
"axisCenteredZero": false,
"axisColorMode": "text",
"axisLabel": "",
"axisPlacement": "auto",
"barAlignment": 0,
"drawStyle": "line",
"fillOpacity": 0,
"gradientMode": "none",
"hideFrom": {
"legend": false,
"tooltip": false,
"viz": false
},
"lineInterpolation": "linear",
"lineWidth": 1,
"pointSize": 5,
"scaleDistribution": {
"type": "linear"
},
"showPoints": "auto",
"stacking": {
"group": "A",
"mode": "none"
}
},
"mappings": [],
"thresholds": {
"mode": "absolute",
"steps": [
{
"color": "green",
"value": null
}
]
}
},
"overrides": [
{
"matcher": {
"id": "byName",
"options": "total_requests"
},
"properties": [
{
"id": "color",
"value": {
"fixedColor": "blue",
"mode": "fixed"
}
}
]
},
{
"matcher": {
"id": "byName",
"options": "unlimited_requests"
},
"properties": [
{
"id": "color",
"value": {
"fixedColor": "dark-green",
"mode": "fixed"
}
}
]
},
{
"matcher": {
"id": "byName",
"options": "limited_requests"
},
"properties": [
{
"id": "color",
"value": {
"fixedColor": "dark-red",
"mode": "fixed"
}
}
]
}
]
},
"gridPos": {
"h": 8,
"w": 12,
"x": 0,
"y": 0
},
"id": 1,
"options": {
"legend": {
"calcs": [],
"displayMode": "list",
"placement": "bottom",
"showLegend": true
},
"tooltip": {
"mode": "single",
"sort": "none",
"targets": []
}
},
"pluginVersion": "10.0.9",
"targets": [
{
"datasource": {
"type": "prometheus",
"uid": "${DS_PROMETHEUS}"
},
"editorMode": "code",
"exemplar": false,
"expr": "sum(rate(envoy_http_local_rate_limiter_http_local_rate_limit_enabled{namespace=~\"$namespace\",pod_name=~\"$pod\",service_istio_io_canonical_name=~\"$service\"}[60s])) * 30",
"format": "time_series",
"instant": false,
"legendFormat": "total_requests",
"range": true,
"refId": "A"
},
{
"datasource": {
"type": "prometheus",
"uid": "${DS_PROMETHEUS}"
},
"editorMode": "code",
"exemplar": false,
"expr": "sum(rate(envoy_http_local_rate_limiter_http_local_rate_limit_ok{namespace=~\"$namespace\", pod_name=~\"$pod\", service_istio_io_canonical_name=~\"$service\"}[60s])) * 30",
"format": "time_series",
"hide": false,
"instant": false,
"legendFormat": "unlimited_requests",
"range": true,
"refId": "B"
},
{
"datasource": {
"type": "prometheus",
"uid": "${DS_PROMETHEUS}"
},
"editorMode": "code",
"expr": "sum(rate(envoy_http_local_rate_limiter_http_local_rate_limit_enforced{namespace=~\"$namespace\",pod_name=~\"$pod\",service_istio_io_canonical_name=~\"$service\"}[60s])) * 30",
"hide": false,
"instant": false,
"legendFormat": "limited_requests",
"range": true,
"refId": "C"
}
],
"title": "Requests",
"transparent": true,
"type": "aliyun-timeseries-panel"
},
{
"datasource": {
"type": "prometheus",
"uid": "${DS_PROMETHEUS}"
},
"fieldConfig": {
"defaults": {
"color": {
"mode": "thresholds"
},
"mappings": [],
"thresholds": {
"mode": "absolute",
"steps": [
{
"color": "green",
"value": null
}
]
}
},
"overrides": []
},
"gridPos": {
"h": 8,
"w": 4,
"x": 0,
"y": 8
},
"id": 2,
"options": {
"colorMode": "value",
"graphMode": "area",
"justifyMode": "auto",
"orientation": "auto",
"reduceOptions": {
"calcs": [
"lastNotNull"
],
"fields": "",
"values": false
},
"textMode": "auto"
},
"pluginVersion": "10.0.9",
"targets": [
{
"datasource": {
"type": "prometheus",
"uid": "${DS_PROMETHEUS}"
},
"editorMode": "code",
"expr": "sum(increase(envoy_http_local_rate_limiter_http_local_rate_limit_enabled{namespace=~\"$namespace\", pod_name=~\"$pod\", service_istio_io_canonical_name=~\"$service\"}[$__range]))",
"instant": false,
"range": true,
"refId": "A"
}
],
"title": "Requests Total",
"type": "stat"
},
{
"datasource": {
"type": "prometheus",
"uid": "${DS_PROMETHEUS}"
},
"fieldConfig": {
"defaults": {
"color": {
"mode": "thresholds"
},
"mappings": [],
"thresholds": {
"mode": "absolute",
"steps": [
{
"color": "green",
"value": null
}
]
}
},
"overrides": []
},
"gridPos": {
"h": 8,
"w": 4,
"x": 4,
"y": 8
},
"id": 5,
"options": {
"colorMode": "value",
"graphMode": "area",
"justifyMode": "auto",
"orientation": "auto",
"reduceOptions": {
"calcs": [
"lastNotNull"
],
"fields": "",
"values": false
},
"textMode": "auto"
},
"pluginVersion": "10.0.9",
"targets": [
{
"datasource": {
"type": "prometheus",
"uid": "${DS_PROMETHEUS}"
},
"editorMode": "code",
"expr": "sum(increase(envoy_http_local_rate_limiter_http_local_rate_limit_ok{namespace=~\"$namespace\", pod_name=~\"$pod\", service_istio_io_canonical_name=~\"$service\"}[$__range]))",
"instant": false,
"range": true,
"refId": "A"
}
],
"title": "Requests OK",
"type": "stat"
},
{
"datasource": {
"type": "prometheus",
"uid": "${DS_PROMETHEUS}"
},
"fieldConfig": {
"defaults": {
"color": {
"mode": "thresholds"
},
"mappings": [],
"thresholds": {
"mode": "absolute",
"steps": [
{
"color": "green",
"value": null
}
]
}
},
"overrides": []
},
"gridPos": {
"h": 8,
"w": 4,
"x": 8,
"y": 8
},
"id": 4,
"options": {
"colorMode": "value",
"graphMode": "area",
"justifyMode": "auto",
"orientation": "auto",
"reduceOptions": {
"calcs": [
"lastNotNull"
],
"fields": "",
"values": false
},
"textMode": "auto"
},
"pluginVersion": "10.0.9",
"targets": [
{
"datasource": {
"type": "prometheus",
"uid": "${DS_PROMETHEUS}"
},
"editorMode": "code",
"expr": "sum(increase(envoy_http_local_rate_limiter_http_local_rate_limit_enforced{namespace=~\"$namespace\", pod_name=~\"$pod\", service_istio_io_canonical_name=~\"$service\"}[$__range]))",
"instant": false,
"range": true,
"refId": "A"
}
],
"title": "Requests Reached Limits",
"type": "stat"
},
{
"datasource": {
"type": "prometheus",
"uid": "${DS_PROMETHEUS}"
},
"fieldConfig": {
"defaults": {
"color": {
"mode": "thresholds"
},
"custom": {
"neutral": -1
},
"mappings": [],
"max": 100,
"min": 0,
"thresholds": {
"mode": "percentage",
"steps": [
{
"color": "red",
"value": null
},
{
"color": "green",
"value": 90
}
]
}
},
"overrides": []
},
"gridPos": {
"h": 7,
"w": 6,
"x": 0,
"y": 16
},
"id": 6,
"options": {
"orientation": "auto",
"reduceOptions": {
"calcs": [
"lastNotNull"
],
"fields": "",
"values": false
},
"showThresholdLabels": false,
"showThresholdMarkers": true
},
"pluginVersion": "10.0.9",
"targets": [
{
"datasource": {
"type": "prometheus",
"uid": "${DS_PROMETHEUS}"
},
"editorMode": "code",
"expr": "sum(increase(envoy_http_local_rate_limiter_http_local_rate_limit_ok{namespace=~\"$namespace\", pod_name=~\"$pod\", service_istio_io_canonical_name=~\"$service\"}[$__range])) / sum(increase(envoy_http_local_rate_limiter_http_local_rate_limit_enabled{namespace=~\"$namespace\", pod_name=~\"$pod\", service_istio_io_canonical_name=~\"$service\"}[$__range])) * 100",
"instant": false,
"range": true,
"refId": "A"
}
],
"title": "Requests OK Percent",
"type": "gauge"
},
{
"datasource": {
"type": "prometheus",
"uid": "${DS_PROMETHEUS}"
},
"fieldConfig": {
"defaults": {
"color": {
"mode": "thresholds"
},
"custom": {
"neutral": -1
},
"mappings": [],
"max": 100,
"min": 0,
"thresholds": {
"mode": "percentage",
"steps": [
{
"color": "green",
"value": null
},
{
"color": "red",
"value": 10
}
]
}
},
"overrides": []
},
"gridPos": {
"h": 7,
"w": 6,
"x": 6,
"y": 16
},
"id": 7,
"options": {
"orientation": "auto",
"reduceOptions": {
"calcs": [
"lastNotNull"
],
"fields": "",
"values": false
},
"showThresholdLabels": false,
"showThresholdMarkers": true
},
"pluginVersion": "10.0.9",
"targets": [
{
"datasource": {
"type": "prometheus",
"uid": "${DS_PROMETHEUS}"
},
"editorMode": "code",
"expr": "sum(increase(envoy_http_local_rate_limiter_http_local_rate_limit_enforced{namespace=~\"$namespace\", pod_name=~\"$pod\", service_istio_io_canonical_name=~\"$service\"}[$__range])) / sum(increase(envoy_http_local_rate_limiter_http_local_rate_limit_enabled{namespace=~\"$namespace\", pod_name=~\"$pod\", service_istio_io_canonical_name=~\"$service\"}[$__range])) * 100",
"instant": false,
"range": true,
"refId": "A"
}
],
"title": "Requests Reached Limits Percent",
"type": "gauge"
}
],
"refresh": "",
"schemaVersion": 38,
"style": "dark",
"tags": [],
"templating": {
"list": [
{
"allValue": ".*",
"current": {
"selected": false,
"text": "datasource",
"value": "datasource"
},
"hide": 0,
"includeAll": false,
"label": "datasource",
"multi": false,
"name": "DS_PROMETHEUS",
"options": [],
"query": "prometheus",
"queryValue": "datasource",
"refresh": 1,
"regex": "",
"skipUrlSync": false,
"type": "datasource"
},
{
"allValue": ".*",
"current": {
"selected": false,
"text": "All",
"value": "$__all"
},
"datasource": {
"type": "prometheus",
"uid": "ykIxRIhNk"
},
"definition": "query_result(sum(envoy_http_local_rate_limiter_http_local_rate_limit_enabled) by (namespace))",
"hide": 0,
"includeAll": true,
"label": "namespace",
"multi": false,
"name": "namespace",
"options": [],
"query": {
"query": "query_result(sum(envoy_http_local_rate_limiter_http_local_rate_limit_enabled) by (namespace))",
"refId": "PrometheusVariableQueryEditor-VariableQuery"
},
"refresh": 1,
"regex": "/.*namespace=\"(.*)\".*/",
"skipUrlSync": false,
"sort": 0,
"type": "query"
},
{
"allValue": ".*",
"current": {
"selected": false,
"text": "All",
"value": "$__all"
},
"datasource": {
"type": "prometheus",
"uid": "ykIxRIhNk"
},
"definition": "query_result(sum(envoy_http_local_rate_limiter_http_local_rate_limit_enabled) by (pod_name))",
"description": "",
"hide": 0,
"includeAll": true,
"label": "pod",
"multi": false,
"name": "pod",
"options": [],
"query": {
"query": "query_result(sum(envoy_http_local_rate_limiter_http_local_rate_limit_enabled) by (pod_name))",
"refId": "PrometheusVariableQueryEditor-VariableQuery"
},
"refresh": 1,
"regex": "/.*pod_name=\"(.*)\".*/",
"skipUrlSync": false,
"sort": 0,
"type": "query"
},
{
"allValue": ".*",
"current": {
"selected": false,
"text": "All",
"value": "$__all"
},
"datasource": {
"type": "prometheus",
"uid": "ykIxRIhNk"
},
"definition": "query_result(sum(envoy_http_local_rate_limiter_http_local_rate_limit_enabled) by (service_istio_io_canonical_name))",
"hide": 0,
"includeAll": true,
"label": "service",
"multi": false,
"name": "service",
"options": [],
"query": {
"query": "query_result(sum(envoy_http_local_rate_limiter_http_local_rate_limit_enabled) by (service_istio_io_canonical_name))",
"refId": "PrometheusVariableQueryEditor-VariableQuery"
},
"refresh": 1,
"regex": "/.*service_istio_io_canonical_name=\"(.*)\".*/",
"skipUrlSync": false,
"sort": 0,
"type": "query"
}
]
},
"time": {
"from": "now-5m",
"to": "now"
},
"timepicker": {},
"timezone": "browser",
"title": "Local Rate Limit",
"uid": "859fe8e7-c7dd-46f4-a1c0-c0c7010bcf19",
"version": 7,
"weekStart": ""
}Contoh aturan peringatan
|
Parameter |
Contoh |
Deskripsi |
|
Ekspresi PromQL |
sum (increase(envoy_http_local_rate_limiter_http_local_rate_limit_enforced[1m])) by (namespace, service_istio_io_canonical_name) > 10 |
Menanyakan jumlah permintaan yang dibatasi dalam satu menit terakhir, dikelompokkan berdasarkan namespace dan nama layanan. Peringatan aktif jika jumlah tersebut melebihi 10. |
|
Pesan peringatan |
Throttling dipicu! Namespace: {{$labels.namespace}}, Layanan target: {{$labels.service_istio_io_canonical_name}}. Jumlah permintaan yang dibatasi dalam satu menit terakhir: {{ $value }} |
Menentukan format pesan peringatan. Pesan ini menampilkan namespace, nama layanan, dan jumlah permintaan yang dibatasi dalam satu menit terakhir. |
Operasi terkait
Impor dasbor Grafana
-
Masuk ke Konsol ARMS.
-
Di panel navigasi sebelah kiri, klik Integration Management.
-
Pada tab Lingkungan Terintegrasi, pilih Container Service, cari lingkungan target berdasarkan nama kluster, lalu klik. Klik Direktori Dasbor.
Direktori Dasbor berada di bagian Informasi Dasar halaman detail Container Service. Klik nilainya untuk membuka direktori dasbor Grafana.
-
Di sisi kanan tab Dasbor, klik Import.
-
Tempel konten JSON ke dalam kotak Import via panel json lalu klik Load. Pertahankan pengaturan default dan klik Import.
CatatanAnda juga dapat mengimpor dasbor dengan mengunggah file JSON.