You can use CloudMonitor to configure monitoring and alerting for Web Application Firewall (WAF) service metrics and attacks that are launched against websites protected by WAF. This topic describes how to use CloudMonitor to configure monitoring and alerting for WAF.
Prerequisites
A website is added to WAF. For more information, see Tutorial.
Create an alert contact and an alert contact group
Log on to the CloudMonitor console.
In the left-side navigation pane, choose .
Create an alert contact.
On the Alert Contacts tab, click Create Alert Contact.
In the Set Alert Contact panel, enter the name, email address, and webhook URL of the alert contact. Make sure that the Language of Alert Notifications parameter is set to the default value Automatic.
NoteAutomatic specifies that CloudMonitor automatically selects the language of alert notifications based on the language that is used to create your Alibaba Cloud account.
Confirm the parameter values and click OK.
Create an alert contact group.
On the Alert Contact Group tab, click Create Alert Contact Group.
In the Create Alert Contact Group panel, configure the Group Name parameter, select alert contacts, and then click Confirm.
Add multiple alert contacts to an alert contact group
On the Alert Contacts tab, select the alert contacts that you want to add to an alert contact group and click Add to Contact Group.
In the Add to Contact Group dialog box, click the alert contact group to which you want to add the alert contacts and click Confirm.
After you create alert contacts and an alert contact group and add the alert contacts to the alert contact group, the alert contacts can receive monitoring and alerting notifications. Alert contacts must check the alert notifications and handle the alerts at the earliest opportunity.
Configure monitoring and alerting for attack events
Log on to the CloudMonitor console.
In the left-side navigation pane, choose .
On the Event Monitoring tab, click Old Event Alarm Rules in the upper-right corner and then click Create Alert Rule.
In the Create/Modify Event-triggered Alert Rule panel, configure the parameters and click OK. The following table describes the parameters.
Parameter
Description
Alert Rule Name
The name of the event-triggered alert rule.
Product Type
The cloud service for which you want to configure the event-triggered alert rule. Select Web Application Firewall (WAF).
Event Type
The event type of the event-triggered alert rule. Valid values: Attack, Exceed, and Event.
Event Level
The severity level of the event that triggers alerts. The security level of all events that are detected by WAF is CRITICAL.
Event Name
The name of the event that triggers alerts.
NoteIn the Event Name drop-down list, the events whose names contain v3 are WAF 3.0 events that can be monitored by CloudMonitor. The other events are WAF 2.0 events. For information about the attack events that are detected by WAF 2.0 and can be monitored by CloudMonitor, see Attack events that can be monitored by CloudMonitor.
Keyword Filtering
The keywords that are used in the alert rule. Valid values:
Contains any of the keywords: If the alert rule contains one of the specified keywords, no alert notifications are sent.
Does not contain any of the keywords: If the alert rule does not contain one of the specified keywords, no alert notifications are sent.
SQL Filter
The SQL statements that are used for filtering.
Resource Range
The range of resources for which you want the event-triggered rule to take effect. Valid values: All Resources and Application Groups.
Alert Contact Group
The contact groups to which alert notifications are sent. For more information, see Create an alert contact and alert contact group.
Notification Method
The severity level and notification method of the event-triggered alert. Valid values:
Critical (Phone Call + SMS Message + Email + Webhook)
Warning (SMS Message + Email + Webhook)
Info (Email +Webhook)
SMQ
The Simple Message Queue (SMQ, formerly MNS) queue to which the event-triggered alert is delivered.
Function Compute
The Function Compute function to which the event-triggered alert is delivered.
URL Callback
The URL that can be accessed over the Internet. CloudMonitor sends HTTP POST requests to push alert notifications to the specified URL. Only HTTP is supported. For information about how to configure alert callbacks, see Configure callbacks for system event-triggered alerts (old).
Simple Log Service
The Simple Log Service Logstore to which event-triggered alerts are delivered.
Mute Period
The interval at which CloudMonitor resends alert notifications before the alert is cleared. Valid values: 5 Minutes, 15 Minutes, 30 Minutes, 60 Minutes, 3 Hours, 6 Hours, 12 Hours, and 24 Hours.
After you configure an alert rule for attack events, the contacts that you specified in the alert rule can receive alert notifications when specific attacks are detected on the protected objects of WAF.
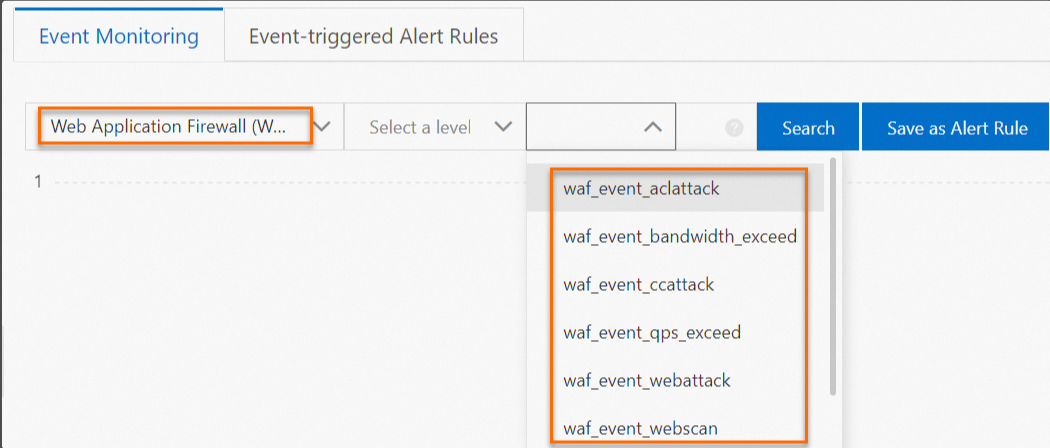
To query the recent attack events that are detected by WAF, select Web Application Firewall (WAF) from the All Products drop-down list on the Event Monitoring tab and select an event name that does not contain v3 from the Select Event Name drop-down list. Then, click Search.
Configure monitoring and alerting for service metrics
Log on to the CloudMonitor console.
In the left-side navigation pane, choose .
On the Alert Rules page, click Create Alert Rule.
In the Create Alert Rule panel, configure the parameters and click Confirm. The following table describes the parameters.
Parameter
Description
Product
Select Web Application Firewall (WAF) from the Product drop-down list.
Resource Range
The range of resources for which you want the alert rule to take effect. Valid values:
All Resources: The alert rule takes effect for all WAF resources.
Application Groups: The alert rule takes effect for all resources in the specified application group of WAF.
Instances: The alert rule takes effect for the specified resources of WAF.
Rule Description
The content of the alert rule. If a metric meets the specified condition, an alert is triggered. To specify a condition, perform the following steps:
Click Add Rule.
In the Config Rule Description panel, configure the Alert Rule, Metric Type, Metric, and Threshold and Alert Level parameters. Then, click OK.
NoteFor information about the service metrics that can be monitored by CloudMonitor, see Service Metrics that can be monitored by CloudMonitor.
Mute Period
The interval at which CloudMonitor resends alert notifications before the alert is cleared. Valid values: 5 Minutes, 15 Minutes, 30 Minutes, 60 Minutes, 3 Hours, 6 Hours, 12 Hours, and 24 Hours.
When the condition of an alert rule is met, an alert is triggered. If the alert is retriggered within the mute period, CloudMonitor does not resend an alert notification. If the alert is not cleared after the mute period ends, CloudMonitor resends alert notifications.
Effective Period
The period of time during which the alert rule is effective. CloudMonitor monitors the specified resources and generates alerts only within the specified period.
Alert Contact Group
The contact groups to which alert notifications are sent. For more information, see Create an alert contact and alert contact group.
Alert Callback
The URL that can be accessed over the Internet. CloudMonitor sends HTTP POST requests to push alert notifications to the specified URL. Only HTTP is supported. For information about how to configure an alert callback, see Use the alert callback feature to send notifications about threshold-triggered alerts.
NoteYou can click Advanced Settings to configure this parameter.
Auto Scaling
If you turn on Auto Scaling, the specified scaling rule is enabled when an alert is triggered based on the alert rule. You must configure the Region, ESS Group, and ESS Rule parameters.
For information about how to create a scaling group, see Manage scaling groups.
For information about how to create a scaling rule, see Configure scaling rules.
NoteYou can click Advanced Settings to configure this parameter.
Simple Log Service
If you turn on Simple Log Service and an alert is triggered, the alert information is written to the specified Logstore in Simple Log Service. You must configure the Region, ProjectName, and Logstore parameters. For information about how to create a project and a Logstore, see Getting started.
NoteYou can click Advanced Settings to configure this parameter.
Simple Message Queue (formerly MNS) - Topic
If you turn on Simple Message Queue (formerly MNS) - Topic and an alert is triggered, the alert information is written to the specified topic in MNS. You must configure the Region and topicName parameters. For information about how to create a topic, see Create a topic.
NoteYou can click Advanced Settings to configure this parameter.
Method to handle alerts when no monitoring data is found
The method that is used to handle alerts when no monitoring data is found. Valid values:
Do not do anything (default)
Send alert notifications
Treated as normal
NoteYou can click Advanced Settings to configure this parameter.
Tag
The tag of the alert rule. A tag consists of a name and a value.
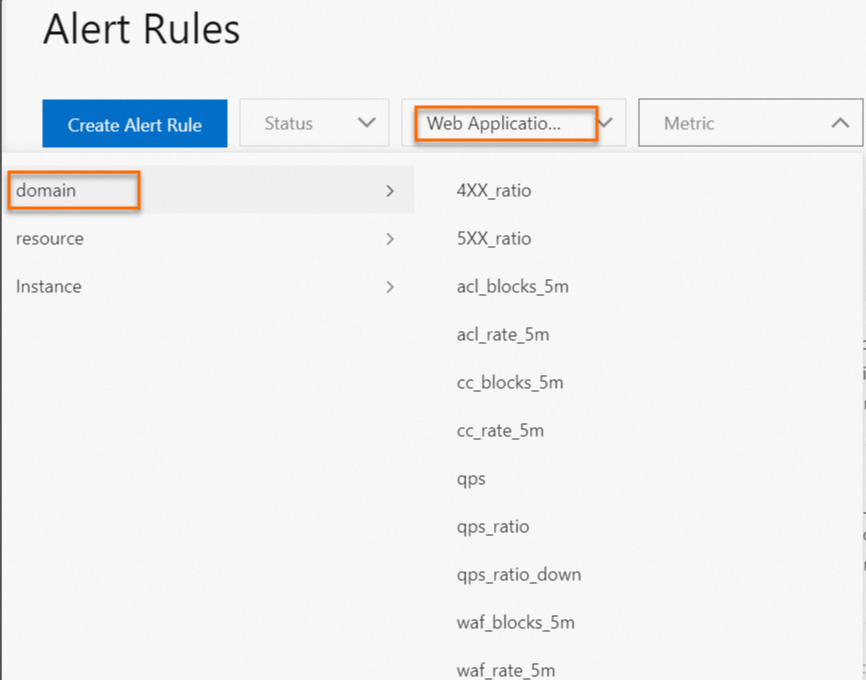
After you create an alert rule, you can view the rule on the Alert Rules page. Select Web Application Firewall (WAF) from the Product drop-down list and domain from the Metric drop-down list. Then, select one of the metrics that are displayed on the right side to search for the alert rule that you created for the metric.
 Note
NoteDescriptions of metrics that can be monitored by CloudMonitor:
If you select domain from the Metric drop-down list, the metrics that are displayed on the right side are WAF 2.0 metrics that can be monitored by CloudMonitor.
If you select resource from the Metric drop-down list, the metrics that are displayed on the right side are WAF 3.0 metrics that can be monitored by CloudMonitor.
If you select Instance from the Metric drop-down list, the metrics that are displayed on the right side are Hybrid Cloud WAF metrics that can be monitored by CloudMonitor. Metrics whose names contain v3 are WAF 3.0 metrics that can be monitored by CloudMonitor. The other metrics are WAF 2.0 metrics.
Configure monitoring and alerting for custom metrics
You can use Simple Log Service to configure monitoring and alerting for custom metrics. For more information, see Overview.
Attack events that can be monitored by CloudMonitor
CloudMonitor allows you to configure monitoring and alerting for web attacks, HTTP flood attacks, scan attacks, and access control events on domain names that are added to WAF. You can select a notification method for receiving alerts based on the severity levels of events. The supported notification methods include text messages, emails, DingTalk, and the alert callback feature. For more information, see Configure monitoring and alerting rules for attack events.
Event type | Event name | Description | Event status | Severity level |
Attack | waf_event_aclattack | An access control event occurs. | acl | Critical |
Exceed | waf_event_bandwidth_exceed | The bandwidth exceeds the upper limit. | overrun | Critical |
Attack | waf_event_ccattack | An HTTP flood attack occurs. | cc | Critical |
Exceed | waf_event_qps_exceed | The number of queries per second (QPS) exceeds the upper limit. | overrun | Critical |
Attack | waf_event_webattack | A web attack occurs. | web | Critical |
Attack | waf_event_webscan | A scan attack occurs. | webscan | Critical |
Service metrics that can be monitored by CloudMonitor
CloudMonitor allows you to configure monitoring and alerting for WAF service metrics of domain names that are added to WAF. You can specify the method that you want to use to identify exceptions on the metrics and select a notification method, such as text messages, emails, DingTalk, or the alert callback feature. For more information about how to configure monitoring and alerting for WAF service metrics, see Configure monitoring and alerting for service metrics.
Metric | Dimension | Description | Remarks |
4XX_ratio | Domain name | The proportion of the HTTP 4xx status codes that are returned per minute. The value does not include the proportion of HTTP 405 status codes that are returned. | The value is displayed as a decimal number. |
5XX_ratio | Domain name | The proportion of the HTTP 5xx status codes that are returned per minute. | The value is displayed as a decimal number. |
acl_blocks_5m | Domain name | The number of requests that are blocked by access control policies in the previous 5 minutes. | None |
acl_rate_5m | Domain name | The proportion of requests that are blocked by access control policies in the previous 5 minutes. | The value is displayed as a decimal number. |
cc_blocks_5m | Domain name | The number of requests that are blocked by HTTP flood protection in the previous 5 minutes. | None |
cc_rate_5m | Domain name | The proportion of requests that are blocked by HTTP flood protection in the previous 5 minutes. | The value is displayed as a decimal number. |
waf_blocks_5m | Domain name | The number of requests that are blocked by web application attack prevention in the previous 5 minutes. | None |
waf_rate_5m | Domain name | The proportion of requests that are blocked by web application attack prevention in the previous 5 minutes. | The value is displayed as a decimal number. |
QPS | Domain name | The number of queries per second. | None |
qps_ratio | Domain name | The minute-granularity growth rate of QPS. | The value is displayed as a percentage. |
qps_ratio_down | Domain name | The minute-granularity decrease rate of QPS. | The value is displayed as a percentage. |