After you use Jaeger to instrument a Java application and report the trace data to Managed Service for OpenTelemetry, Managed Service for OpenTelemetry starts to monitor the Java application. You can view the monitoring data of the application such as application topology, traces, abnormal transactions, slow transactions, and SQL analysis. This topic describes how to manually instrument a Java application and use Spring Cloud or gRPC to automatically instrument a Java application.
We recommend that you connect your application to Managed Service for OpenTelemetry by using OpenTelemetry Protocol (OTLP). In this case, you are provided with more features, more advanced tracing capabilities, and the best user experience.
Alibaba Cloud provides detailed instructions on how to integrate OpenTelemetry with an application and the best practices of using OpenTelemetry to help you quickly get started with Managed Service for OpenTelemetry. For more information, see Preparations.
Prerequisites
New console
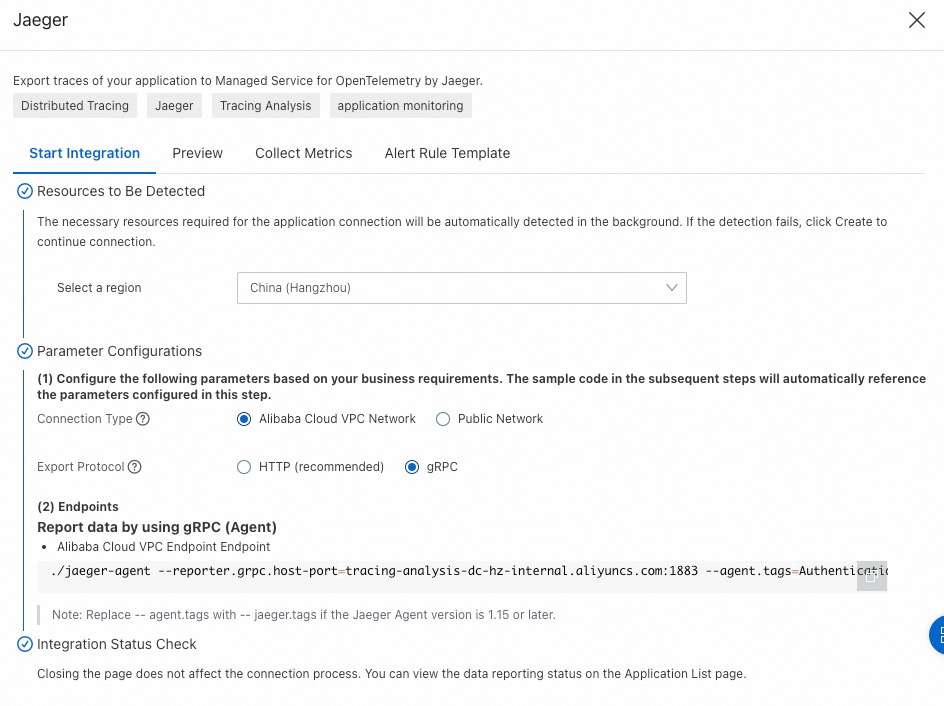
Log on to the Managed Service for OpenTelemetry console. In the left-side navigation pane, click Integration Center.
On the Integration Center page, click the Jaeger card in the Open Source Frameworks section.
In the Jaeger panel, click the Start Integration tab, and then select a region in which you want to report data.
NoteResources are automatically initialized in the region that you access for the first time.
Configure the Connection Type and Export Protocol parameters and copy an endpoint.
Connection Type: If your service is deployed on Alibaba Cloud and resides in the region that you selected, we recommend that you set this parameter to Alibaba Cloud VPC Network. Otherwise, set this parameter to Public Network.
Export Protocol: Set this parameter to gRPC based on the protocol that is supported by the client.
Old console
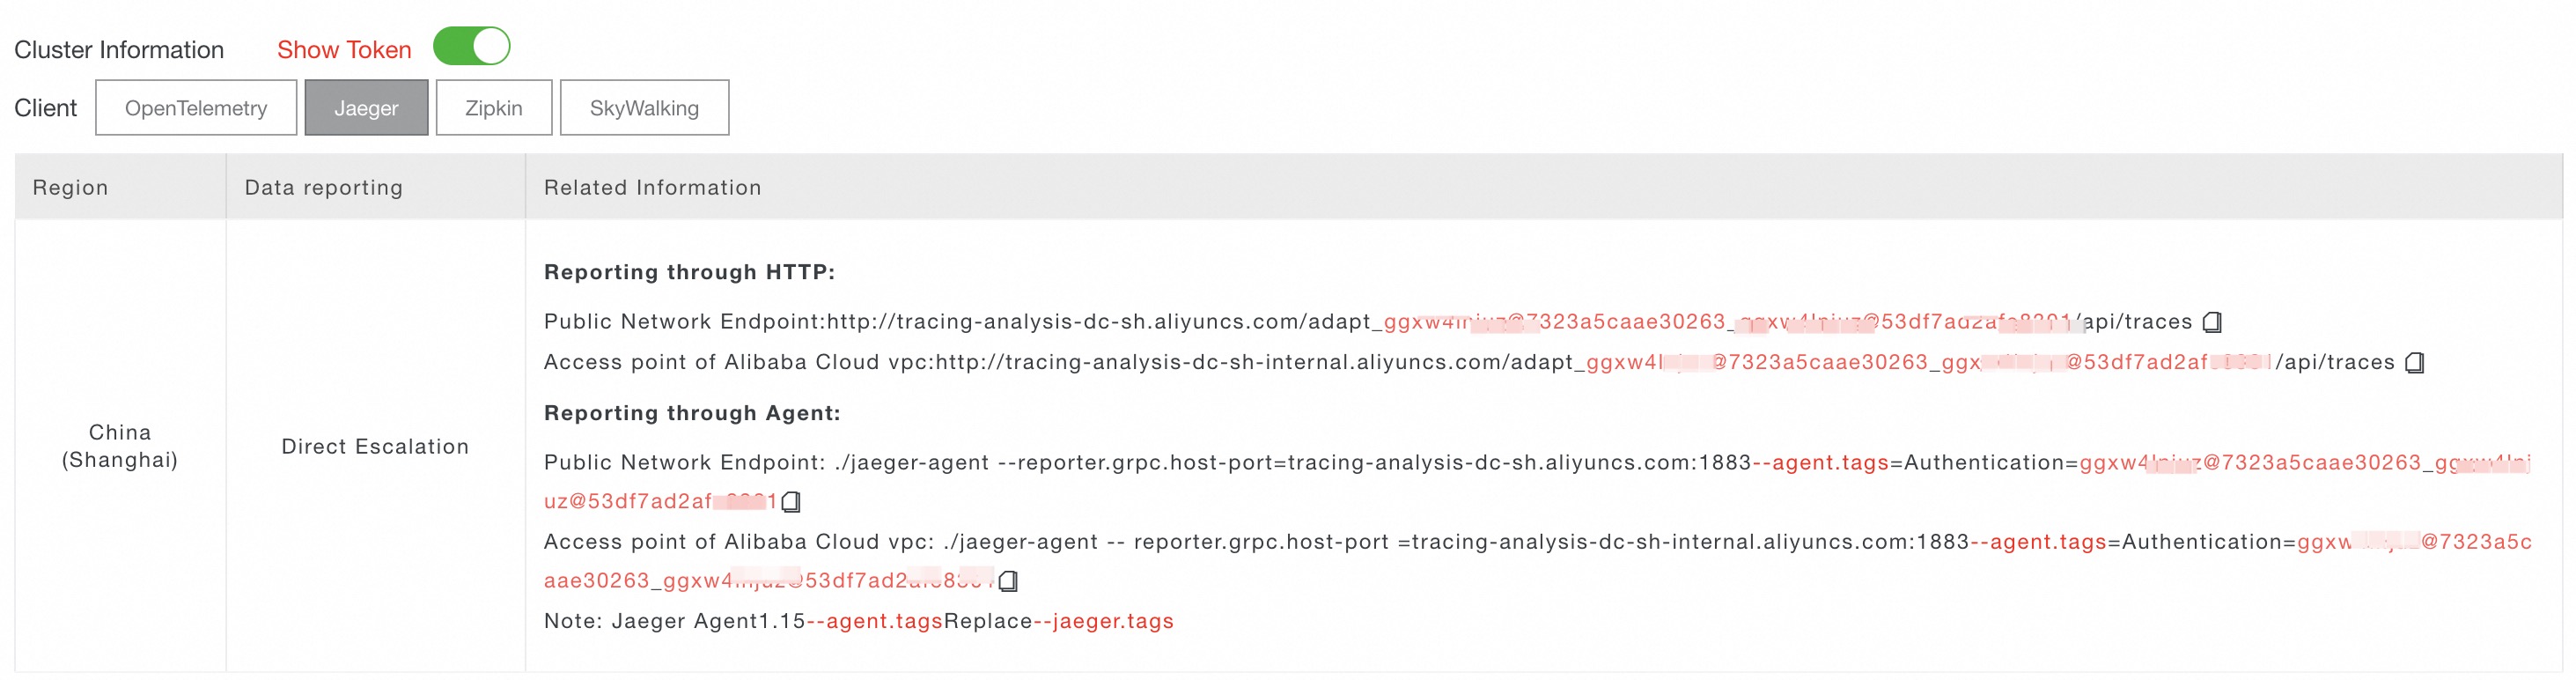
Log on to the Managed Service for OpenTelemetry console.
In the left-side navigation pane, click Cluster Configurations. On the page that appears, click the Access point information tab.
In the top navigation bar, select a region in which you want to report data. In the Cluster Information section, turn on Show Token.
Set the Client parameter to Jaeger.
In the Related Information column of the table, copy an endpoint.
 Note
NoteIf your application is deployed in an Alibaba Cloud production environment, use a VPC endpoint. Otherwise, use a public endpoint.
Background information
Jaeger is an open source distributed tracing system. It is compatible with the OpenTracing API and has joined the Cloud Native Computing Foundation (CNCF). Jaeger gathers real-time monitoring data from various heterogeneous systems. The OpenTracing community provides many components that support the following Java frameworks:
To use Jaeger to report Java application data to the Managed Service for OpenTelemetry console, you must first instrument your application. You can instrument the application manually or by using existing components. This topic describes three methods that you can use to instrument an application:
Manually instrument a Java application.
Use Spring Cloud to instrument a Java application.
Use gRPC to instrument a Java application.
The following figure shows how to report data without using the Jaeger agent.

The following figure shows how to report data by using the Jaeger agent.

Instrument a Java application
Before you can use Jaeger to submit the data of a Java application to Managed Service for OpenTelemetry, you must instrument the application. In this example, the application is manually instrumented.
Download the demo project. Go to the manualDemo directory and run the program as instructed in the README.md file.
Add the following dependency for Jaeger clients to the pom.xml file:
<dependency>
    <groupId>io.jaegertracing</groupId>
    <artifactId>jaeger-client</artifactId>
    <version>0.31.0</version>
</dependency>
Configure initialization parameters and create a tracer.
A tracer can be used to create spans to record distributed operation time, transmit data across servers in pass-through mode by using the Extract or Inject method, or specify the current span. The tracer also contains data such as the endpoint used for data reporting, local IP address, sampling rate, and service name. You can adjust the sampling rate to reduce the overheads caused by data reporting.
NoteReplace
<endpoint>with the endpoint that you obtained in the "Prerequisites" section of this topic.// Replace manualDemo with your application name. io.jaegertracing.Configuration config = new io.jaegertracing.Configuration("manualDemo"); io.jaegertracing.Configuration.SenderConfiguration sender = new io.jaegertracing.Configuration.SenderConfiguration(); // Replace <endpoint> with the endpoint that you obtained in the "Prerequisites" section of this topic. sender.withEndpoint("<endpoint>"); config.withSampler(new io.jaegertracing.Configuration.SamplerConfiguration().withType("const").withParam(1)); config.withReporter(new io.jaegertracing.Configuration.ReporterConfiguration().withSender(sender).withMaxQueueSize(10000)); // Set resource tags, such as the application version and deployment environment. Map<String, String> map = new HashMap<>(); map.put("service.version", "1.0.0"); map.put("deployment.environment", "test"); config.withTracerTags(map); GlobalTracer.register(config.getTracer());Record the request data.
Tracer tracer = GlobalTracer.get();
// Create a span.
Span span = tracer.buildSpan("parentSpan").withTag("myTag", "spanFirst").start();
tracer.scopeManager().activate(span, false);
tracer.activeSpan().setTag("methodName", "testTracing");
// The business logic.
secondBiz();
span.finish();
Optional. You can run the preceding code to create a root span to record the root operation of a request. If you want to record the previous and subsequent operations of a request, specify the context information.
Tracer tracer = GlobalTracer.get();
Span parentspan = tracer.activeSpan();
Tracer.SpanBuilder spanBuilder = tracer.buildSpan("childSpan").withTag("myTag", "spanSecond");
if (parentspan !=null) {
    spanBuilder.asChildOf(parentspan).start();
}
Span childSpan = spanBuilder.start();
Scope scope = tracer.scopeManager().activate(childSpan); // The statement is executed once when the request starts.
// The business logic.  The buildSpan function can be executed multiple times.
childSpan.finish();
tracer.activeSpan().setTag("methodName", "testCall");

// The statement is executed once when the request ends.
scope.close();
Optional. To efficiently troubleshoot issues, you can add custom tags to a span. For example, you can add a custom tag to check whether an error occurs or to record the returned value of a request.
tracer.activeSpan().setTag("methodName", "testCall");In a distributed system, remote procedure call (RPC) requests are sent together with trace data. Trace data contains the values of the TraceId, ParentSpanId, SpanId, and Sampled parameters. You can call the Extract or Inject method to pass through trace data in HTTP request headers. The following figure shows the entire process.
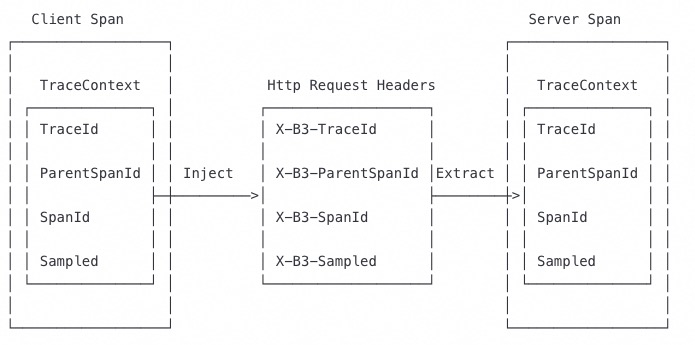
Call the Inject method on the client to specify the context information.
private void attachTraceInfo(Tracer tracer, Span span, final Request request) {
        tracer.inject(span.context(), Format.Builtin.TEXT_MAP, new TextMap() {
            @Override
            public void put(String key, String value) {
                request.setHeader(key, value);
            }
            @Override
            public Iterator<Map.Entry<String, String>> iterator() {
                throw new UnsupportedOperationException("TextMapInjectAdapter should only be used with Tracer.inject()");
            }
        });
    }
Call the Extract method on the server to extract the context information.
protected Span extractTraceInfo(Request request, Tracer tracer) {
    Tracer.SpanBuilder spanBuilder = tracer.buildSpan("/api/xtrace/test03");
    try {
        SpanContext spanContext = tracer.extract(Format.Builtin.TEXT_MAP, new TextMapExtractAdapter(request.getAttachments()));
        if (spanContext !=null) {
            spanBuilder.asChildOf(spanContext);
        }
    } catch (Exception e) {
        spanBuilder.withTag("Error", "extract from request fail, error msg:" + e.getMessage());
    }
    return spanBuilder.start();
}
Use Spring Cloud to instrument a Java application
To use Jaeger to report Java application data to the Managed Service for OpenTelemetry console, you must first instrument your application. This example shows you how to use Spring Cloud to instrument an application. You can use Spring Cloud to instrument the following applications:
@Async, @Scheduled, Executors
Feign, HystrixFeign
Hystrix
JDBC
JMS
Mongo
RabbitMQ
Redis
RxJava
Spring Messaging: Trace messages are sent by using message channels.
Spring Web (RestControllers, RestTemplates, WebAsyncTask)
Standard Logging: Logs are added to the current span.
WebSocket STOMP
Zuul
Perform the following steps to use Spring Cloud to instrument an application:
Download the demo project. Go to the springMvcDemo/webmvc4-boot directory and run the program as instructed in the README.md file.
Open the pom.xml file and add JAR dependencies.
<dependency>
   <groupId>io.opentracing.contrib</groupId>
  <artifactId>opentracing-spring-cloud-starter</artifactId>
  <version>0.5.8</version>
</dependency>
<dependency>
  <groupId>io.jaegertracing</groupId>
  <artifactId>jaeger-client</artifactId>
  <version>1.4.0</version>
</dependency>
Add an OpenTracing Tracer bean.
NoteReplace
<endpoint>with the endpoint that you obtained in the "Prerequisites" section of this topic.@Bean public io.opentracing.Tracer tracer() { io.jaegertracing.Configuration config = new io.jaegertracing.Configuration("springFrontend"); io.jaegertracing.Configuration.SenderConfiguration sender = new io.jaegertracing.Configuration.SenderConfiguration(); sender.withEndpoint("<endpoint>"); config.withSampler(new io.jaegertracing.Configuration.SamplerConfiguration().withType("const").withParam(1)); config.withReporter(new io.jaegertracing.Configuration.ReporterConfiguration().withSender(sender).withMaxQueueSize(10000)); return config.getTracer(); }
Use gRPC to instrument a Java application
To use Jaeger to report Java application data to the Managed Service for OpenTelemetry console, you must first instrument your application. This example shows you how to use gRPC to instrument an application.
Use gRPC to instrument an application by performing the following steps:
Download the demo project. Go to the grpcDemo directory and run the program as instructed in the README.md file.
Open the pom.xml file and add JAR dependencies.
<dependency>
    <groupId>io.opentracing.contrib</groupId>
    <artifactId>opentracing-grpc</artifactId>
    <version>0.2.3</version>
</dependency>
Initialize the Tracer object on the server, create the ServerTracingInterceptor class, and then add an interceptor to the server.
import io.opentracing.Tracer;

    public class YourServer {

        private int port;
        private Server server;
        private final Tracer tracer;

        private void start() throws IOException {
            ServerTracingInterceptor tracingInterceptor = new ServerTracingInterceptor(this.tracer);

            // If GlobalTracer is used:
            // ServerTracingInterceptor tracingInterceptor = new ServerTracingInterceptor();

            server = ServerBuilder.forPort(port)
                .addService(tracingInterceptor.intercept(someServiceDef))
                .build()
                .start();
        }
    }
Initialize the Tracer object on the client, create the ClientTracingInterceptor class, and then add an interceptor to the client.
import io.opentracing.Tracer;

    public class YourClient {

        private final ManagedChannel channel;
        private final GreeterGrpc.GreeterBlockingStub blockingStub;
        private final Tracer tracer;

        public YourClient(String host, int port) {

            channel = ManagedChannelBuilder.forAddress(host, port)
                .usePlaintext(true)
                .build();

            ClientTracingInterceptor tracingInterceptor = new ClientTracingInterceptor(this.tracer);

            // If GlobalTracer is used:
            // ClientTracingInterceptor tracingInterceptor = new ClientTracingInterceptor();

            blockingStub = GreeterGrpc.newBlockingStub(tracingInterceptor.intercept(channel));
        }
    }
FAQ
Q: What do I do if no data is reported to the console after I run the demo program?
A: Debug the io.jaegertracing.thrift.internal.senders.HttpSender.send(Process process, List<Span> spans) method and check the return value of data reporting. If an HTTP 403 error is returned, you have specified an invalid endpoint. Change the endpoint to a valid one.