You can use the Tablestore console to view the monitoring data of an instance, a data table, a secondary index, or a search index. For example, you can view the queries per second (QPS), number of rows, traffic statistics, and capacity units (CUs) of an instance. You can also view the average access latency and QPS of a data table, secondary index, or search index. In addition, you can view the metering data of a search index, such as the storage volume, number of reserved read CUs, and number of rows.
Prerequisites
If you view the monitoring data of Tablestore as a RAM user, make sure that the following prerequisites are met:
The
AliyunOTSFullAccessorAliyunOTSReadOnlyAccesspolicy is attached to the RAM user. The AliyunOTSFullAccess policy grants full access to Tablestore to the RAM user. The AliyunOTSReadOnlyAccess policy grants read-only access to Tablestore to the RAM user. For more information, see Grant permissions to a RAM user.The
AliyunCloudMonitorFullAccessorAliyunCloudMonitorReadOnlyAccesspolicy is attached to the RAM user. The AliyunCloudMonitorFullAccess policy grants full access to CloudMonitor to the RAM user. The AliyunCloudMonitorReadOnlyAccess policy grants read-only access to CloudMonitor to the RAM user. For more information, see Grant permissions to a RAM user.
You can also create custom policies to manage permissions in a fine-grained manner. For more information, see Create custom policies.
Usage notes
The Tablestore metrics available vary based on the resource types. For more information, see Metrics.
The collection of monitoring data statistics may be delayed.
View instance monitoring data
View service monitoring data
You can view the monitoring data of instances, such as QPS, the number of rows, traffic statistics, and CUs in the Tablestore console.
Go to the Instance Management page.
Log on to the Tablestore console.
In the top navigation bar, select a region and a resource group.
On the Overview page, click the name of the instance that you want to manage or click Manage Instance in the Actions column of the instance.
On the Instance Management page, click the Instance Monitoring tab and specify a time range.
You can select a preset time range or specify a custom time range. The time range cannot exceed 30 days.
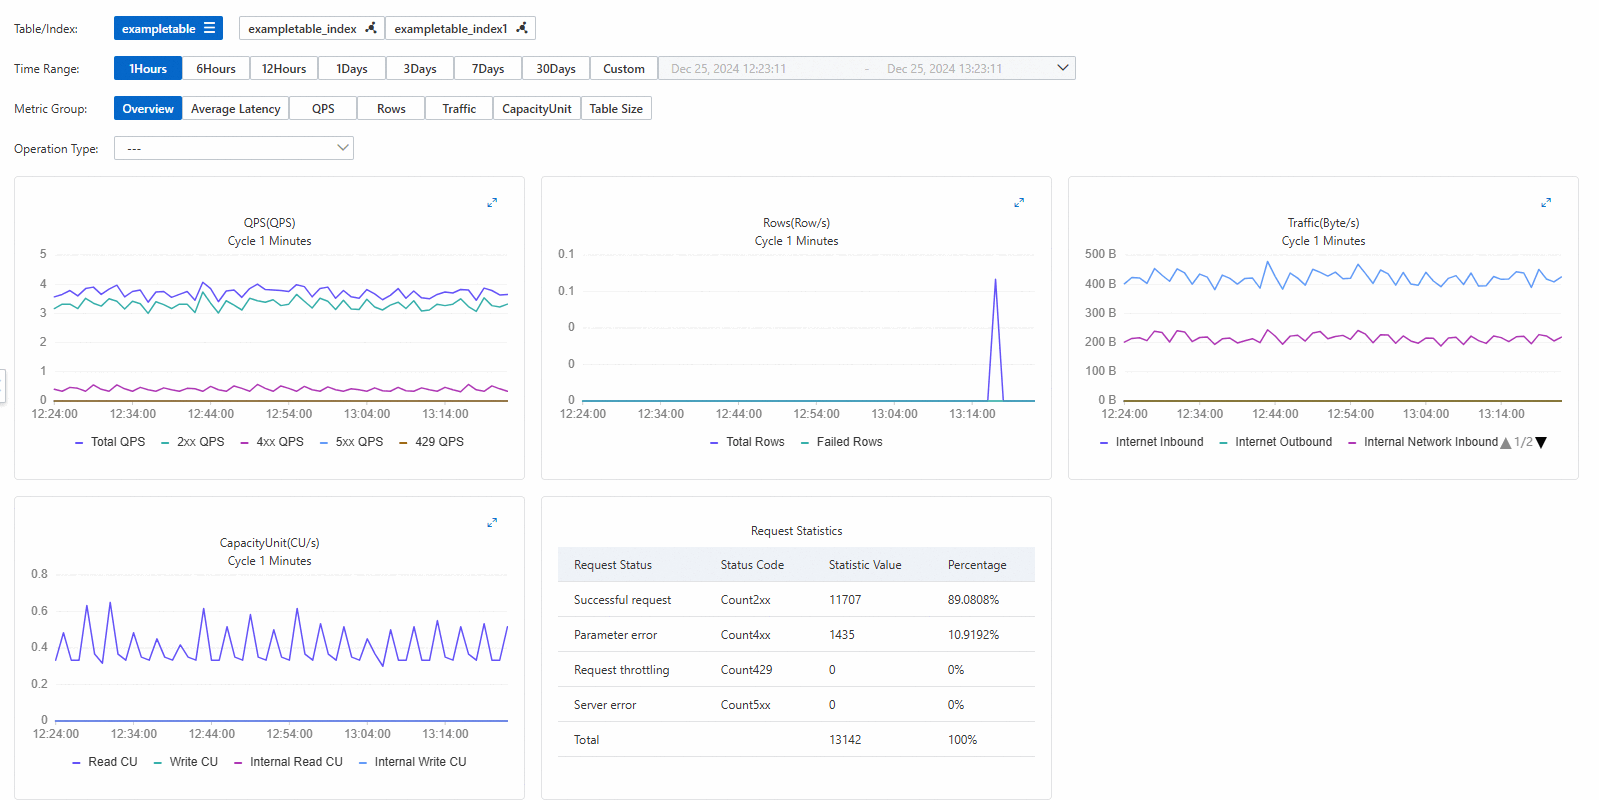
Specify the monitoring data that you want to view.
By default, Overview is selected for Metric Group. You can specify a value for Operation Type to view the monitoring data of all metric groups regarding the specified operation type.
Click the
 icon in the upper-right corner of the chart to view the monitoring data in the enlarged chart.
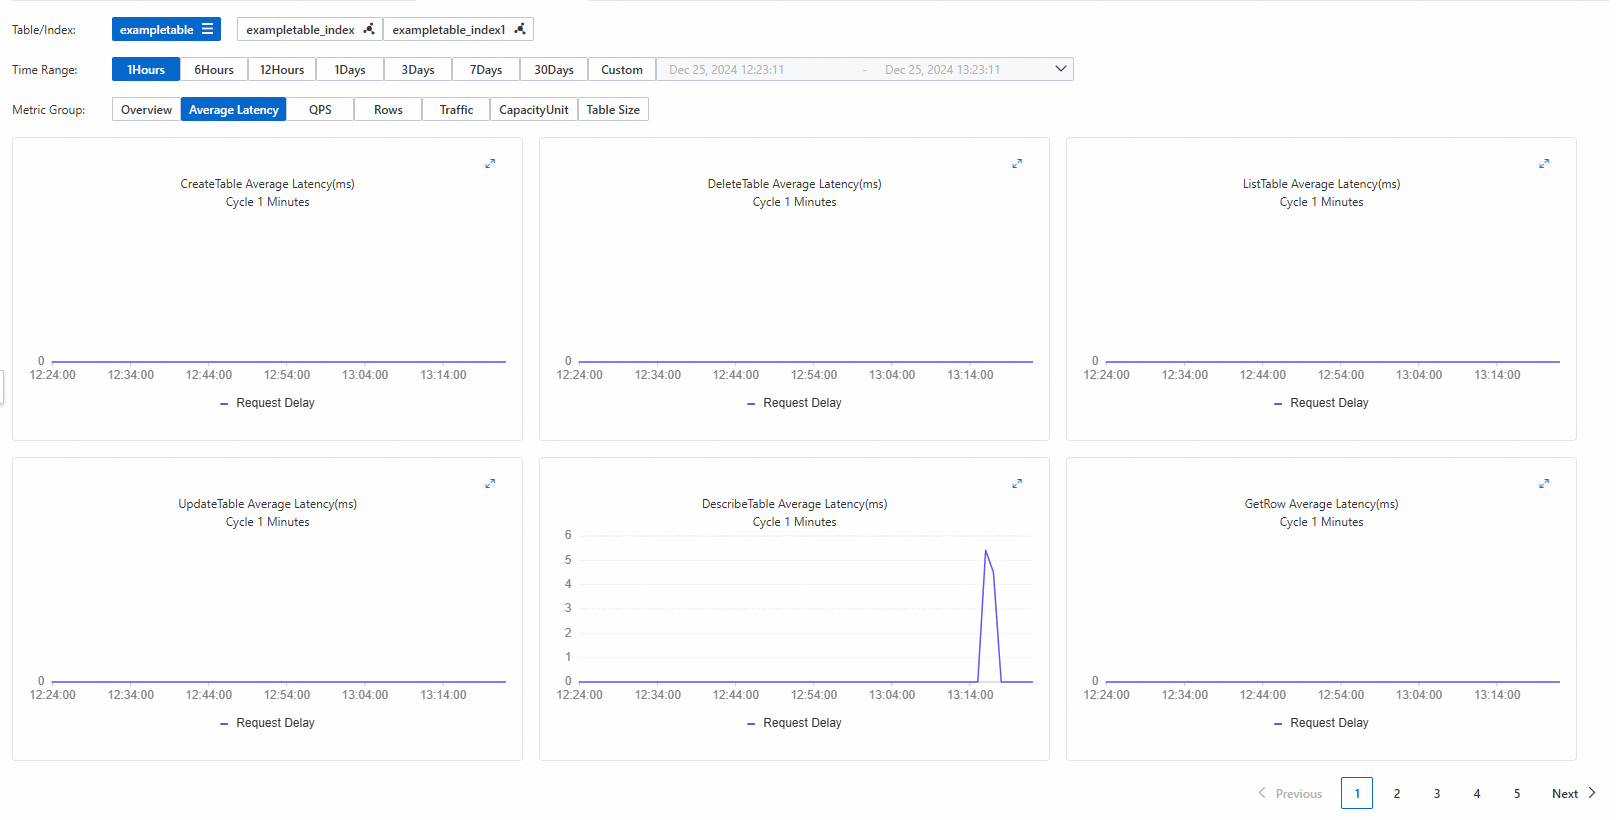
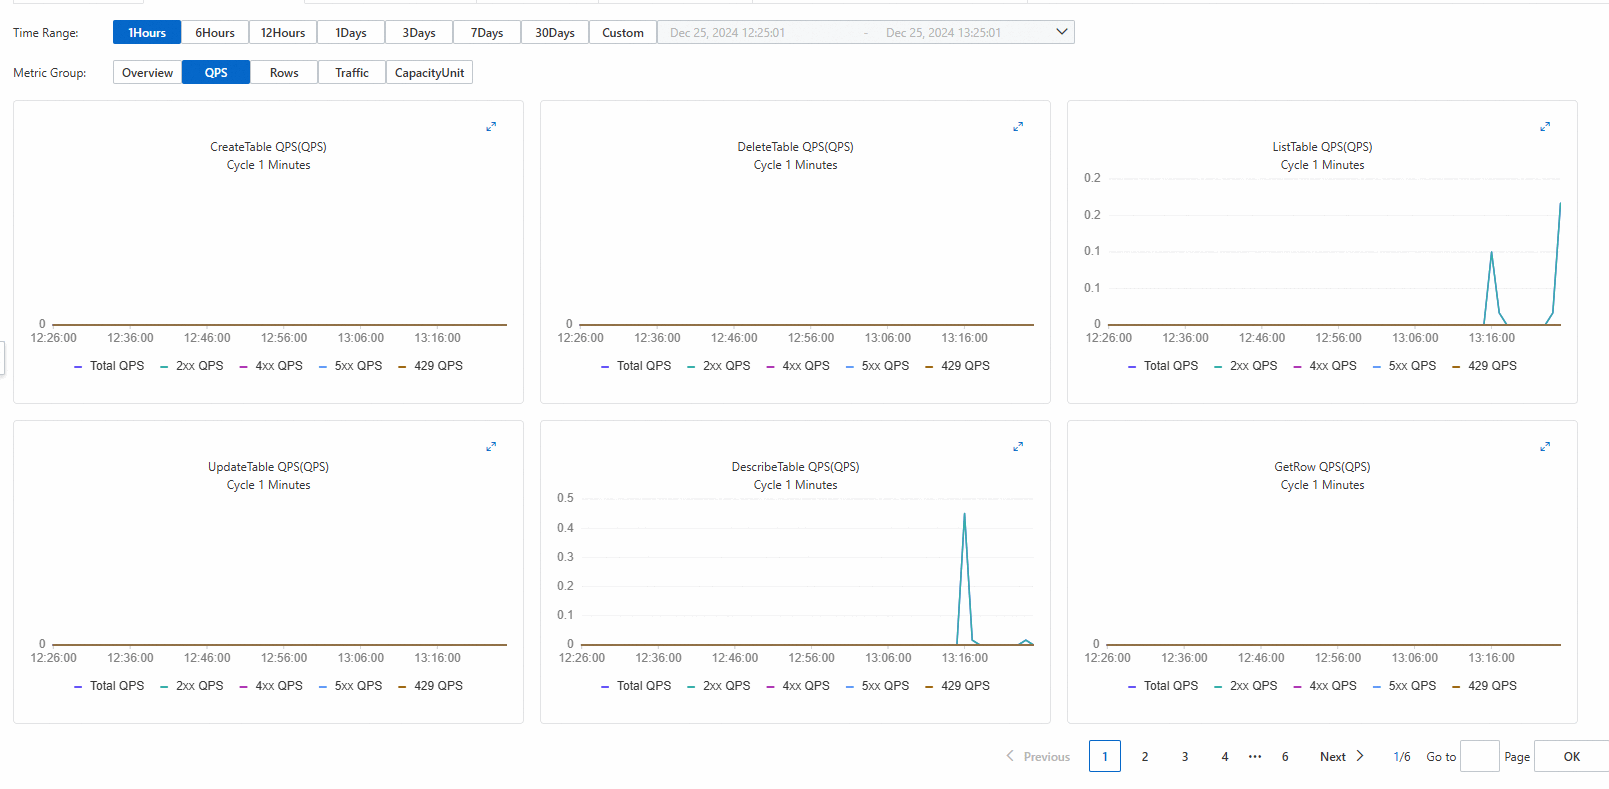
If you want to view the monitoring data of all operation types based on a specific metric group, set Metric Group to the required metric group. For example, you can set Metric Group to QPS. The following figure shows the monitoring data of all operation types based on QPS.
View the monitoring data of resources when the Wide Column model is used
View monitoring data of data tables or indexes
You can view monitoring data such as the average access latency, QPS, number of rows, and traffic statistics of data tables, secondary indexes, or search indexes in the Tablestore console.
The operation types vary based on the types of the resources whose monitoring data you want to view.
Go to the Instance Management page.
Log on to the Tablestore console.
In the top navigation bar, select a region and a resource group.
On the Overview page, click the name of the instance that you want to manage or click Manage Instance in the Actions column of the instance.
In the Tables section of the Instance Details tab, click the
 icon in the Monitoring column of the data table that you want to manage.
 On the Monitoring Indicators tab, select a data table, secondary index, or search index.
Specify a time range.
You can select a preset time range or specify a custom time range. The time range cannot exceed 30 days.
Specify the monitoring data that you want to view.
By default, Overview is selected for Metric Group. You can specify a value for Operation Type to view the monitoring data of all metric groups regarding the specified operation type.
Click the
icon in the upper-right corner of the chart to view the monitoring data in the enlarged chart. NoteSearch indexes do not support the Table Size metric group.
If you want to view the monitoring data of all operation types based on a specific metric group, set Metric Group to the required metric group. For example, you can set Metric Group to Average Latency. The following figure shows the monitoring data of all operation types based on the average access latency.

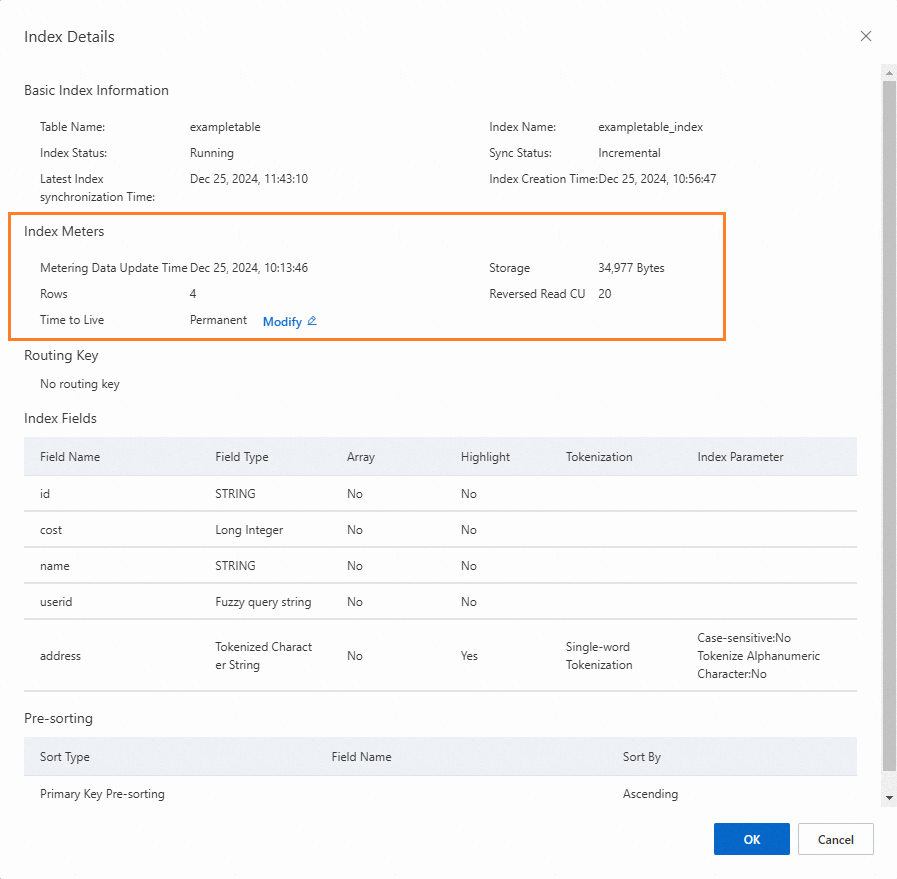
View metering data of search indexes
You can view metering data such as the storage volume, reserved read CUs, and number of rows of search indexes in the Tablestore console.
Go to the Instance Management page.
Log on to the Tablestore console.
In the top navigation bar, select a region and a resource group.
On the Overview page, click the name of the instance that you want to manage or click Manage Instance in the Actions column of the instance.
In the Tables section of the Instance Details tab, click Indexes in the Actions column of the data table that you want to manage.
On the Indexes tab, click Index Details in the Actions column of the search index that you want to manage.
In the Index Meters section of the Index Details dialog box, view the storage volume, number of rows, and reserved read CUs of the search index.
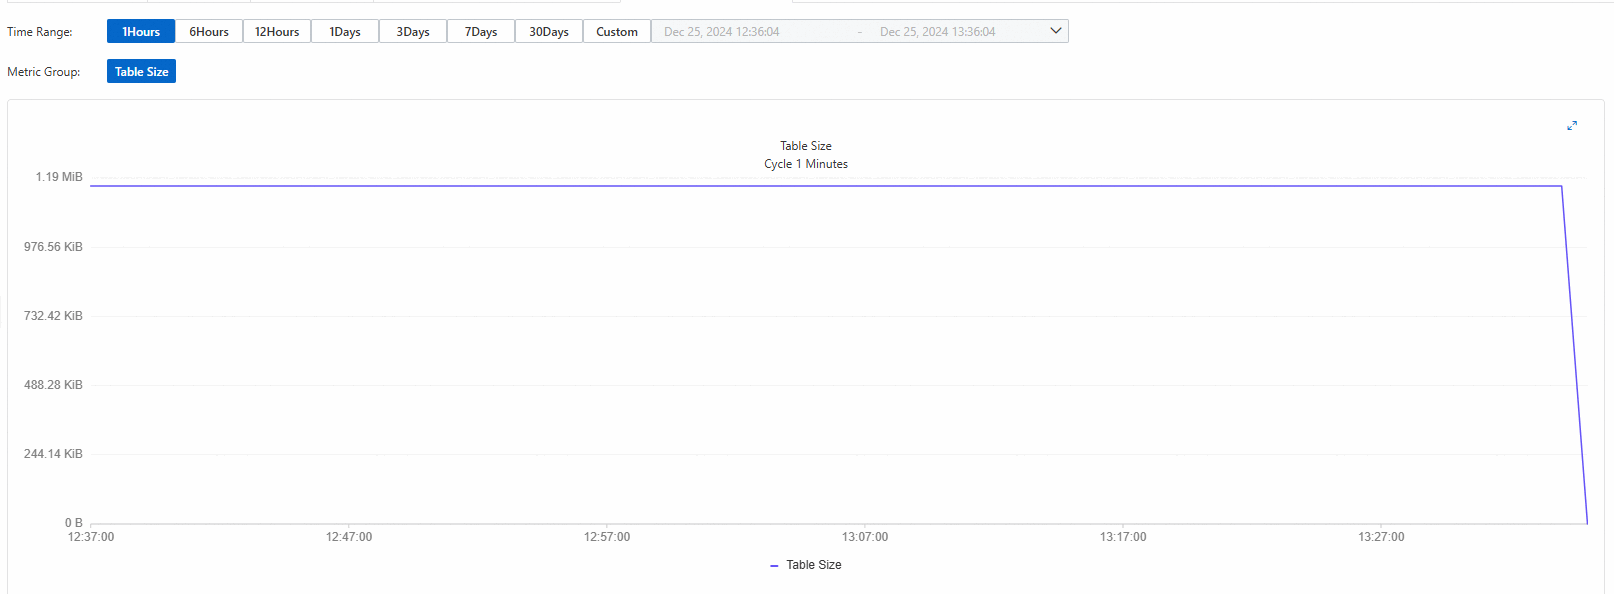
View the monitoring data of resources when the TimeSeries model is used
You can view the monitoring data only of time series tables when the TimeSeries model is used.
You can view the size of a time series table in the Tablestore console.
Go to the Instance Management page.
Log on to the Tablestore console.
In the top navigation bar, select a region and a resource group.
On the Overview page, click the name of the instance that you want to manage or click Manage Instance in the Actions column of the instance.
In the Time Series Tables section of the Instance Details tab, click the
icon in the Monitoring column of the time series table that you want to manage. On the Monitoring Indicators tab, specify a time range.
You can select a preset time range or specify a custom time range. The time range cannot exceed 30 days.
View monitoring data.
You can set Metric Group only to Table Size. Click the
icon in the upper-right corner of the chart to view the monitoring data in the enlarged chart.