In the cloud-native era, logs, traces, and metrics can be integrated. Full-stack Monitoring or Full-stack Observability uses the iLogtail collector provided by Simple Log Service to migrate complicated observable data based on one architecture.
Background information
Earlier versions of Logtail support Log and Metrics models. The Log model is deployed in the logtail-ds/kube-system DaemonSet, and the Metrics model is deployed in the logtail-node-monitoring-ds/sls-monitoring DaemonSet. The Metrics model contains resources such as StatefulSets.
Prerequisites
Before you collect the logs, metrics, and traces of a Kubernetes cluster, make sure that Logtail components are installed. You can install Logtail components based on the following topics:
Install Logtail components in an Container Service for Kubernetes (ACK) cluster
Logtail components of V1.7.3 and later are supported. For more information about how to view the version of Logtail, see View the version of Logtail. For more information about how to update Logtail, see Update Logtail.
Install Logtail components in a self-managed Kubernetes cluster
Logtail components of V2 and later are supported. For more information about how to view the version of Logtail, see View the version of Logtail. For more information about how to update Logtail, see Update Logtail.
New deployment architecture
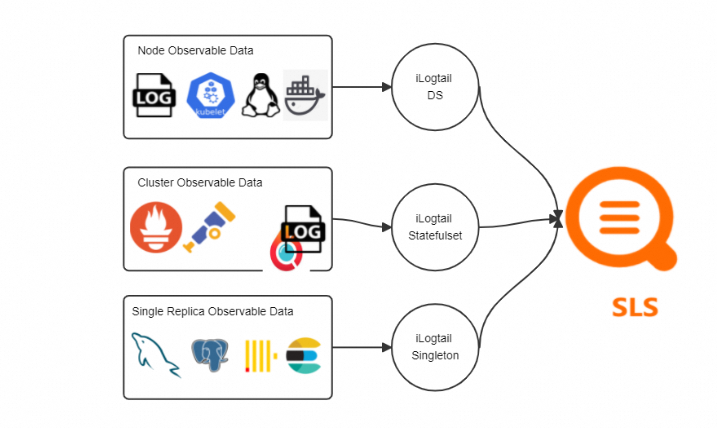
iLogtail can be deployed in a Kubernetes cluster in the following modes: Ds (DaemonSet), Sts (StatefulSet), and Singleton.
In Ds mode, iLogtail collects observable data of nodes. The data includes node logs, container logs, host metrics, process metrics, and Kubelet metrics.
In Sts mode, iLogtail collects observable data of clusters. In this mode, iLogtail further supports Pull and Push working models. iLogtail of the Pull working model can be used as a replacement of Prometheus to extract Prometheus Exporter data in a cluster. iLogtail of the Push working model can receive observable data, including Pyroscope-based profiling data and OpenTelemetry protocol data.
In Singleton mode, iLogtail collects global observable data. For example, iLogtail collects the metrics of different databases, such as MySQL, PostgreSQL, ClickHouse, and Elasticsearch.
Migrate the resources of Full-stack Monitoring of earlier versions
Log on to your cluster and download the CRD template tool.
China
curl https://logtail-release-cn-hangzhou.oss-cn-hangzhou.aliyuncs.com/kubernetes/crd-tool.tar.gz -o /tmp/crd-tool.tar.gzOutside China
curl https://logtail-release-ap-southeast-1.oss-ap-southeast-1.aliyuncs.com/kubernetes/crd-tool.tar.gz -o /tmp/crd-tool.tar.gz
Install the CRD template tool. After the tool is installed,
sls-crd-toolis generated in the folder in which the CRD template tool is installed.tar -xvf /tmp/crd-tool.tar.gz -C /tmp &&chmod 755 /tmp/crd-tool/install.sh && sh -x /tmp/crd-tool/install.shRun the
./sls-crd-migrate-tool --helpcommand to check whether the tool is installed. If a value is returned, the tool is installed.Check whether the cluster supports migration. The check information is saved as
sls-check-info.json../sls-crd-migrate-tool checkIf the cluster passes the check, run the following command to find the resources that you want to migrate. The migration information is saved as
sls-history-crd-infos.json../sls-crd-migrate-tool listMigrate resources.
./sls-crd-migrate-tool migrateCheck whether the resources are migrated.
Repeat Step 5 and Step 6. If the system prompts that no resources can be migrated, the migration is complete.
After the migration is complete, clear the resources of Full-stack Monitoring of earlier versions.
By default, historical CRDs exist in the
sls-monitoringnamespace. The preceding migration procedure does not move the CRDs. In this case, run the following commands to clear the resources.kubectl delete ds logtail-node-monitoring-ds -n sls-monitoring kubectl delete sts logtail-kubernetes-metrics -n sls-monitoring kubectl delete deploy kube-state-metrics -n sls-monitoring