A funnel chart is a data visualization tool that you can use to display the conversion rate or churn rate of data through sequential stages in a process. A funnel chart is shaped like a funnel, with the widest part at the top and narrowing down towards the bottom. This shape visually represents the reduction in the number of users, requests, or other entities at each stage in a process. This topic describes how to configure a funnel chart.
Overview
A funnel chart compares business data between different stages of a process. A funnel chart is suitable for one-way analysis of a single process that is standard, runs for a long period of time, and involves multiple stages. You can use a funnel chart to identify the stages in which issues occur and make informative decisions. A funnel chart includes trapezoid areas to compare business volume between a stage and its previous stage.
Configuration example
In the left-side navigation pane, click Log Storage. In the Logstores list, click the logstore you want.
In the left-side navigation pane, choose Dashboard > Dashboards. In the dashboard list, click the dashboard you want. In the upper-right corner of the dashboard page, click Edit. In edit mode, click Add > Add Chart.
On the right side of the Edit Chart page, select Funnel Chart Pro in the Chart Types section and configure the Title parameter in the Basic Configurations section. On the left side of the Edit Chart page, configure the query time range, Logstore, and query statement for the chart. After you complete the configuration, click Apply in the upper part of the Edit Chart page to view the configuration effects of the funnel chart.
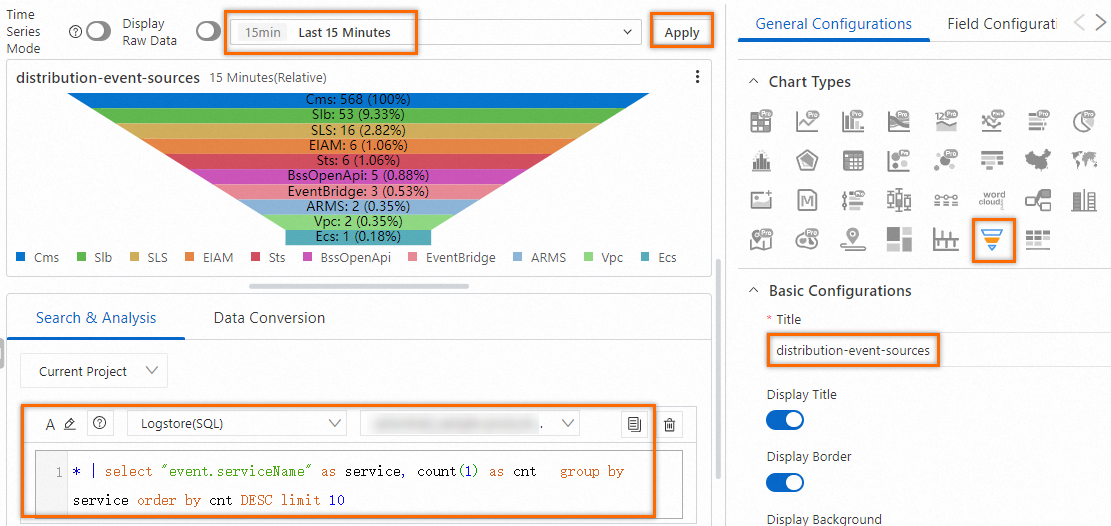
The following query statement is used to query the distribution of event sources by service:
* | select "event.serviceName" as service, count(1) as cnt group by service order by cnt DESC limit 10
Configuration on the General Configurations tab
You can configure global settings for a funnel chart on the General Configurations tab.
Basic Configurations
Parameter
Description
Title
The title of the chart.
Display Title
If you turn on Display Title, the title of the chart is displayed.
Display Border
If you turn on Display Border, the borders of the chart are displayed.
Display Background
If you turn on Display Background, the background color of the chart is displayed.
Display Time
If you turn on Display Time, the query time range of the chart is displayed.
Fixed Time
If you turn on Fixed Time, the query time range of the chart is independent of the global time range of the dashboard.
Standard Configurations
Parameter
Description
Format
The display format of numeric values.
Unit
The unit of numeric values.
Number of Digits after Decimal Point
The decimal places of numeric values.
Display Name
The name of the display field.
If you specify a value for Display Name, the value is used as the names for all display fields in the chart. If you want to change the name of a display field, you must configure parameters on the Field Configuration tab.
Color Scheme
The color scheme of the chart.
Built-in: uses the built-in color scheme.
Solid: uses the color that you select.
Threshold: uses different colors for different values based on the specified thresholds for the values.
Parameters in the Query and Analysis Configurations section
Parameter
Description
Category
The categorical field.
Value Column
The field that contains the required numeric values. The larger the value, the higher the layer.
Parameters in the Chart Configurations section
Parameter
Description
Curvature
If you turn on Curvature, the funnel chart is displayed in three dimensions.
Dynamic Width
If you turn on Dynamic Width, the width change of each layer in the funnel chart is displayed.
Dynamic Height
If you turn on Dynamic Height, you can manually configure the Minimum Row Height parameter.
Funnel Chart Necks
The number of layers in the narrowest part of the funnel chart.
Text Display Mode
The text display mode of each layer in the funnel chart.
Parameters in the Legend Configurations section
Parameter
Description
Display Legend
If you turn on Display Legend, the legend of the funnel chart is displayed.
Sorting Order
The order in which the legend items are sorted. Valid values: Ascending, Descending, and No Sorting.
Legend Position
The position of the legend in the funnel chart.
Actions
The data display effect when you click a legend item. Valid values:
Single: If you click a legend item, only the data for the legend item is displayed in the funnel chart.
Switch: If you click a legend item, the data for the legend item is hidden or displayed in the funnel chart.
Maximum Width (Height)%
The maximum width and height of the legend.
Parameters in the Threshold section
Parameter
Description
Threshold
The threshold of numeric values.
If you set the Color Scheme parameter to Threshold and specify thresholds in the Threshold section, the background of the funnel chart is displayed in different colors based on the specified thresholds.
Parameters in the Variable Replacement section
Parameter
Description
Variable Replacement
The settings for variable replacement. You can click AddVariable Replacement to add a filter of the Variable Replacement type to the funnel chart. After you configure the settings for variable replacement on the General Configurations tab, Simple Log Service adds a filter in the upper-left corner of the funnel chart. You can select a value from the filter drop-down list. After you select a value, Simple Log Service automatically replaces the variable in the query statement of the funnel chart with the variable value indicated by the value that you select, and performs a query and analysis operation. For more information, see Example 2: Configure variable replacement.
Parameters in the Documentation section
Parameter
Description
Add Documentation Link
The button that allows you to specify custom document links and descriptions. After you configure the settings, the specified information is displayed in the upper right corner of the funnel chart.
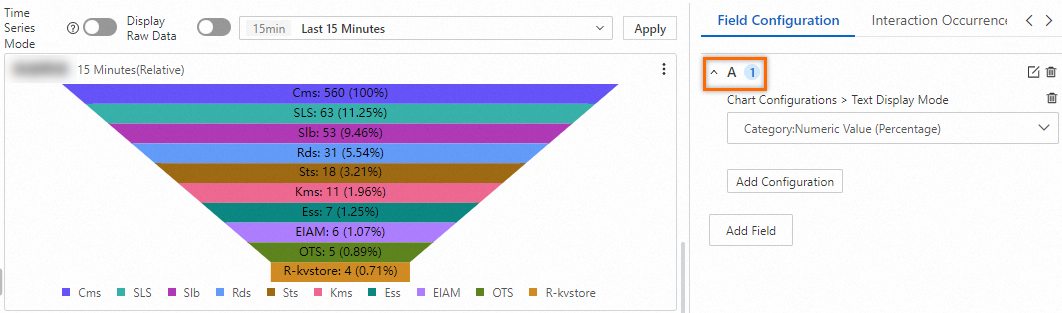
Configuration on the Field Configuration tab
You can configure personalized display settings for the results of a single query statement or for a single column of data in the results. For more information, see Configuration on the General Configurations tab.
For example, in the A section, you can configure personalized display settings for the results of Query Statement A. In the following funnel chart, the Text Display Mode parameter is set to Category:Numeric Value (Percentage).
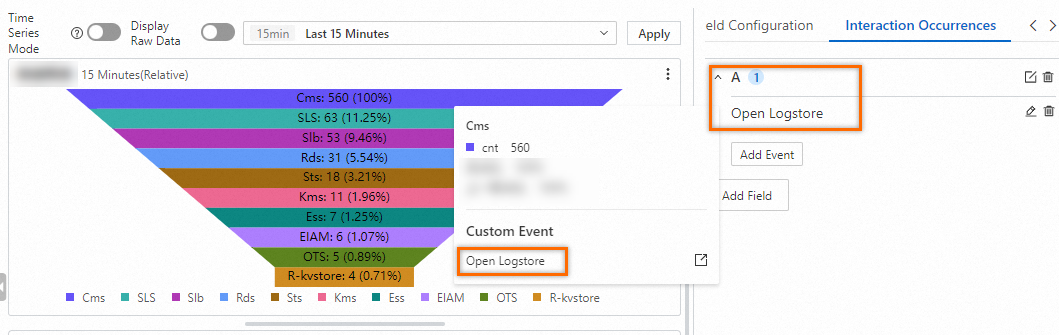
Configuration on the Interaction Occurrences tab
You can configure an interaction occurrence for the results of a single query statement or for a single column of data in the results to analyze data in a finer-grained manner. Supported types of interaction occurrences include Open Logstore, Open Saved Search, Open Dashboard, Open Trace Analysis, Open Trace Details, and Create Custom HTTP URL. For more information, see Interaction occurrences.
For example, in the A section, you can configure an Open Logstore interaction occurrence for the results of Query Statement A. After you configure the interaction occurrence, you can click a point in the funnel chart and click Open Logstore. Then, you are navigated to the Logstore that you specify.