Simple Log Service supports associated monitoring and no-data alerts. This topic describes how to configure associated monitoring and no-data alerts.
Monitoring timeliness
Monitoring workflow
The system executes a query statement based on the time range and the value of the Check Frequency parameter that you specify in your alert rule. After the query and analysis results are returned, the system evaluates the results based on the trigger condition of the alert rule. If the trigger condition is met, the system generates an alert.
Issue analysis
Data indexing latency: You can query data written to Simple Log Service only after a short latency. As a result, some data may fail to be obtained even if the latency is short.
For example, Simple Log Service starts a check at 12:03:30 based on an alert rule in which the query statement uses a time range of 1 Minute(Relative) and the Check Frequency parameter is set to Fixed Interval 1 Minutes. In this case, the statement queries data in the time range of [12:02:30,12:03:30). However, if data is written to Simple Log Service at 12:03:29, the statement may fail to obtain the data.
Query inaccuracy: If logs are generated at different points in time but are written to Simple Log Service at the same minute, the logs have the same index. As a result, a log generated at a later point in time can have an earlier index.
For example, Simple Log Service starts a check at 12:03:30 based on an alert rule in which the query statement uses a time range of 1 Minute(Relative). In this case, the statement queries data in the time range of [12:02:30,12:03:30). If two logs are generated at 12:02:20 and 12:02:50 but are written to Simple Log Service at 12:02:50, the logs can be indexed by using 12:02:20, and the statement cannot obtain the logs based on the time range of [12:02:30,12:03:30).
Optimization suggestions
If you require high accuracy for alerting, refer to the following suggestions to eliminate repeated alerts and false negatives:
Suggestions on data indexing latency: When you configure the Time Range parameter in the Query Statistics dialog box, click Custom below Relative and specify values earlier than the current time for the Start At and End Time fields. For example, set the Time Range parameter to 70Seconds Ago~10Seconds Ago(Relative). A buffer time of 10 seconds helps prevent the issue that some data is not obtained because of a low indexing speed.
Suggestions on query inaccuracy: When you configure the Time Range parameter in the Query Statistics dialog box, select a time frame. For example, set the Time Range parameter to 1 Minute(Time Frame), 5 Minute(Time Frame), or 1 Hour(Time Frame). Then, set the Check Frequency parameter to the same value as the selected time frame. For example, set the Check Frequency parameter to Fixed Interval 1 Minutes, Fixed Interval 5 Minutes, or Fixed Interval 1 Hours.
If you require high timeliness for alerting, refer to the following suggestions to receive alerts at the earliest opportunity. However, duplicate alerts may be generated in this case.
Suggestions on data indexing latency: When you configure the Time Range parameter in the Query Statistics dialog box, click Custom below Relative and specify a value that is earlier than the current time for the Start At field. For example, specify 70 Seconds Ago for the Start At field.
Suggestions on query inaccuracy: When you configure the Time Range parameter in the Query Statistics dialog box, include the previous minute in the time range. For example, set the Time Range parameter to 90Seconds(Relative). Then, set the Check Frequency parameter to Fixed Interval 1 Minutes.
Associate the results of multiple query and analysis operations
In the alerting system of Simple Log Service, the results of a query and analysis operation are referred to as a set. You can use multiple sets for associated monitoring.
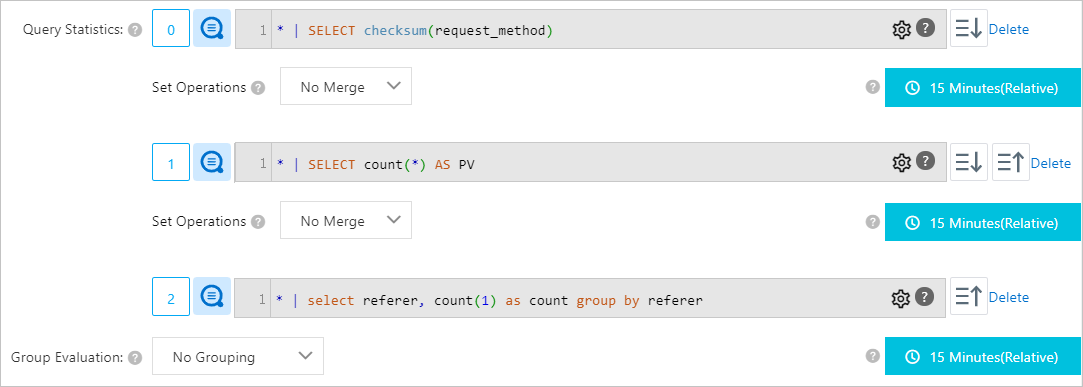
Simple Log Service supports associated monitoring based on up to three sets.
By default, only the first 1,000 rows of data in the results of a query and analysis operation are used for set operations. If you specify three query and analysis operations and set the Set Operations parameter to values other than No Merge, only the first 100 rows of data in the results of each query and analysis operation are used.
If three sets are generated, the system performs a set operation on the first two sets, and then performs a set operation on the results of the first set operation and the third set. Examples:
Set A LEFT JOIN Set B LEFT JOIN Set C: The system performs the LEFT JOIN operation on Set A and Set B. After the results are obtained, the system performs the LEFT JOIN operation on the results and Set C.
Set A JOIN Set B INNER JOIN Set C: The system performs the JOIN operation on Set A and Set B. After the results are obtained, the system performs the INNER JOIN operation on the results and Set C.
Set A LEFT EXCLUDE JOIN Set B No Merge Set C: The system performs the LEFT EXCLUDE JOIN operation on Set A and Set B. The system ignores Set C when obtaining the final query and analysis results.
The following table describes the types of set operations supported by Simple Log Service.
Set operation | Illustration | Description |
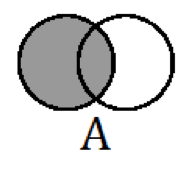
| The two sets are not associated. Set A is used as query and analysis results. Set B is used as the reference source for alert template variables. | |
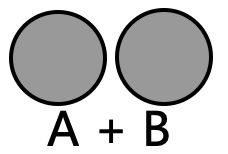
None | Arbitrary data from Set A combines with arbitrary data from Set B. In most cases, this set operation is used to filter data for further evaluation. | |
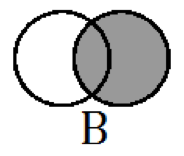
| Data in Set B is added to Set A and aligned by field. | |
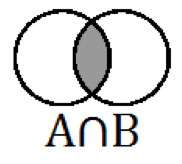
| Only data that exists in Set B is retained in Set A. Set B is the whitelist of Set A. | |
| Partial data from Set B is supplemented to Set A. Set B is the dimension table of Set A. | |
| Partial data from Set A is supplemented to Set B. Set A is the dimension table of Set B. | |
| Set A and Set B complement each other. | |
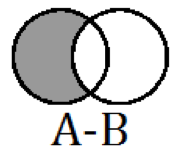
| Data that exists in Set B is deleted from Set A. Set B is the blacklist of Set A. | |
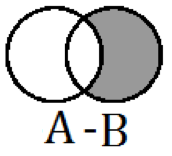
| Data that exists in Set A is deleted from Set B. Set A is the blacklist of Set B. |


No Merge
Requirement
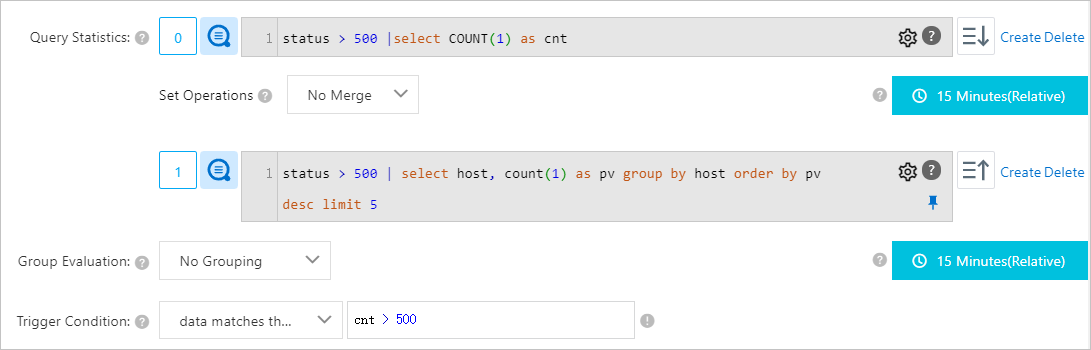
NGINX access logs are monitored. If the number of errors whose status code is 5XX within a 15-minute period exceeds 500, an alert is triggered and an alert notification is sent. The alert notification includes the information about the host on which the alert is triggered.
Configuration
Result
Results of Query Statement 0
The statement queries the number of errors whose status code is 5XX within a 15-minute period.
cnt
1234
Results of Query Statement 1
The statement queries top 5 hosts with the largest number of errors whose status code is 5XX within a 15-minute period and the number of errors for each host.
host
pv
host1
60
host2
55
host3
47
host4
45
host5
30
Results of the set operation
In this example, the Set Operations parameter is set to No Merge. The results of the set operation is the results of Query Statement 0.
CROSS JOIN
Example 1
Requirement
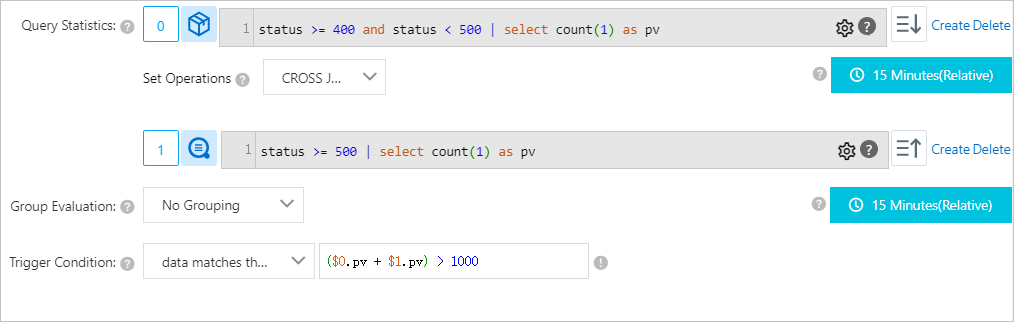
Object Storage Service (OSS) access logs and Server Load Balancer (SLB) access logs are monitored. The number of errors whose status code is 4XX in OSS and the number of errors whose status code is 5XX in SLB are queried at 15-minute intervals. If the total number of errors reaches 1,000, an alert is triggered.
Configuration
Results
Results of Query Statement 0
The statement queries the number of errors whose status code is 4XX in OSS within a 15-minute period.
pv
890
Results of Query Statement 1
The statement queries the number of errors whose status code is 5XX in SLB within a 15-minute period.
pv
567
Results of the set operation
In this example, the Set Operations parameter is set to CROSS JOIN. The following table describes the results of the set operation.
$0.pv
$1.pv
890
567
Additional examples
Results of Query Statement 0
a
b
a1
b1
a2
b2
a5
b5
Results of Query Statement 1
a
c
a1
c1
a3
c3
Results of the set operation
In this example, the Set Operations parameter is set to CROSS JOIN. The following table describes the results of the set operation.
$0.a
b
$1.a
c
a1
b1
a1
c1
a1
b1
a3
c3
a2
b2
a1
c1
a2
b2
a3
c3
a5
b5
a1
c1
a5
b5
a3
c3
JOIN
Example 1
Requirement
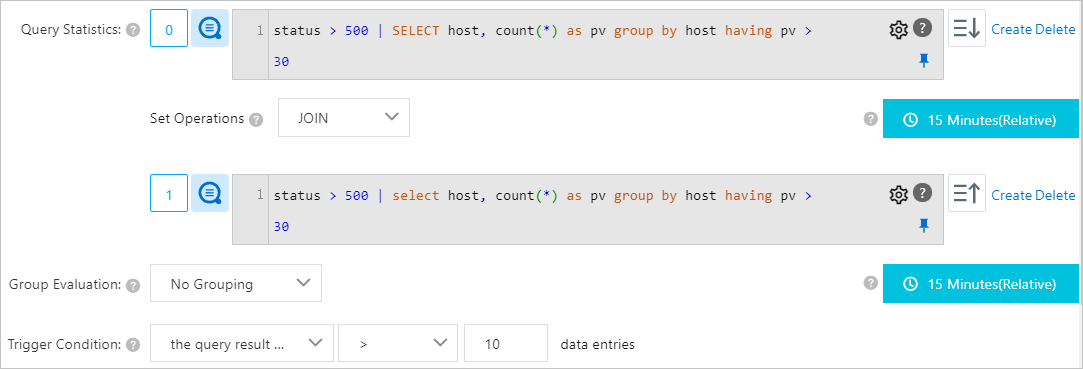
Two logstores are used to store NGINX access logs. One logstore resides in the China (Beijing) region, and the other logstore resides in the China (Shanghai) region. The number of hosts with more than 30 errors whose status code is 5XX is queried at 15-minute intervals. If the number of hosts that meet the specified condition in the two logstores exceeds 10, an alert is triggered.
Configuration
Result
Results of Query Statement 0
The statement queries the number of hosts with more than 30 errors whose status code is 5XX within a 15-minute period and the number of errors for each host.
host
pv
host1
60
host2
55
host3
47
host4
45
host5
31
Results of Query Statement 1
The statement queries the number of hosts with more than 30 errors whose status code is 5XX within a 15-minute period and the number of errors for each host.
host
pv
hosta
70
hostb
45
hostc
44
hostd
42
Results of the set operation
In this example, the Set Operations parameter is set to JOIN. The following table describes the results of the set operation.
host
pv
host1
60
host2
55
host3
47
host4
45
hosg5
31
hosta
70
hostb
45
hostc
44
hostd
42
Additional examples
If the fields in the two query and analysis results do not completely match, the non-matching fields are left empty after the JOIN operation is performed.
Results of Query Statement 0
a
b
a1
b1
a2
b2
Results of Query Statement 1
b
c
b1
c1
b2
c2
Results of the set operation
a
b
c
a1
b1
None
a2
b2
None
None
b1
c1
None
b2
c2
Set A JOIN Set B INNER JOIN Set C: If you specify three query statements, the system performs a set operation on the results of the first two statements. After the results of the first set operation are obtained, the system performs a set operation on the results of the first set operation and the results of the third statement.
Results of Query Statement 0
a
b
a1
b1
a2
b2
Results of Query Statement 1
a
b
a1
b11
a2
b22
a3
b33
Results of the set operation on the results of Query Statement 0 and Query Statement 1
In this example, the Set Operations parameter is set to INNER JOIN and $0.a == $1.a is specified. The following table describes the results of the set operation.
a
$0.b
$1.b
a1
b1
b11
a2
b2
b22
Results of Query Statement 2
a
b
a3
b333
a4
b444
Results of the set operation
In this example, the Set Operations parameter is set to JOIN. The following table describes the results of the set operation.
NoteThe b field in the results of Query Statement 2 is aligned with the $0.b field.
a
$0.b
$1.b
a1
b1
b11
a2
b2
b22
a3
b333
None
a4
b444
None
INNER JOIN
Example 1
Requirement
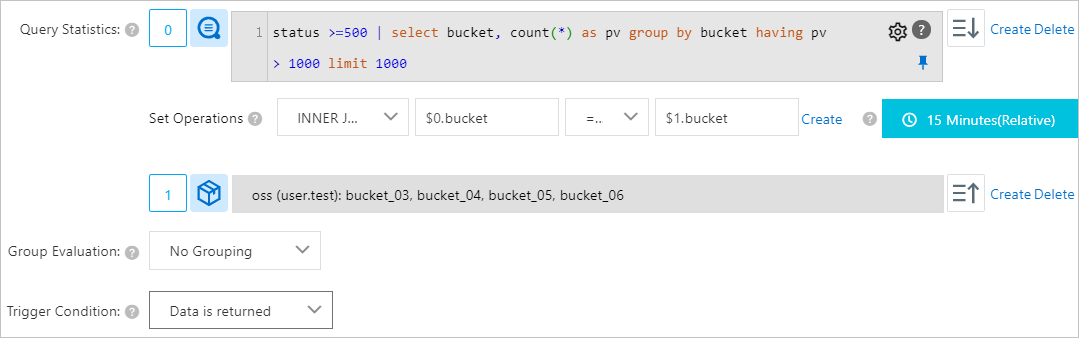
The numbers of errors whose status code is 5XX in specified buckets are monitored. If the number of errors whose status code is 5XX within a 15-minute period exceeds 1,000, an alert is triggered. To meet this requirement, you must add resource data to maintain the bucket whitelist.
Configuration
Result
Results of Query Statement 0
The statement queries buckets with more than 1,000 errors whose status code is 5XX within a 15-minute period.
bucket
pv
bucket_01
1600
bucket_02
1550
bucket_03
1470
bucket_04
1450
Results of Query Statement 1
The following table describes the resource data of buckets.
bucket
desc
bucket_03
for dev team
bucket_04
for test team
bucket_05
for service team
bucket_06
for support team
Results of the set operation
In this example, the Set Operations parameter is set to INNER JOIN and $0.bucket == $1.bucket is specified. The following table describes the results of the set operation.
bucket
pv
desc
bucket_03
1470
for dev team
bucket_04
1450
for test team
Example 2
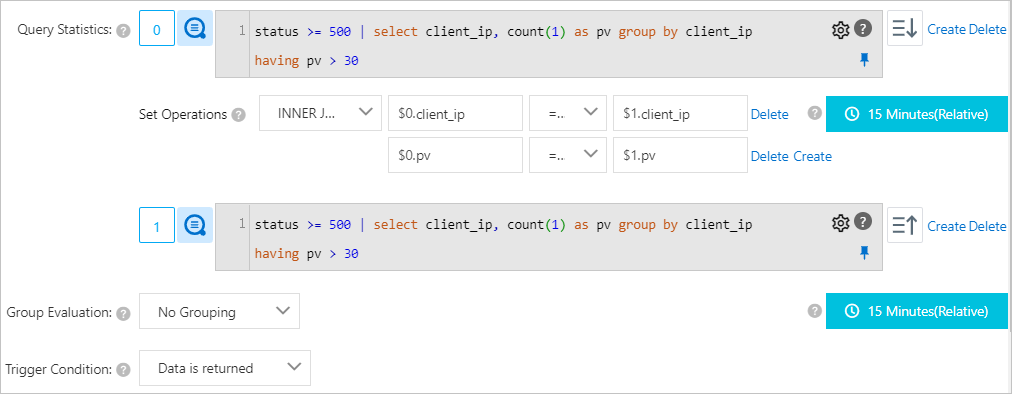
Requirement
Two logstores are used to store NGINX access logs. One logstore resides in the China (Beijing) region, and the other logstore resides in the China (Shanghai) region. Clients with more than 30 errors whose status code is 5XX are queried at 15-minute intervals. If both logstores have errors whose status code is 5XX and the number of errors for the logstore in the China (Beijing) region is greater than that for the logstore in the China (Shanghai) region, an alert is triggered.
Configuration
Result
Results of Query Statement 0
The statement queries clients with more than 30 errors whose status code is 5XX in the logstore in the China (Beijing) region within a 15-minute period and the number of errors for each client.
client_ip
pv
192.0.2.4
60
192.0.2.5
55
192.0.2.6
47
192.0.2.7
45
192.0.2.8
31
Results of Query Statement 1
The statement queries clients with more than 30 errors whose status code is 5XX in the logstore in the China (Shanghai) region within a 15-minute period and the number of errors for each client.
client_ip
pv
192.0.2.5
70
192.0.2.6
45
192.0.2.7
44
192.0.2.8
42
192.0.2.9
42
Results of the set operation
In this example, the Set Operations parameter is set to INNER JOIN, and $0.client_ip == $1.client_ip and $0.pv > $1.pv are specified. The following table describes the results of the set operation.
client_ip
pv
192.0.2.6
47
192.0.2.7
45
Additional examples
A field in the results of Query Statement 0 and a field in the results of Query Statement 1 are not associated but have the same name. The two fields in the results of the specified set operation are automatically prefixed with $0 and $1.
Results of Query Statement 0
a
b
c
d
a1
b1
c1
d1
a2
b2
c2
d2
a3
b3
c3
d3
Results of Query Statement 1
a
b
c
a1
b11
c11
a2
b22
c22
Results of the set operation
In this example, the Set Operations parameter is set to INNER JOIN and $0.a == $1.a is specified. The following table describes the results of the set operation.
a
$0.b
$0.c
d
$1.b
$1.c
a1
b1
c1
d1
b11
c11
a2
b2
c2
d2
b22
c22
LEFT JOIN
Results of Query Statement 0
a
b
a1
b1
a2
b2
a3
b3
Results of Query Statement 1
a
b
c
a1
b11
c1
a2
b22
c2
Results of the set operation
In this example, the Set Operations parameter is set to LEFT JOIN and $0.a == $1.a is specified. The following table describes the results of the set operation.
a
$0.b
$1.b
c
a1
b1
b11
c1
a2
b2
b22
c2
a3
b3
None
None
RIGHT JOIN
Results of Query Statement 0
a
b
c
a1
b11
c1
a2
b22
c2
Results of Query Statement 1
a
b
a1
b1
a2
b2
a3
b3
Results of the set operation
In this example, the Set Operations parameter is set to RIGHT JOIN and $0.a == $1.a is specified. The following table describes the results of the set operation.
a
$0.b
c
$1.b
a1
b11
c1
b1
a2
b22
c2
b2
a3
None
None
b3
FULL JOIN
Results of Query Statement 0
a
b
c
a1
b1
c1
a2
b2
c2
a5
b5
c3
Results of Query Statement 1
a
b
d
a1
b11
d1
a2
b22
d2
a3
b33
d3
Results of the set operation
In this example, the Set Operations parameter is set to FULL JOIN and $0.a == $1.a is specified. The following table describes the results of the set operation.
a
$0.b
c
$1.b
d
a1
b1
c1
b11
d1
a2
b2
c2
b22
d2
a5
b5
c3
None
None
a3
None
None
b33
d3
LEFT EXCLUDE JOIN
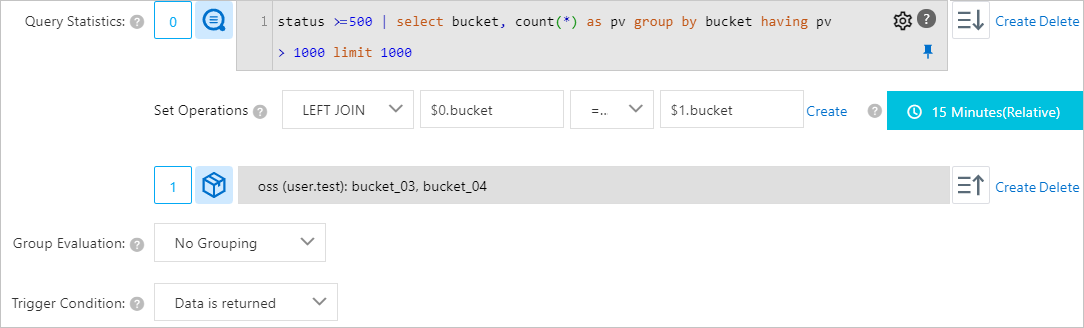
Requirement
The numbers of errors whose status code is 5XX in buckets not specified are monitored. If the number of errors whose status code is 5XX within a 15-minute period exceeds 1,000, an alert is triggered. To meet this requirement, you must add resource data to maintain the bucket blacklist.
Configuration
Result
Results of Query Statement 0
The statement queries buckets with more than 1,000 errors whose status code is 5XX within a 15-minute period.
bucket
pv
bucket_01
60
bucket_02
55
bucket_03
47
bucket_04
45
Results of Query Statement 1
The following table describes the resource data of buckets.
bucket
desc
bucket_03
for dev team
bucket_04
for test team
Results of the set operation
In this example, the Set Operations parameter is set to LEFT EXCLUDE JOIN and $0.bucket == $1.bucket is specified. The following table describes the results of the set operation.
bucket
pv
bucket_01
60
bucket_02
55
RIGHT EXCLUDE JOIN
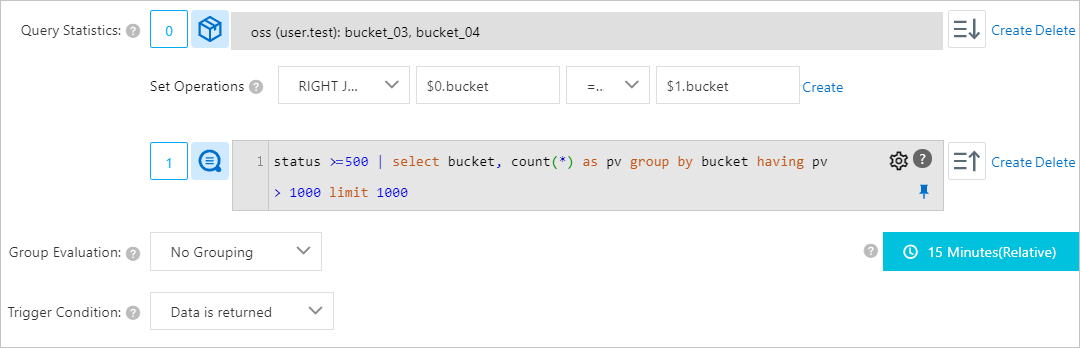
Requirement
The numbers of errors whose status code is 5XX in buckets that are not specified are monitored. If the number of errors whose status code is 5XX within a 15-minute period exceeds 1,000, an alert is triggered. To meet this requirement, you must add resource data to maintain the bucket blacklist.
Configuration
Result
Results of Query Statement 0
The following table describes the resource data of buckets.
bucket
desc
bucket_03
for dev team
bucket_04
for test team
Results of Query Statement 1
The query statement queries buckets with more than 1,000 errors whose status code is 5XX within a 15-minute period.
bucket
pv
bucket_01
60
bucket_02
55
bucket_03
47
bucket_04
45
Results of the set operation
In this example, the Set Operations parameter is set to RIGHT EXCLUDE JOIN and $0.bucket == $1.bucket is specified. The following table describes the results of the set operation.
bucket
pv
bucket_01
60
bucket_02
55
No-data alert
If data loss occurs during a collection process, Simple Log Service receives no data, and this issue may be unnoticed. Therefore, Simple Log Service provides the no-data alert feature to send alert notifications for this type of issue. For example, configure an alert rule to monitor the CPU metrics for each host. If the following conditions are met, an alert is triggered and an alert notification is sent:
The CPU utilization of a host exceeds 95%.
No data is returned for the query and analysis operation.
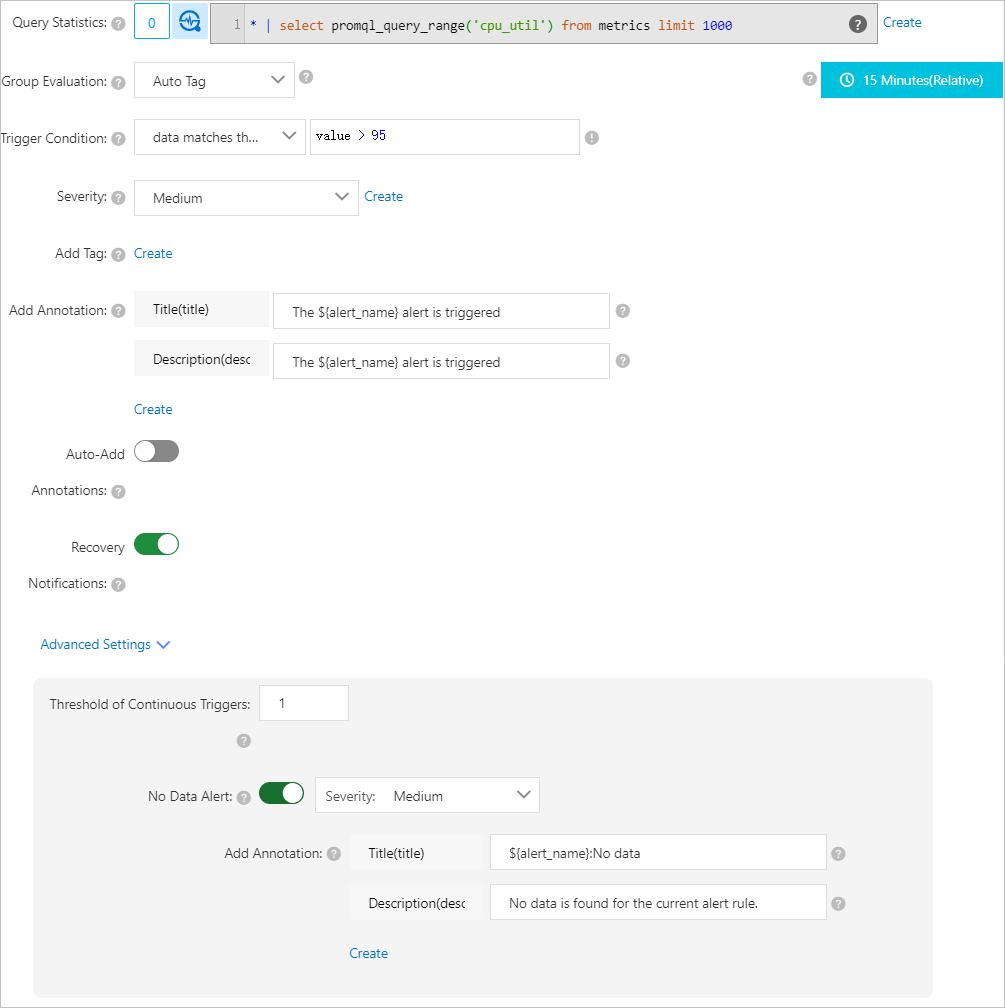
Configure the alert rule based on the following description:
Query Statistics: Specify the following statement to query the CPU utilization of hosts.
* | select promql_query_range('cpu_util') from metrics limit 1000Trigger Condition: Select data matches the expression, enter value>95, and then select Severity: Medium.
If the value field in the query and analysis result is greater than 95, an alert of the medium severity is triggered.
Threshold of Continuous Triggers: If the number of consecutive times that the specified trigger condition is met reaches the value of this parameter, an alert is triggered.
No Data Alert: Turn on No Data Alert. Then, configure the Severity and Add Annotation parameters.
If you turn on No Data Alert, an alert is triggered when the number of consecutive times that no data is returned exceeds the value of the Threshold of Continuous Triggers parameter.
If you turn on No Data Alert, specify an independent severity and annotations for the feature.
The following figure shows the configuration.