The new alerting feature of Simple Log Service is an inclusive intelligent O&M system that allows you to monitor data, denoise alerts, manage alert incidents, and distribute alert notifications. This topic provides a comparison between the new alerting feature of Simple Log Service and various open source alerting systems.
New alerting feature of Simple Log Service
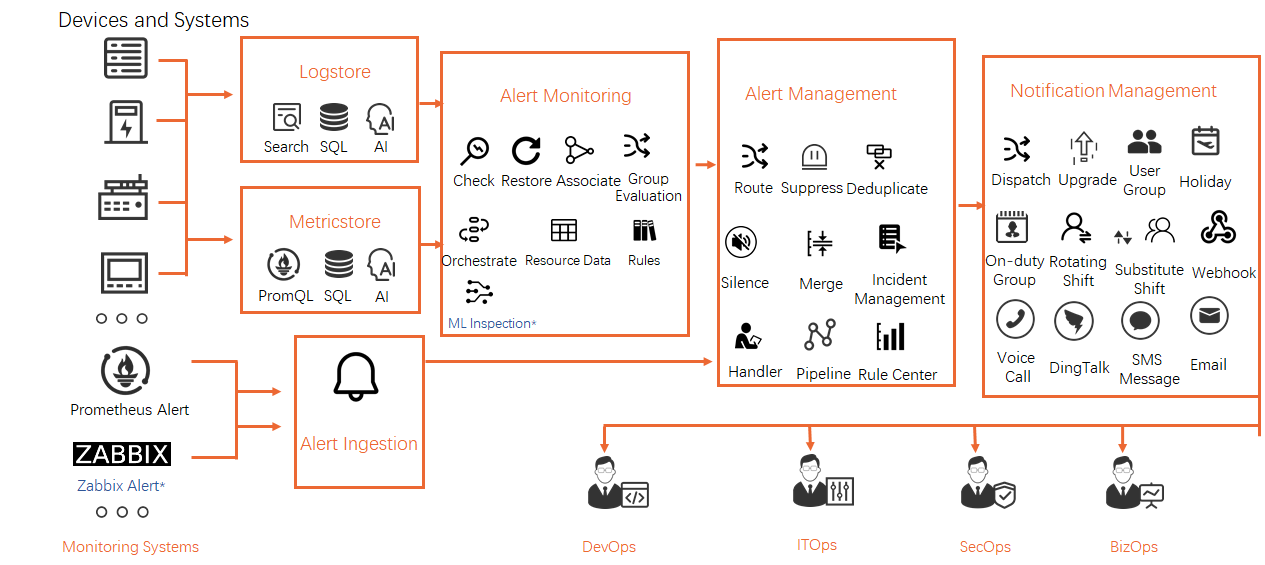
The new alerting feature of Simple Log Service is used to monitor various data such as log data and time series data, receive third-party alerts, denoise alerts, manage alert incidents, and distribute alert notifications. The new alerting feature of Simple Log Service supports 40-plus more use scenarios than the original alerting feature of Simple Log Service and can meet various monitoring, alerting, and O&M requirements of R&D, O&M, security, and operations engineers. For more information, see The alerting feature of Simple Log Service.
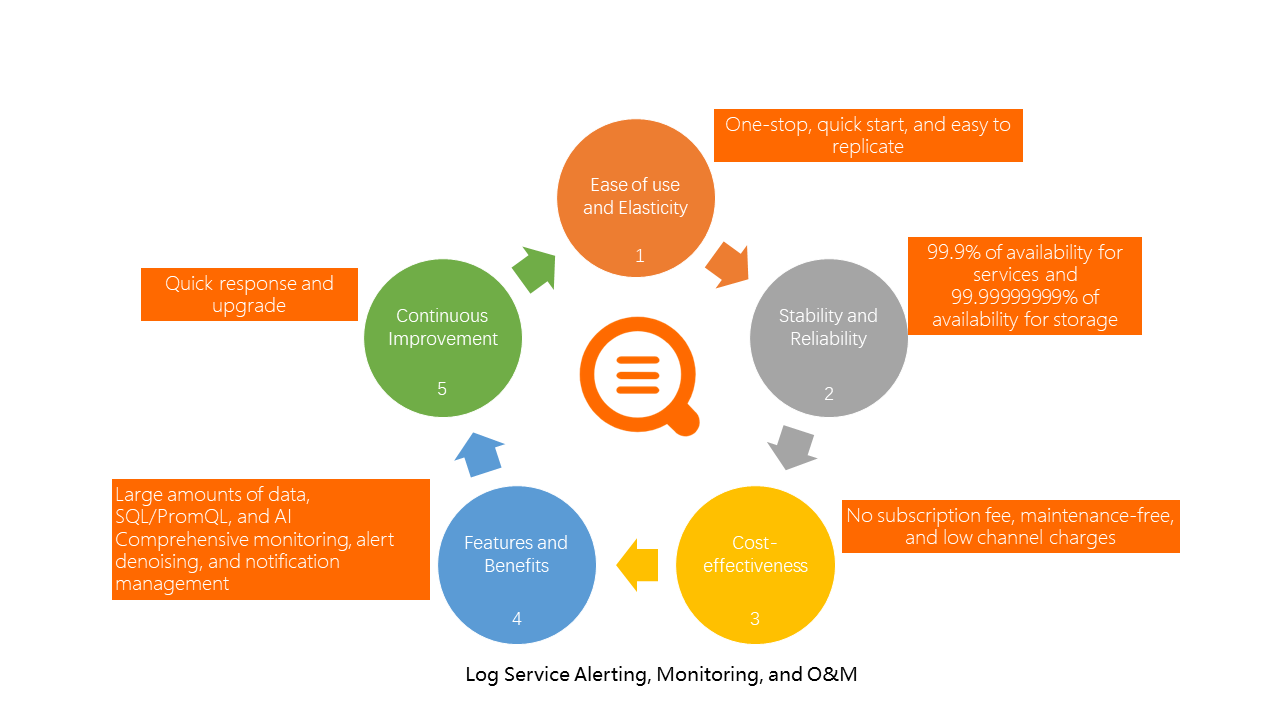
The following figure shows the benefits of the new alerting feature provided by Simple Log Service.
Comparison between Simple Log Service and the ELK Stack
The ELK Stack is a combination of the following three open source projects: Elasticsearch, Logstash, and Kibana. This combination does not provide an alerting feature. If you want to configure alerts for your own ELK Stack, you must purchase the X-Pack extension. The X-Pack extension provides the following two alerting features: Elasticsearch Watcher and Kibana 7.x+Alert. These two alerting features are independent of each other and cannot be coordinated or associated.
Category | Item | Simple Log Service | ELK Stack |
Durability | Alerting service availability | Simple Log Service supports an alerting service availability that is greater than 99.9% and an alerting data storage durability that is greater than 99.99999999%. | The ELK Stack is deployed in a distributed architecture. You must manually configure storage options. |
Cost-effectiveness | Fee | You are not charged for subscriptions, monitoring, or alert management. No O&M labor is required. You need only to pay a small amount of fee for the text messages and voice messages that are sent to notify you of the generated alerts. | You must pay for subscriptions, O&M labor, purchased machines, and third-party text messages and voice messages. |
Monitoring and alerting | Maximum amount of log data and time series data | Simple Log Service can monitor petabytes of data. | The ELK Stack can monitor terabytes of data. |
Syntax | Simple Log Service supports SQL92 and related extensions, PromQL, and alerting syntax extensions. |
| |
Machine learning | Simple Log Service supports more than a dozen AI algorithms that are used for prediction, exception detection, and root cause analysis. | The ELK Stack supports the machine learning algorithms of the X-Pack extension. | |
Data collaboration | Simple Log Service allows you to monitor data across multiple data stores, projects, regions, and accounts in a collaborative manner. | The ELK Stack allows you to merge and analyze data that has homogeneous indexes in the same cluster. | |
Alerting in the event of no data | Simple Log Service can trigger alerts if no data is detected. | The ELK Stack cannot trigger alerts if no data is detected. | |
Alert clearance | Simple Log Service can clear alerts. | The ELK Stack cannot clear alerts. | |
Tag and label | Simple Log Service supports tags and labels. | The ELK Stack supports custom tags. | |
Dynamic adjustment of exception severity | Simple Log Service can dynamically adjust the severity of exceptions. | The ELK Stack cannot dynamically adjust the severity of exceptions. | |
Evaluation by group | Simple Log Service allows you to create custom groups and can evaluate data by group. |
| |
Monitoring control |
| Elasticsearch Watcher can pause and automatically resume monitoring activities based on ACK messages. | |
Alert management | Alert management |
| The ELK Stack does not allow you to manage alerts. |
Notification management | Notification distribution | Simple Log Service can dynamically distribute alert notifications. Simple Log Service also allows you to escalate alert levels, manage contact groups, configure calendars, configure shift schedules, and control the quota for the notification channel that you specify. | The ELK Stack does not allow you to manage the distribution of alert notifications. |
Notification channel | Simple Log Service supports notification channels such as text messages, voice messages, DingTalk, emails, webhooks, and Alibaba Cloud Message Center. Simple Log Service also supports webhook-based notification channels such as Enterprise WeChat, Lark, and Slack. | The ELK Stack supports notification channels such as emails and webhooks. The ELK Stack does not support text messages or voice messages.
|
Comparison between Simple Log Service and Prometheus+Loki 2.0
Prometheus+Loki 2.0 is a combination of the following three open source projects: Prometheus, Loki, and Alertmanager. Prometheus monitors time series data, and Loki monitors log data. Prometheus and Loki send alerts to Alertmanager. Alertmanager centrally manages the alerts.
Category | Item | Simple Log Service | Prometheus+Loki 2.0 |
Durability | Alerting service availability | Simple Log Service supports an alerting service availability that is greater than 99.9% and an alerting data storage durability that is greater than 99.99999999%. | In Prometheus+Loki 2.0, some alerting services are deployed in distributed architectures, and some are deployed in standalone architectures. The storage layer of Prometheus+Loki 2.0 is deployed in a standalone architecture. |
Cost-effectiveness | Fee | You are not charged for subscriptions, monitoring, or alert management. No O&M labor is required. You need only to pay a small amount of fee for the text messages and voice messages that are sent to notify you of the generated alerts. | You must pay for O&M labor, purchased machines, and third-party text messages and voice messages. |
Monitoring and alerting | Maximum amount of log data and time series data | Simple Log Service can monitor petabytes of data. |
|
Syntax | Simple Log Service supports SQL92 and related extensions, PromQL, and the alerting syntax. |
| |
Machine learning | Simple Log Service supports more than a dozen AI algorithms that are used for prediction, exception detection, and root cause analysis. | Prometheus+Loki 2.0 does not support machine learning algorithms. | |
Data collaboration | Simple Log Service allows you to monitor data across multiple data stores, projects, regions, and accounts in a collaborative manner. | Prometheus+Loki 2.0 allows you to run joins cross metrics in the same cluster by using PromQL. | |
Alerting in the event of no data | Simple Log Service can trigger alerts if no data is detected. | Prometheus+Loki 2.0 cannot trigger alerts if no data is detected. | |
Alert clearance | Simple Log Service can clear alerts. | Prometheus+Loki 2.0 can clear alerts. | |
Tag and label | Simple Log Service supports tags and labels. | Prometheus+Loki 2.0 supports tags and labels. | |
Dynamic adjustment of exception severity | Simple Log Service can dynamically adjust the severity of exceptions. | Prometheus+Loki 2.0 cannot dynamically adjust the severity of exceptions. | |
Evaluation by group | Simple Log Service allows you to create custom groups and can evaluate data by group. | Prometheus+Loki 2.0 provides determinate groups and can evaluate data by group. | |
Monitoring control |
| Prometheus+Loki 2.0 can trigger consecutive alerts for a metric based on the threshold that you specify. However, Prometheus+Loki 2.0 cannot pause or automatically resume monitoring activities based on the time that you specify. | |
Alert management | Alert management |
| Prometheus+Loki 2.0 allows you to deduplicate, merge, denoise, and silence alerts. However, Prometheus+Loki 2.0 does not allow you to manage alert incidents or specify owners. |
Notification management | Notification distribution | Simple Log Service can dynamically distribute alert notifications. Simple Log Service also allows you to escalate alert levels, manage contact groups, configure calendars, configure shift schedules, and control the quota for the notification channel that you specify. | Prometheus+Loki 2.0 can only dynamically distribute alert notifications. |
Notification channel | Simple Log Service supports notification channels such as text messages, voice messages, DingTalk, emails, webhooks, and Alibaba Cloud Message Center. Simple Log Service also supports webhook-based notification channels such as Enterprise WeChat, Lark, and Slack. | Prometheus+Loki 2.0 supports notification channels such as emails, Enterprise WeChat, webhooks, PagerDuty, Pushover, Slack, Opsgenie, and VictorOps. You cannot define the body of a webhook URL. Prometheus+Loki 2.0 does not support text messages or voice messages. Prometheus+Loki 2.0 also supports DingTalk, Lark, and Slack that are integrated with third-party plug-ins. |
Comparison between Simple Log Service and InfluxDB 2.0
InfluxDB uses open source OSS 2.0 and Kapacitor to build a monitoring and alerting system. If you want to deploy your InfluxDB system as a cluster, you must purchase the InfluxDB Enterprise edition. The monitoring and alerting system of InfluxDB can monitor only time series data.
Category | Item | Simple Log Service | InfluxDB 2.0 |
Durability | Alerting service availability | Simple Log Service supports an alerting service availability that is greater than 99.9% and an alerting data storage durability that is greater than 99.99999999%. | The InfluxDB Enterprise edition is deployed in a distributed architecture and allows you to configure storage options. Open source InfluxDB is deployed in a standalone architecture. |
Cost-effectiveness | Fee | You are not charged for subscriptions, monitoring, or alert management. No O&M labor is required. You need only to pay a small amount of fee for the text messages and voice messages that are sent to notify you of the generated alerts. | You must pay for subscriptions, O&M labor, purchased machines, and third-party text messages and voice messages. |
Monitoring and alerting | Maximum amount of log data and time series data | Simple Log Service can monitor petabytes of data. |
|
Syntax | Simple Log Service supports SQL92 and related extensions, PromQL, and alerting syntax extensions. | InfluxDB supports Flux. | |
Machine learning | Simple Log Service supports more than a dozen AI algorithms that are used for prediction, exception detection, and root cause analysis. | InfluxDB supports Loud ML. | |
Data collaboration | Simple Log Service allows you to monitor data across multiple data stores, projects, regions, and accounts in a collaborative manner. | InfluxDB allows you to run joins across multiple buckets in the same cluster by using Flux. | |
Alerting in the event of no data | Simple Log Service can trigger alerts if no data is detected. | InfluxDB cannot trigger alerts if no data is detected. | |
Alert clearance | Simple Log Service can clear alerts. | InfluxDB cannot clear alerts. | |
Tag and label | Simple Log Service supports tags and labels. | InfluxDB supports only simple tags. | |
Dynamic adjustment of exception severity | Simple Log Service can dynamically adjust the severity of exceptions. | InfluxDB can dynamically adjust the severity of exceptions. | |
Evaluation by group | Simple Log Service allows you to create custom groups and can evaluate data by group. | InfluxDB cannot evaluate data by group. | |
Monitoring control |
| InfluxDB does not support monitoring control. | |
Alert management | Alert management |
| InfluxDB allows you only to denoise alerts. |
Notification management | Notification distribution | Simple Log Service can dynamically distribute alert notifications. Simple Log Service also allows you to escalate alert levels, manage contact groups, configure calendars, configure shift schedules, and control the quota for the notification channel that you specify. | InfluxDB can only dynamically distribute alert notifications. |
Notification channel | Simple Log Service supports notification channels such as text messages, voice messages, DingTalk, emails, webhooks, and Alibaba Cloud Message Center. Simple Log Service also supports webhook-based notification channels such as Enterprise WeChat, Lark, and Slack. | InfluxDB supports notification channels such as emails, webhooks, exec, PagerDuty, Pushover, Slack, Opsgenie, VictorOps, and HipChat. You cannot define the body of a webhook URL. InfluxDB does not support text messages or voice messages. |