Multi-period estimation functions estimate periods in time series data across different intervals. These functions extract periodic patterns using operations such as the Fourier transform.
Function list
|
Function |
Description |
|
Estimates the period of time series data over different time intervals. |
|
|
Calculates the periodicity of a time series curve using the Fourier transform. Use this function to quickly determine if a curve has periodic patterns. |
ts_period_detect
Syntax:
select ts_period_detect(x,y,minPeriod,maxPeriod)The following table describes the parameters.
|
Parameter |
Description |
Value |
|
x |
The time column, sorted in ascending order. |
A Unix timestamp in seconds. |
|
y |
The value column for each time point. |
None |
|
minPeriod |
The estimated minimum period length, specified as a ratio of the total length of the time series. |
A decimal value in the range (0, 1]. |
|
maxPeriod |
The estimated maximum period length, specified as a ratio of the total length of the time series. Important
The value of maxPeriod must be greater than minPeriod and cannot exceed 0.5. If you set maxPeriod to a value greater than 0.5, the system uses 0.5 by default. |
A decimal value in the range (0, 1]. |
Example:
-
Query
* | select ts_period_detect(stamp, value, 0.2, 0.5) from ( select __time__ - (__time__ % 120) as stamp, avg(v) as value from log GROUP BY stamp order by stamp ) -
Output
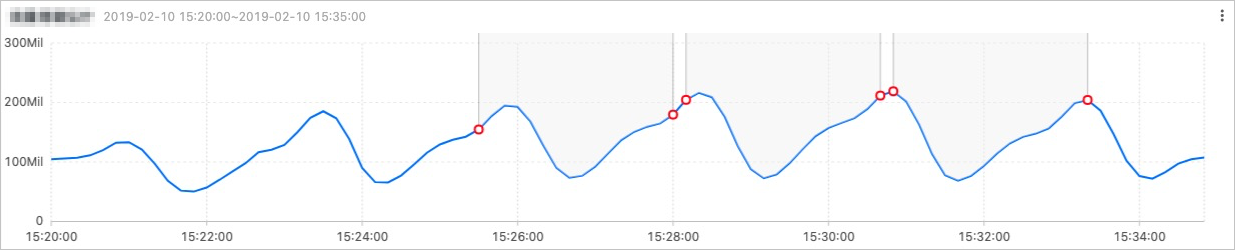
The function returns an array that contains Unix timestamps, statistical values such as average traffic, and period status codes. A status code of 1.0 corresponds to a red circle in the following figure. You can visualize the output on a time series chart, as shown below.
In the following figure, the shaded area between two red circles represents one period. The curve patterns across different periods tend to be similar.
ts_period_classify
Syntax:
select ts_period_classify(stamp,value,instanceName)The following table describes the parameters.
|
Parameter |
Description |
Value |
|
stamp |
The time column, sorted in ascending order. |
A Unix timestamp in seconds. |
|
value |
The value column for each time point. |
None |
|
instanceName |
The time series curve name. |
None |
Example:
-
Query
* and h : nu2h05202.nu8 | select ts_period_classify(stamp, value, name) from log -
Output: The query returns a table that contains three columns: line_name (the timeline name, which is the Auto Scaling group ID), prob (the probability value), and type (the type flag, where
-1.0indicates an anomaly and0.0indicates normal). For example, the Auto Scaling groupasg-2zgicin6zf5ewg188pg5has a prob of1.0and a type of-1.0, which indicates that this timeline is identified as an anomaly.
The output includes the following columns:
|
Column |
Description |
|
line_name |
The time series curve name. |
|
prob |
The proportion of the primary period within the time series curve. The value is in the range [0, 1]. A value of 0.15 is a typical experimental threshold. |
|
type |
The classification of the curve:
|