Zabbix is a commonly used open source monitoring system that provides various alert rules for system monitoring. Zabbix also supports multiple notification methods. You can configure the alert ingestion system of Log Service as a notification method in Zabbix. This way, Zabbix alerts can be ingested into Log Service. Then, the alerting system of Log Service denoises the alerts and sends alert notifications. This topic applies to Zabbix 3.2 to 4.2.
Prerequisites
- An alert ingestion application is created. The Protocol parameter of the alert ingestion application is set to Zabbix. For more information, see Configure webhook URLs for alert ingestion.
- Download the alibaba_cloud_sls.py file.
Configure an alert notification method in the Zabbix console
- Install the notification script on the server where Zabbix is installed.
- Log on to the Zabbix console.
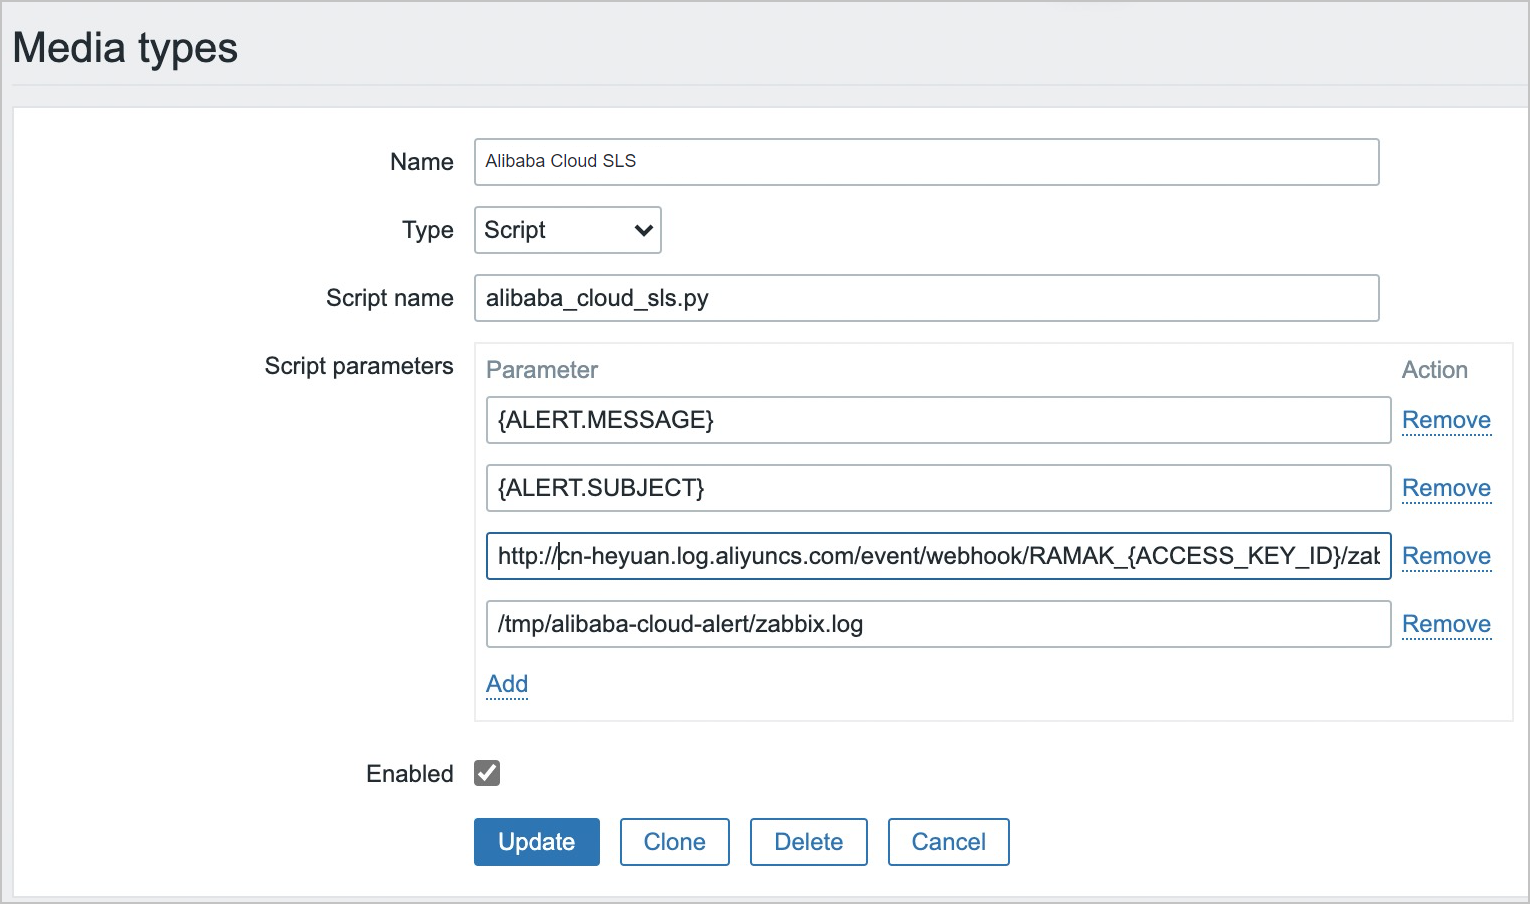
- Add a notification method named Alibaba Cloud SLS.
- Set the parameters and click Add.
 The following table describes the parameters.
Parameter Description Example Name The name of the notification method. Alibaba Cloud SLS Type The format in which alerts are ingested into Log Service. Script Script name The name of the notification script. alibaba_cloud_sls.py Script parameters The parameters of the notification script. Take note of the following instructions: Notice You must set the parameters in sequence based on sample values.- You must enter the full path of a webhook URL in the third line. The webhook URL is
generated after you create an alert ingestion application in the Log Service console.
For more information, see Obtain webhook URLs.
If your Zabbix server is deployed on an Elastic Compute Service (ECS) instance, we recommend that you select the region where the ECS instance resides and use an internal endpoint that can be accessed over a LAN or virtual private cloud (VPC). You can also use the public endpoint that can be accessed over the Internet in a region.
- You must enter the path of a log file in the fourth line.
The alibaba_cloud_sls.py script prints the error logs to the specified log file. Make sure that the Zabbix server has the required permissions to write data to the log file.
- {ALERT.MESSAGE}
- {ALSERT.SUBJECT}
- http://cn-heyuan.log.aliyuncs.com/event/webhook/RAMAK_{ACCESS_KEY_ID}/zabbix
- /tmp/alibaba-cloud-alert/zabbix.log
- You must enter the full path of a webhook URL in the third line. The webhook URL is
generated after you create an alert ingestion application in the Log Service console.
For more information, see Obtain webhook URLs.
- Set the parameters and click Add.
- Create an action.
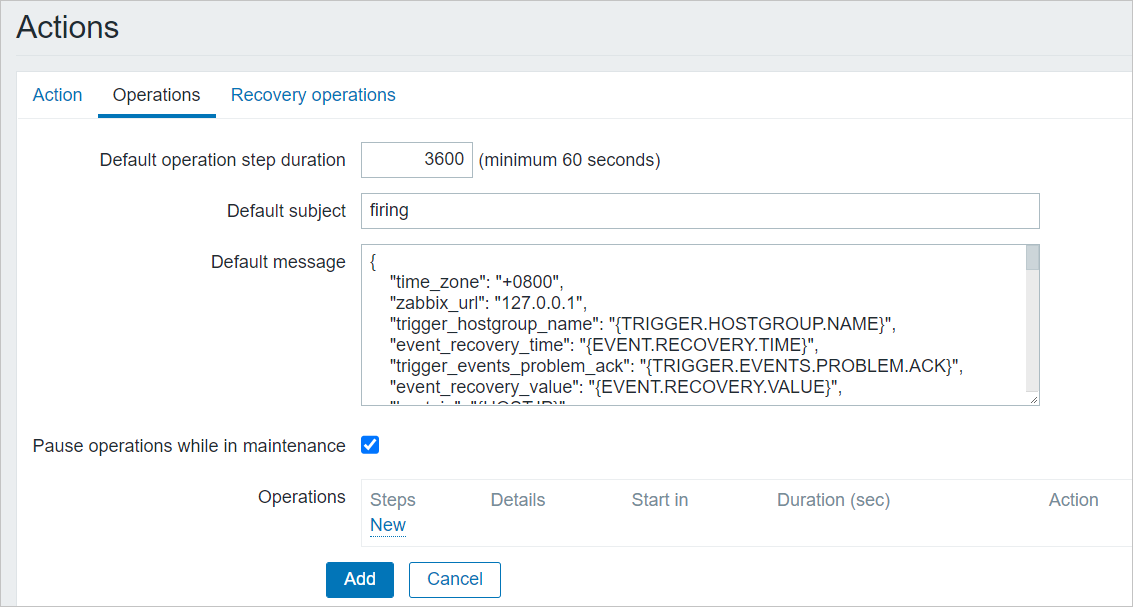
- On the Operation tab, set the parameters. Notice If the Update operations tab is displayed on the Actions page, ignore the tab.
The following table describes the parameters.
Parameter Description Example Default subject Set the value to firing. firing Default message The alert content in the JSON format. You can modify the value of the time_zone field and the value of the zabbix_url field based on your business requirements. You cannot modify the values of other fields.- time_zone: the time zone. Default value: +0800. This value indicates the UTC+8 time zone.
- zabbix_url: the redirect link of the Zabbix console. Default value: 127.0.0.1.
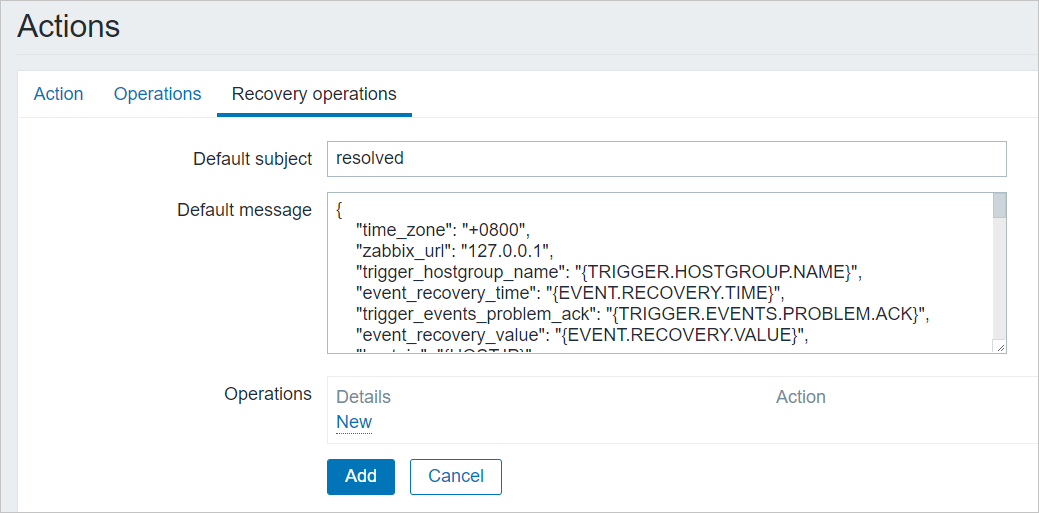
{ "time_zone": "+0800", "zabbix_url": "127.0.0.1", "trigger_hostgroup_name": "{TRIGGER.HOSTGROUP.NAME}", "event_recovery_time": "{EVENT.RECOVERY.TIME}", "trigger_events_problem_ack": "{TRIGGER.EVENTS.PROBLEM.ACK}", "event_recovery_value": "{EVENT.RECOVERY.VALUE}", "host_ip": "{HOST.IP}", "trigger_state": "{TRIGGER.STATE}", "trigger_template_name": "{TRIGGER.TEMPLATE.NAME}", "event_status": "{EVENT.STATUS}", "event_value": "{EVENT.VALUE}", "event_time": "{EVENT.TIME}", "trigger_status": "{TRIGGER.STATUS}", "event_id": "{EVENT.ID}", "event_tags": "{EVENT.TAGS}", "trigger_expression": "{TRIGGER.EXPRESSION}", "event_date": "{EVENT.DATE}", "action_id": "{ACTION.ID}", "trigger_url": "{TRIGGER.URL}", "trigger_nseverity": "{TRIGGER.NSEVERITY}", "trigger_problem_events_problem_ack": "{TRIGGER.PROBLEM.EVENTS.PROBLEM.ACK}", "event_age": "{EVENT.AGE}", "trigger_id": "{TRIGGER.ID}", "action_name": "{ACTION.NAME}", "event_recovery_id": "{EVENT.RECOVERY.ID}", "trigger_events_problem_unack": "{TRIGGER.EVENTS.PROBLEM.UNACK}", "date": "{DATE}", "trigger_name": "{TRIGGER.NAME}", "event_ack_status": "{EVENT.ACK.STATUS}", "trigger_events_unack": "{TRIGGER.EVENTS.UNACK}", "event_recovery_date": "{EVENT.RECOVERY.DATE}", "trigger_problem_events_problem_unack": "{TRIGGER.PROBLEM.EVENTS.PROBLEM.UNACK}", "trigger_events_ack": "{TRIGGER.EVENTS.ACK}", "host_name": "{HOST.NAME}", "time": "{TIME}", "event_recovery_tags": "{EVENT.RECOVERY.TAGS}", "event_recovery_status": "{EVENT.RECOVERY.STATUS}", "trigger_description": "{TRIGGER.DESCRIPTION}", "trigger_value": "{TRIGGER.VALUE}" } - On the Recovery operations tab, set the parameters.
The following table describes the parameters.
Parameter Description Example Default subject Set the value to resolved. resolved Default message The alert content in the JSON format. You can modify the value of the time_zone field and the value of the zabbix_url field based on your business requirements. You cannot modify the values of other fields.- time_zone: the time zone. Default value: +0800. This value indicates the UTC+8 time zone.
- zabbix_url: the redirect link of the Zabbix console. Default value: 127.0.0.1.
{
    "time_zone": "+0800",
    "zabbix_url": "127.0.0.1",
    "trigger_hostgroup_name": "{TRIGGER.HOSTGROUP.NAME}",
    "event_recovery_time": "{EVENT.RECOVERY.TIME}",
    "trigger_events_problem_ack": "{TRIGGER.EVENTS.PROBLEM.ACK}",
    "event_recovery_value": "{EVENT.RECOVERY.VALUE}",
    "host_ip": "{HOST.IP}",
    "trigger_state": "{TRIGGER.STATE}",
    "trigger_template_name": "{TRIGGER.TEMPLATE.NAME}",
    "event_status": "{EVENT.STATUS}",
    "event_value": "{EVENT.VALUE}",
    "event_time": "{EVENT.TIME}",
    "trigger_status": "{TRIGGER.STATUS}",
    "event_id": "{EVENT.ID}",
    "event_tags": "{EVENT.TAGS}",
    "trigger_expression": "{TRIGGER.EXPRESSION}",
    "event_date": "{EVENT.DATE}",
    "action_id": "{ACTION.ID}",
    "trigger_url": "{TRIGGER.URL}",
    "trigger_nseverity": "{TRIGGER.NSEVERITY}",
    "trigger_problem_events_problem_ack": "{TRIGGER.PROBLEM.EVENTS.PROBLEM.ACK}",
    "event_age": "{EVENT.AGE}",
    "trigger_id": "{TRIGGER.ID}",
    "action_name": "{ACTION.NAME}",
    "event_recovery_id": "{EVENT.RECOVERY.ID}",
    "trigger_events_problem_unack": "{TRIGGER.EVENTS.PROBLEM.UNACK}",
    "date": "{DATE}",
    "trigger_name": "{TRIGGER.NAME}",
    "event_ack_status": "{EVENT.ACK.STATUS}",
    "trigger_events_unack": "{TRIGGER.EVENTS.UNACK}",
    "event_recovery_date": "{EVENT.RECOVERY.DATE}",
    "trigger_problem_events_problem_unack": "{TRIGGER.PROBLEM.EVENTS.PROBLEM.UNACK}",
    "trigger_events_ack": "{TRIGGER.EVENTS.ACK}",
    "host_name": "{HOST.NAME}",
    "time": "{TIME}",
    "event_recovery_tags": "{EVENT.RECOVERY.TAGS}",
    "event_recovery_status": "{EVENT.RECOVERY.STATUS}",
    "trigger_description": "{TRIGGER.DESCRIPTION}",
    "trigger_value": "{TRIGGER.VALUE}"
}
- On the Operation tab, set the parameters.
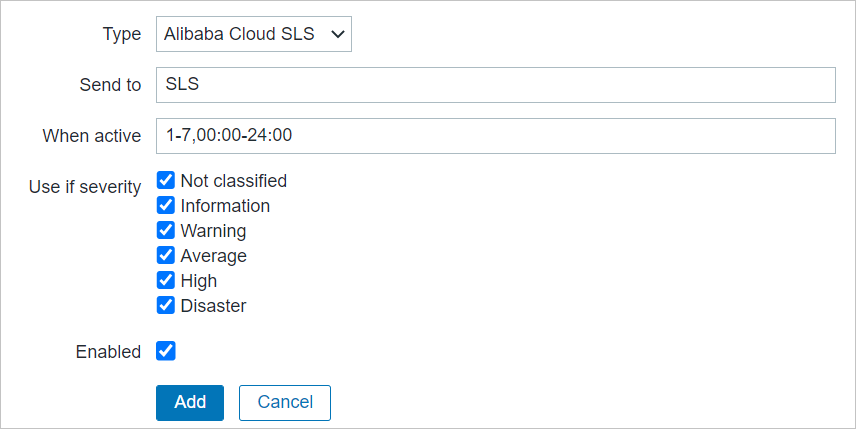
- Configure a notification method for a specific user.
- Set the Type parameter to Alibaba Cloud SLS and click Add.
- Set the Type parameter to Alibaba Cloud SLS and click Add.
Alert parsing
A Zabbix alert contains more than 100 macros. For more information, see Zabbix documentation. Log Service selects only dozens of the macros to construct an alert. The following table provides examples of the macros in Zabbix alerts.
| Zabbix macro name | Example |
|---|---|
| {TRIGGER.ID} | 19006 |
| {TRIGGER.NAME} | test used |
| {EVENT.VALUE} | 1 |
| {DATE} | 2021.06.10 |
| {TIME} | 12:44:23 |
| {EVENT.DATE} | 2021.06.10 |
| {EVENT.TIME} | 19:23:01 |
| {EVENT.RECOVERY.DATE} | "" |
| {EVENT.RECOVERY.TIME} | "" |
| {HOST.NAME} | zabbix-agent |
| {HOST.IP} | 192.0.2.0 |
| {TRIGGER.HOSTGROUP.NAME} | Linux servers |
| {TRIGGER.DESCRIPTION} | The system is running out of free memory. |
| {EVENT.TAGS} | Application:Memory |
| {TRIGGER.NSEVERITY} | 2 |
| {EVENT.ID} | 1036 |
Field mappings
After a Zabbix alert is ingested into Log Service, the alert is converted to an alert that is supported by Log Service by using field mapping. The following table describes the mappings between the alert attributes of Log Service and the alert fields of Zabbix.
| Log Service | Zabbix | Description |
|---|---|---|
| aliuid | None | The ID of the Alibaba Cloud account to which the alert ingestion application belongs. |
| alert_id | {TRIGGER.ID} | The ID of the alert monitoring rule. |
| alert_type | None | The type of the alert. Valid value: sls_pub. |
| alert_name | {TRIGGER.NAME} | The name of the alert monitoring rule. |
| status | {ALERT.SUBJECT} | The status of the alert. Valid values: firing and resolved. |
| next_eval_interval | None | The interval at which the alert is evaluated. Valid value: 0. |
| alert_time | None | The time when the alert was last evaluated.
The value of the alert_time field is calculated based on the values of the {DATE} and {TIME} fields. |
| fire_time | None | The time when the alert is triggered for the first time.
The value of the fire_time field is calculated based on the values of the {EVENT.DATE} and {EVENT.TIME} fields. |
| resolve_time | None | The time when the alert is cleared.
|
| labels | {HOST.NAME} | The labels of the alert.
If you add a label on the Enrichment tab when you create the alert ingestion application, the label is added to the labels field.
Note If the key of the specified label on the Enrichment tab is the same as a subfield in the tags field of the Zabbix alert, the label on the Enrichment tab prevails.
|
| annotations | {EVENT.TAGS} | After the Zabbix alert is ingested into Log Service, the value of the {EVENT.TAGS} field is expanded into multiple key-value pairs and the key-value pairs are added
to the annotations field of the corresponding Log Service alert.
The following fields are also added to the annotations field of the corresponding
Log Service alert:
If you add an annotation on the Enrichment tab when you create the alert ingestion application, the annotation is added to the annotations field. |
| severity | {TRIGGER.NSEVERITY} | The severity of the alert. For more information, see Table 2. |
| policy | None | The alert policy that is specified for the alert ingestion application. For more information, see Description of the policy variable. |
| project | None | The project to which Alert Center belongs. For more information, see Project. |
| drill_down_query | {$ZABBIX.SERVER.URL}, {TRIGGER.ID}, and {EVENT.ID} | The value is a link. You can click the link to go to the alert management page of the Zabbix console. |
| Severity in Zabbix | Severity in Log Service |
|---|---|
| Not Classified | report |
| Information | low |
| Warning | medium |
| Average | medium |
| High | high |
| Disaster | critical |
FAQ
How do I view operation logs?
- Log on to the Zabbix console.
- In the top navigation bar, choose .