Datadog is a monitoring and analysis platform for cloud applications that automatically collects and analyzes logs, metrics, and traces. You can use it to monitor events across your infrastructure and cloud services. This topic describes how to configure a webhook in Datadog to forward alerts to a URL provided by Simple Log Service.
Prerequisites
You have created an alert ingestion application with the Protocol set to Datadog. For more information, see Configure webhook URLs for alert ingestion.
Configure Datadog
Log on to the Datadog console.
Create a webhook.
In the top navigation bar, choose
 > Integrations.
 On the Integrations tab, find the webhooks card. Move the pointer over the card and click Install.
After the integration is installed, move the pointer over the webhooks card and click Configure.
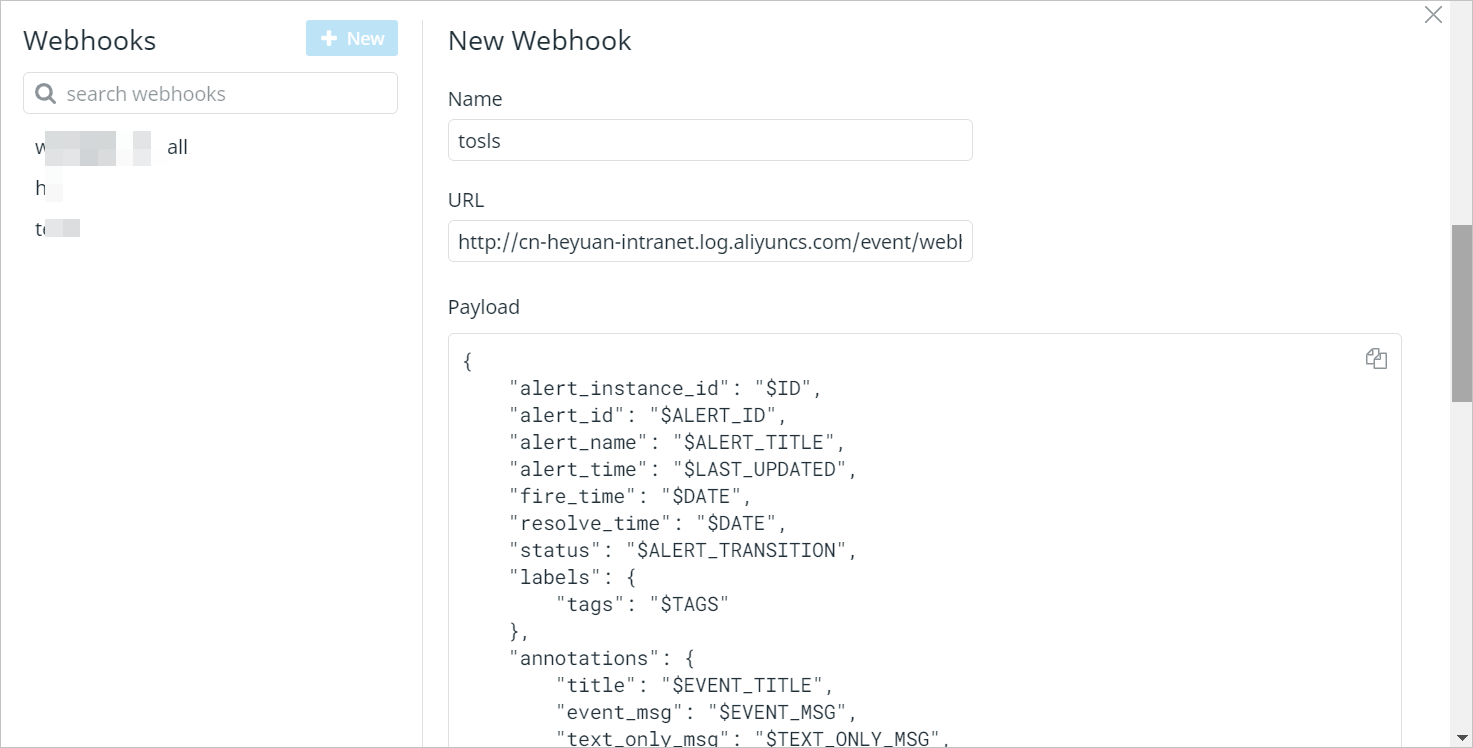
In the Webhooks section, click New.
In the New Webhook section, configure the following parameters and click Save.
Parameter
Description
Name
The name of the webhook.
URL
The receiver of alerts. Enter the full URL of the webhook URL that is generated after you create an alert ingestion service and an alert ingestion application in the alert ingestion system of Simple Log Service. For more information, see Obtain webhook URLs.
Payload
The content of alerts. Datadog generates alerts based on this parameter. For more information about the variables in Datadog alerts, see Datadog documentation.
When you configure the Payload parameter, take note of the following items:
You must add the tags field to the labels field.
You must add the title, event_msg, and text_only_msg fields to the annotations field.
Other available Datadog variables can be added to the labels or annotations objects.
You must configure fields other than labels or annotations based on the following example.
Example:
{
    "alert_instance_id": "$ID",
    "alert_id": "$ALERT_ID",
    "alert_name": "$ALERT_TITLE",
    "alert_time": "$LAST_UPDATED",
    "fire_time": "$DATE",
    "resolve_time": "$DATE",
    "status": "$ALERT_TRANSITION",
    "labels": {
        "tags": "$TAGS"
    },
    "annotations": {
        "title": "$EVENT_TITLE",
        "event_msg": "$EVENT_MSG",
        "text_only_msg": "$TEXT_ONLY_MSG",
        "alert_metric": "$ALERT_METRIC",
        "alert_query": "$ALERT_QUERY",
        "alert_scope": "$ALERT_SCOPE",
        "alert_status": "$ALERT_STATUS",
        "alert_type": "$ALERT_TYPE",
        "email": "$EMAIL",
        "event_type": "$EVENT_TYPE",
        "hostname": "$HOSTNAME",
        "logs_sample": "$LOGS_SAMPLE",
        "metric_namespace": "$METRIC_NAMESPACE",
        "priority": "$PRIORITY",
        "user": "$USER",
        "username": "$USERNAME",
        "__aggreg_key__": "$AGGREG_KEY",
        "__alert_cycle_key__": "$ALERT_CYCLE_KEY",
        "__incident_attachments__": "$INCIDENT_ATTACHMENTS",
        "__incident_commander__": "$INCIDENT_COMMANDER",
        "__incident_customer_impact__": "$INCIDENT_CUSTOMER_IMPACT",
        "__incident_fildes__": "$INCIDENT_FIELDS",
        "__incident_public_id__": "$INCIDENT_PUBLIC_ID",
        "__incident_title": "$INCIDENT_TITLE",
        "__incident_url__": "$INCIDENT_URL",
        "__org_id__": "$ORG_ID",
        "__org_name__": "$ORG_NAME",
        "__security_rule_name__": "$SECURITY_RULE_NAME",
        "__security_signal_id__": "$SECURITY_SIGNAL_ID",
        "__security_signal_severity__": "$SECURITY_SIGNAL_SEVERITY",
        "__security_signal_title__": "$SECURITY_SIGNAL_TITLE",
        "__security_signal_msg__": "$SECURITY_SIGNAL_MSG",
        "__security_signal_attributes__": "$SECURITY_SIGNAL_ATTRIBUTES",
        "__security_rule_id__": "$SECURITY_RULE_ID",
        "__security_rule_query__": "$SECURITY_RULE_QUERY",
        "__security_rule_group_by_fields__": "$SECURITY_RULE_GROUP_BY_FIELDS",
        "__security_rule_type__": "$SECURITY_RULE_TYPE",
        "__link_snapshot_url__": "$SNAPSHOT",
        "__synthetics_test_name__": "$SYNTHETICS_TEST_NAME",
        "__synthetics_first_failing_step_name__": "$SYNTHETICS_FIRST_FAILING_STEP_NAME"
    },
    "severity": "$ALERT_PRIORITY",
    "drill_down_query": "$LINK"
}
Configure a notification channel.
In the top navigation bar, choose
 > Manage Monitors.
 Find the monitor that you want to use and click the
 icon.
icon. Set Notify your team to the webhook you created in Step 2.
Click Save.
Datadog alerts
If you add all the variables that are provided by Datadog but are not used to the annotations field, the variables are included in the alerts that are received by Simple Log Service. The following sample code provides an example of a Datadog alert that is received by Simple Log Service:
{
    "alert_instance_id": "123456",
    "alert_id": "123456",
    "alert_name": "STOP on host:abcdefgh",
    "alert_time": "1628647425000",
    "fire_time": "1628647425000",
    "resolve_time": "1627561306000",
    "status": "Triggered",
    "labels": {
        "tags": "ali,host:abcdefgh,monitor"
    },
    "annotations": {
        "title": "[P1] [Triggered on {host:abcdefgh}] STOP",
        "event_msg": "%%%\nwarning\nhost stop\n @webhook-webhook-test-all\n\nThe monitor was last triggered at Thu Jul 29 2021 12:21:45 UTC.\n\n- - -\n\n[[Monitor Status](https://app.datadoghq.com/monitors/1234?to_ts=1234&group=host%3Aabcdefgh&from_ts=1627560405000)] \u00b7 [[Edit Monitor](https://app.datadoghq.com/monitors#1234/edit)] \u00b7 [[View abcdefgh](https://app.datadoghq.com/infrastructure?filter=abcdefgh)] \u00b7 [[Show Processes](https://app.datadoghq.com/process?sort=memory%2CASC&to_ts=1234&tags=host%abcdefgh&from_ts=1627560405000&live=false&showSummaryGraphs=true)]\n%%%",
        "text_only_msg": "\nwarning\nhost stop\n @webhook-webhook-test-all\n\nMetric Graph: https://app.datadoghq.com/monitors/1234?to_ts=1627561365000&group=host%abcdefgh&from_ts=1627557705000 \u00b7 Monitor Status: https://app.datadoghq.com/monitors/1234?group=host%abcdefgh \u00b7 Edit Monitor: https://app.datadoghq.com/monitors#42655965/edit \u00b7 Event URL: https://app.datadoghq.com/event/event?id=1234 \u00b7 View abcdefgh: https://app.datadoghq.com/infrastructure?filter=abcdefgh \u00b7 Show Processes: https://app.datadoghq.com/process?sort=memory%2CASC&to_ts=None&tags=host%abcdefgh&from_ts=None&live=false&showSummaryGraphs=true",
        "alert_metric": "null",
        "alert_query": "\"datadog.agent.up\".over(\"host:abcdefgh\").by(\"host\").last(2).count_by_status()",
        "alert_scope": "host:abcdefgh",
        "alert_status": "",
        "alert_type": "error",
        "email": "",
        "event_type": "service_check",
        "hostname": "abcdefgh",
        "logs_sample": "null",
        "metric_namespace": "",
        "priority": "normal",
        "user": "null",
        "username": "",
        "__aggreg_key__": "a1b2c3",
        "__alert_cycle_key__": "123456789",
        "__incident_attachments__": "null",
        "__incident_commander__": "null",
        "__incident_customer_impact__": "null",
        "__incident_fildes__": "null",
        "__incident_public_id__": "null",
        "__incident_title": "null",
        "__incident_url__": "null",
        "__org_id__": "123",
        "__org_name__": "ali",
        "__security_rule_name__": "null",
        "__security_signal_id__": "null",
        "__security_signal_severity__": "null",
        "__security_signal_title__": "null",
        "__security_signal_msg__": "null",
        "__security_signal_attributes__": "null",
        "__security_rule_id__": "null",
        "__security_rule_query__": "$SECURITY_RULE_QUERY",
        "__security_rule_group_by_fields__": "null",
        "__security_rule_type__": "null",
        "__link_snapshot_url__": "null",
        "__synthetics_test_name__": "null",
        "__synthetics_first_failing_step_name__": "null"
    },
    "severity": "P1",
    "drill_down_query": "https://app.datadoghq.com/event/event?id=123456"
}
Field mappings
After a Datadog alert is ingested into Simple Log Service, the alert is converted to a Simple Log Service alert based on field mappings. The following sample code provides an example of a Simple Log Service alert:
{
    "aliuid": "aliuid1",
    "alert_instance_id": "123456",
    "alert_id": "123456",
    "alert_type": "sls_pub",
    "alert_name": "STOP on host:abcdefgh",
    "region": "",
    "project": "",
    "project_id": 0,
    "next_eval_interval": 0,
    "alert_time": 1628647425,
    "fire_time": 1628647425,
    "fire_results": null,
    "fire_results_count": 0,
    "resolve_time": 0,
    "status": "firing",
    "results": null,
    "labels":{
        "__ali__": "ali",
        "__host__": "abcdefgh",
        "__monitor__": "monitor"
    },
    "annotations":{
        "__aggreg_key__": "1a2b3c4d",
        "__alert_cycle_key__": "123456",
        "__config_app__": "sls_pub_alert",
        "__link_edit_monitor__": "https://app.datadoghq.com/monitors#1234/edit",
        "__link_metric_graph__": "https://app.datadoghq.com/monitors/1234?to_ts=1628647485000&group=host%abcdefgh&from_ts=1628643825000",
        "__link_monitor_status__": "https://app.datadoghq.com/monitors/123?group=host%abcdefgh",
        "__link_show_processes__": "https://app.datadoghq.com/process?sort=memory%2CASC&to_ts=None&tags=host%abcdefgh&from_ts=None&live=false&showSummaryGraphs=true",
        "__link_view_izbp****hqpwt26z__": "https://app.datadoghq.com/infrastructure?filter=abcdefgh",
        "__org_id__": "579186",
        "__org_name__": "ali",
        "__pub_alert_app__": "",
        "__pub_alert_protocol__": "datadog",
        "__pub_alert_region__": "",
        "__pub_alert_service__": "",
        "alert_query": "\"datadog.agent.up\".over(\"host:abcdefgh\").by(\"host\").last(2).count_by_status()",
        "alert_scope": "host:izbp1cerzh0yyvrhqpwt26z",
        "alert_type": "error",
        "desc": "warning\nhost stop\n@webhook-test\nThe monitor was last triggered at Wed Aug 11 2021 02:03:45 UTC.\n- - -\n",
        "event_type": "service_check",
        "hostname": "abcdefgh",
        "priority": "normal",
        "title": "[P1] [Triggered on {host:abcdefgh}] STOP"
    },
    "severity": 10,
    "policy":{
        "alert_policy_id": "",
        "action_policy_id": "",
        "use_default": false,
        "repeat_interval": "0s"
    },
    "template": null,
    "drill_down_query": "https://app.datadoghq.com/event/event?id=123456"
}
Simple Log Service | Datadog | Description |
aliuid | None | The ID of the Alibaba Cloud account to which the alert ingestion application belongs. |
alert_id | alert_id | The ID of the alert monitoring rule. |
alert_instance_id | alert_instance_id | The ID of the alert. |
alert_type | None | The type of the alert. The value is fixed as sls_pub. |
alert_name | alert_name | The name of the alert monitoring rule. |
status | status | The status of the alert.
|
next_eval_interval | None | The interval at which the alert is evaluated. The value is fixed as 0. |
alert_time | alert_time | The time at which the alert is triggered. |
fire_time | fire_time | The time at which the alert is first triggered. |
resolve_time | resolve_time | The time at which the alert is cleared.
|
labels | labels | The labels of the alert. The system parses the tags field by splitting the string by commas. For each resulting substring:
The keys in the final labels object are always enclosed in double underscores. For example, In the Datadog alert, the labels field may contain unused fields whose values are not null. These fields and their values are added to the labels field in the Simple Log Service alert. |
annotations | annotations | The annotations of the alert. After the Datadog alert is ingested into Simple Log Service, the following fields are added to the annotations field in the Simple Log Service alert:
The following fields are generated by parsing the text_only_msg field in the Datadog alert:
In the Datadog alert, the annotations field may contain unused fields whose values are not null. These fields and their values are added to the annotations field in the Simple Log Service alert. |
severity | severity | The severity of the alert. The following list describes the severity mappings between Datadog and Simple Log Service alerts:
Note If no severity is defined in the Datadog alert, the severity of the Simple Log Service alert is Medium. |
policy | None | The alert policy that is specified for the alert ingestion application. For more information, see Description of the policy variable. |
project | None | The project to which Alert Center belongs. For more information, see Project. |
drill_down_query | drill_down_query | A link to the Datadog event management page for the alert. |