Data Transformation Dashboards
After you create a data transformation job, Simple Log Service automatically creates a dashboard for the job. You can view operational metrics for the job on this dashboard. This topic describes the operational metrics available and how to view data transformation dashboards.
View Dashboards
After you create a data transformation job, you can view its dashboard on the Data Transformation Overview page.
Log on to the Simple Log Service console.
In the Projects section, click the one you want.

In the left-side navigation pane, choose .
-
Click the target data transformation job. In the Execution Status area, view the dashboard information.
Overview Metrics
The following table lists the overview metrics.
-
Total logs read: The total number of logs read from all shards of the source Logstore.
-
Total logs delivered: The total number of logs read from all shards of the source Logstore and successfully written to the destination Logstore.
-
Total failed logs: The total number of logs read from all shards of the source Logstore that failed during the transformation process.
-
Log delivery ratio: The ratio of logs successfully delivered to the destination Logstore to the total logs read from the source Logstore.
Transformation Rate
The transformation rate indicates the number of logs processed by the data transformation job within a one-minute window.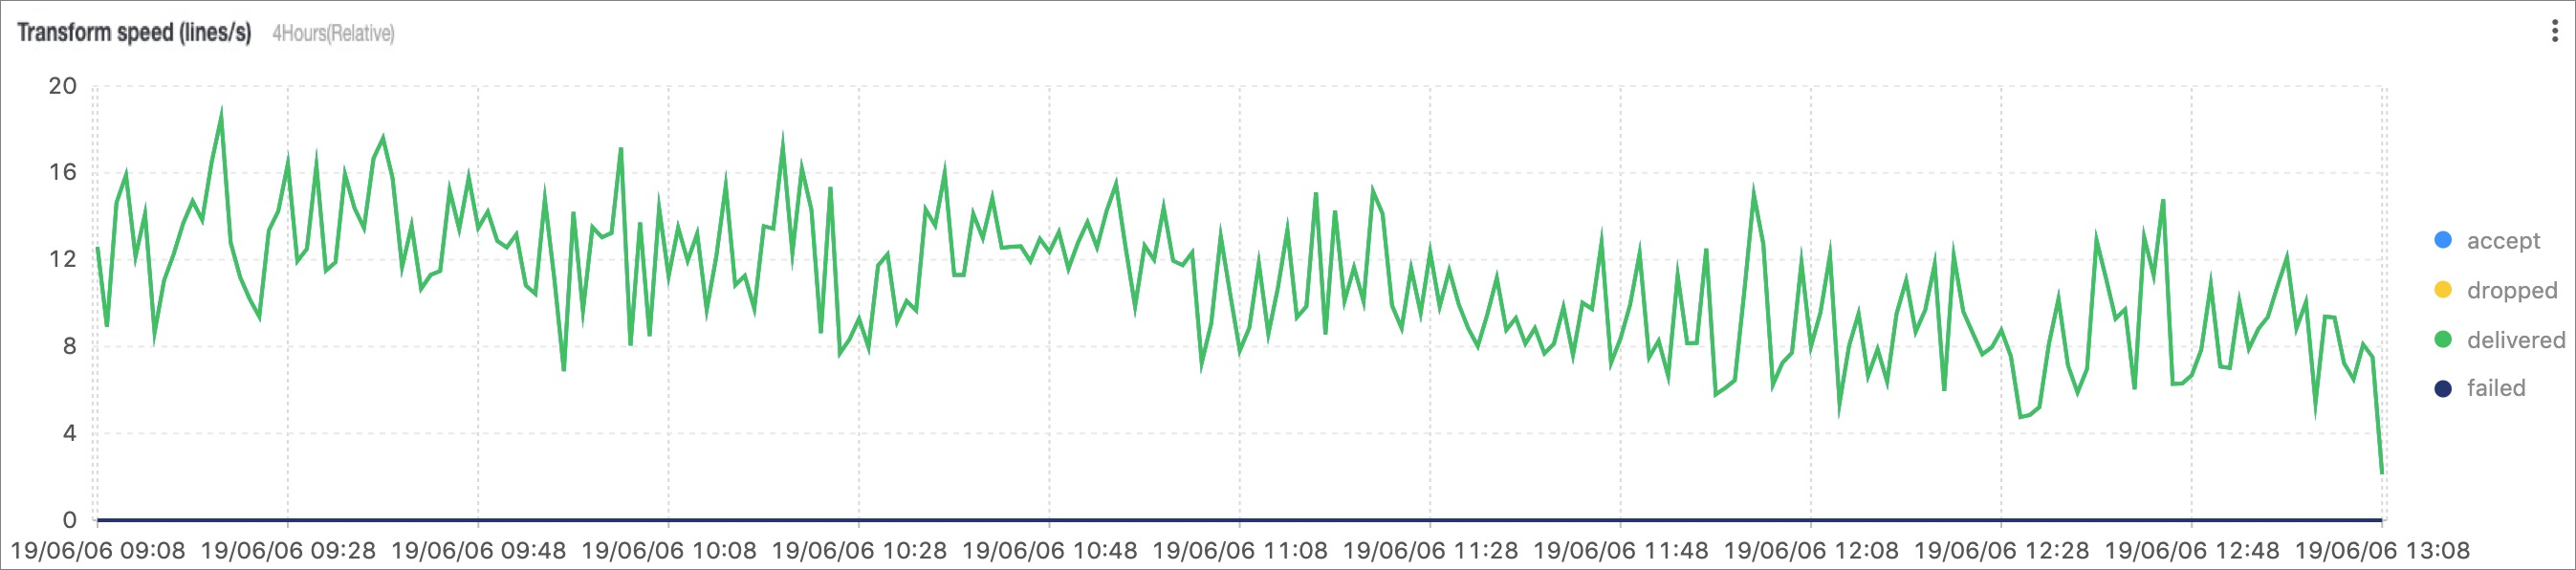
-
Accepted: The number of logs read from all shards of the source Logstore.
-
Dropped: The number of logs read from all shards of the source Logstore and discarded as expected by the rule script.
-
Delivered: The number of logs read from all shards of the source Logstore and successfully written to the destination Logstore.
-
Failed: The number of logs read from all shards of the source Logstore that failed during the transformation process.
Shard Consumption Latency and Shard Consumption Rate
These metrics are calculated within a one-minute window while the transformation job reads data from the source Logstore. They represent per-shard metrics.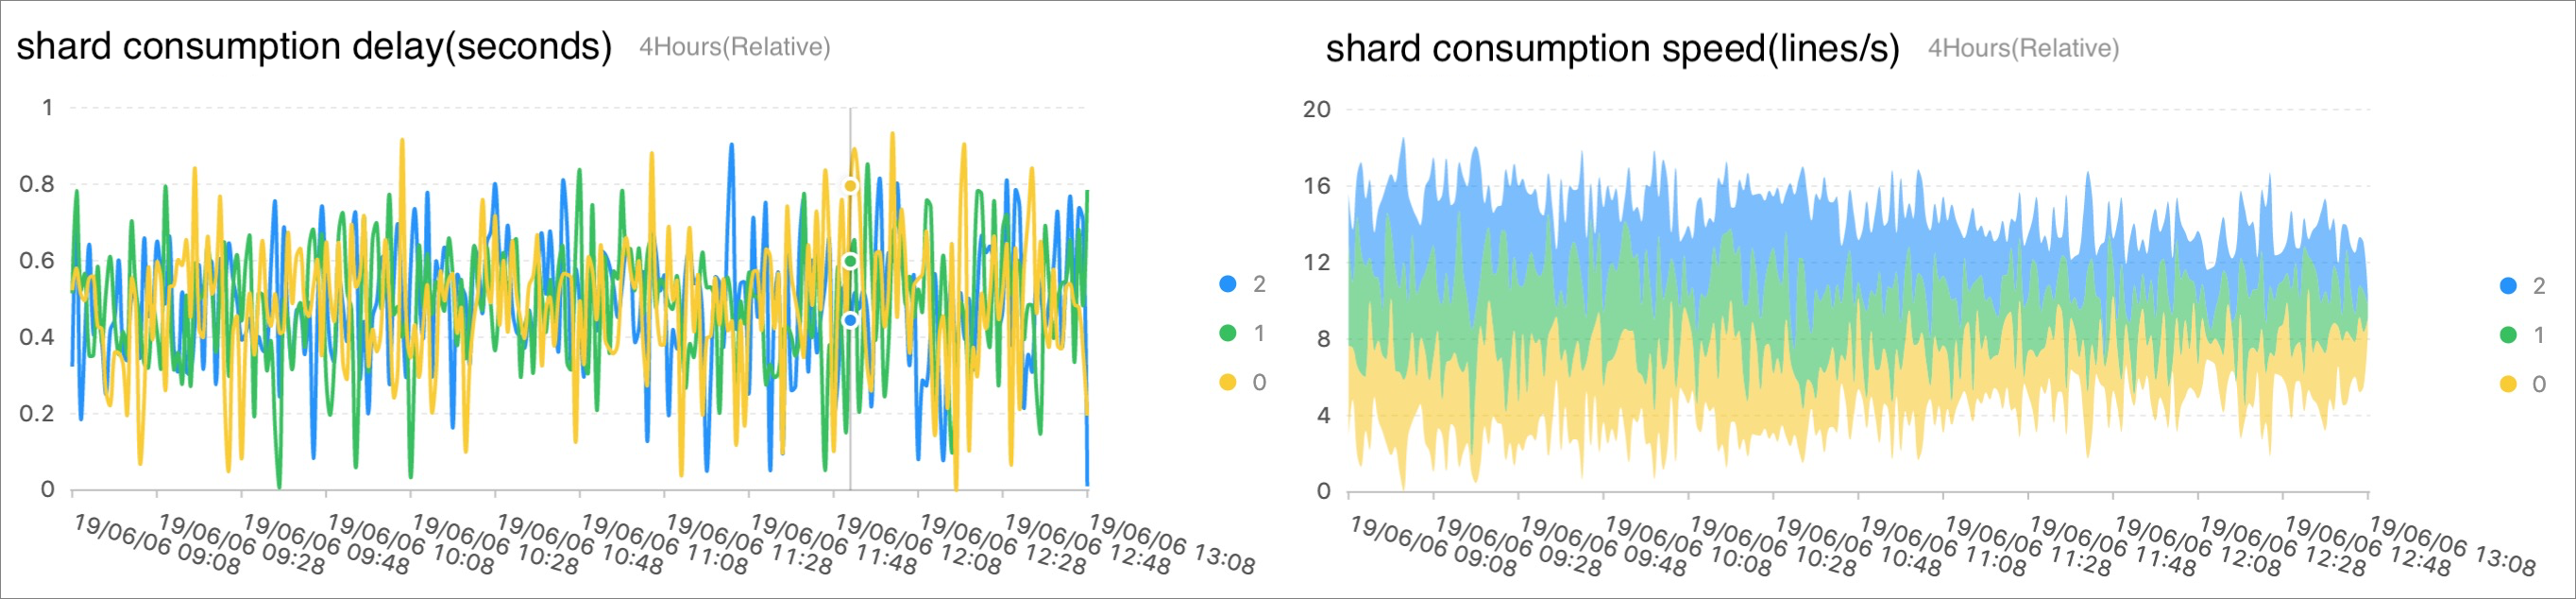
-
Consumption latency: The difference between the time when logs in a shard are fully consumed and the time when the latest log in that shard is generated. Both times are based on the server receive time of the shard data.
-
Consumption rate: The average number of logs read per second by a shard within a one-minute window.
When processing real-time logs, consumption latency is typically around 1 second. When processing historical log data, consumption latency may be high at the start of the job. As data transformation progresses, consumption catches up and latency decreases.
Active Shards
Displays the number of log lines processed per second by each shard—accepted, dropped, delivered, or failed—over a recent period.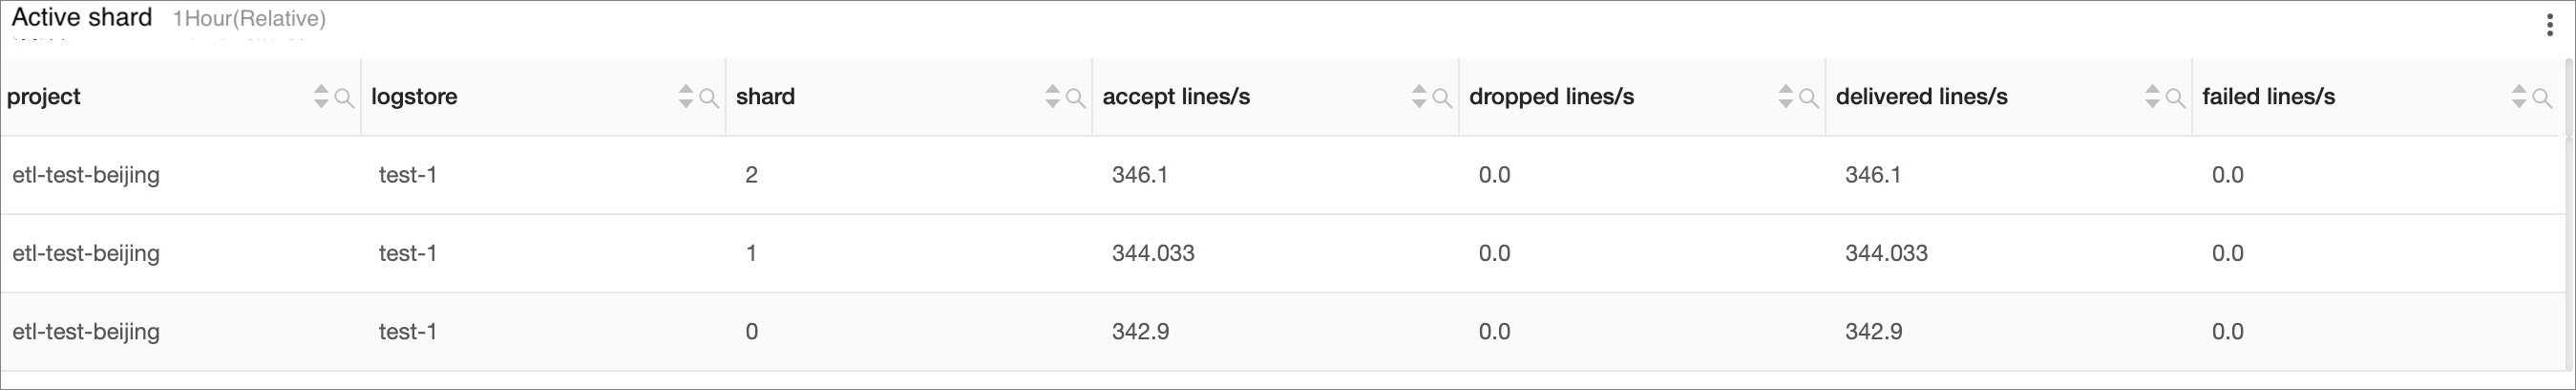
Anomaly Details
Based on the reason field, you can identify the rule script that might have caused the error.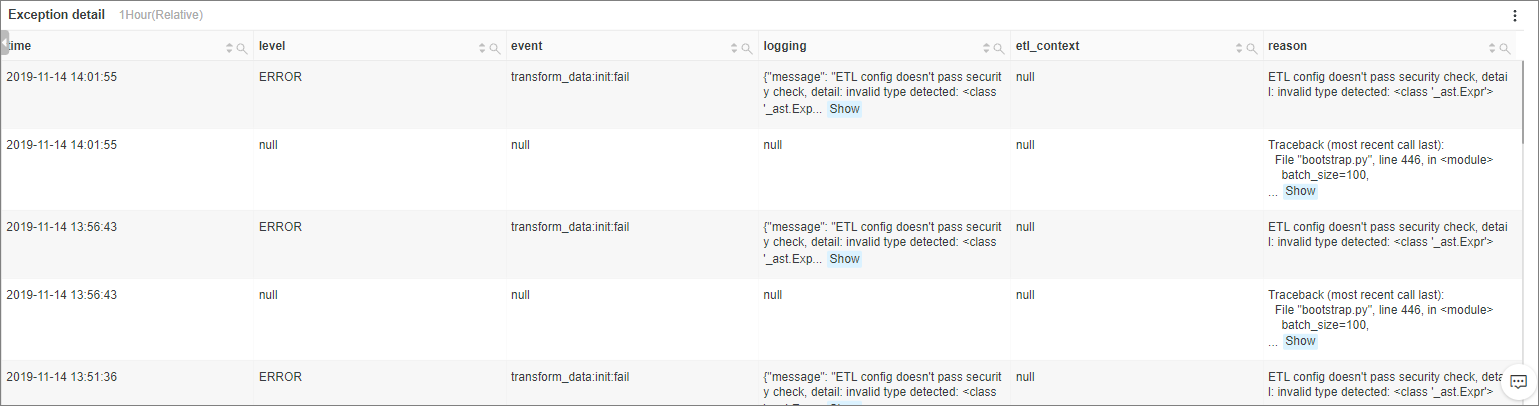
You can also retrieve complete error logs by searching for the keywords ERROR or WARNING in the internal-etl-log Logstore under the current Project.